TigerSoft
News Service 10/30/2008 www.tigersoft.com More
information later today.
TigerSoft
News Service 10/30/2008 www.tigersoft.com More
information later today.HOW TGERSOFT CAN SAVE YOU
A LOT OF MONEY IN THE STOCK MARKET.
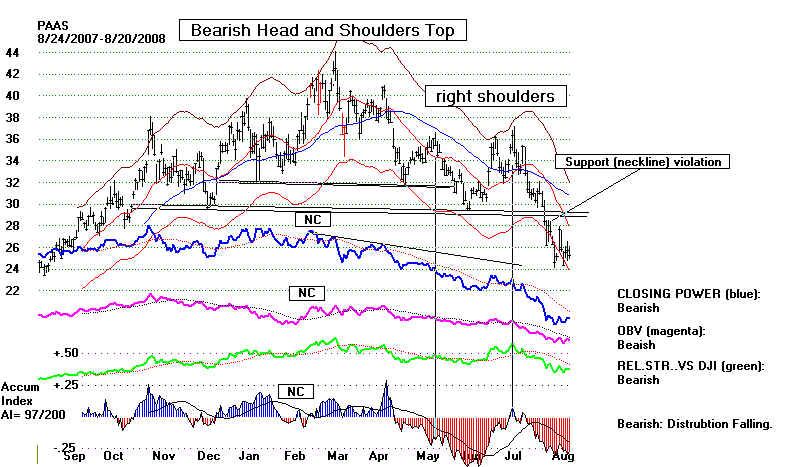
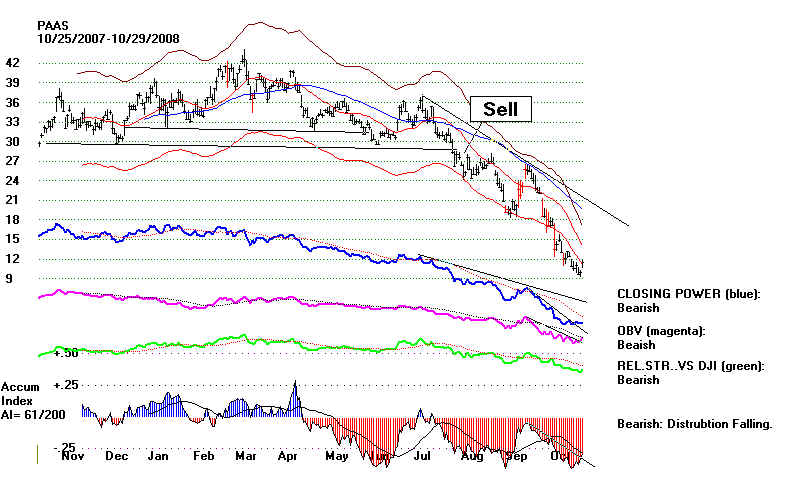
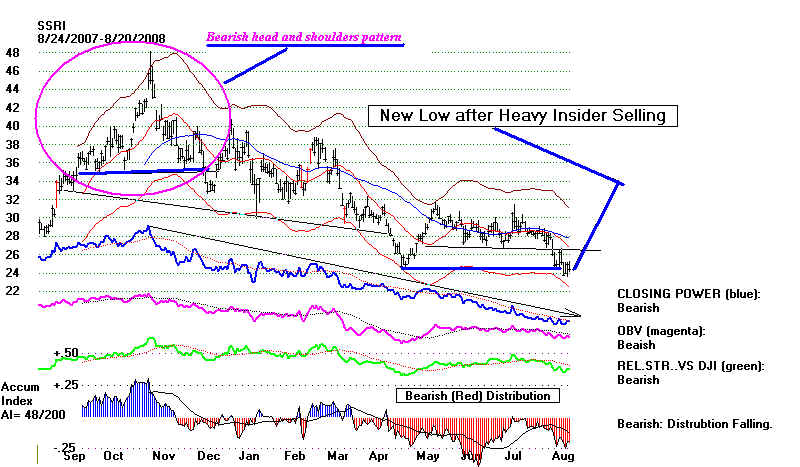
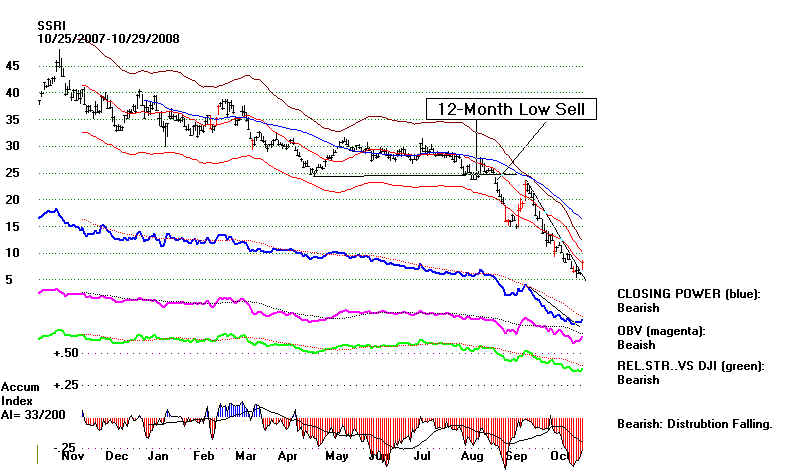
SPOT THE CLASSIC SIGNS OF TOPS
The Cases of Two Silver Stocks: PAAS and SSRI
by William Schmidt, Ph.D.
 |
Tiger
Software
Research on Individual Stocks upon Request: Composite Seasonality Graph
|
|
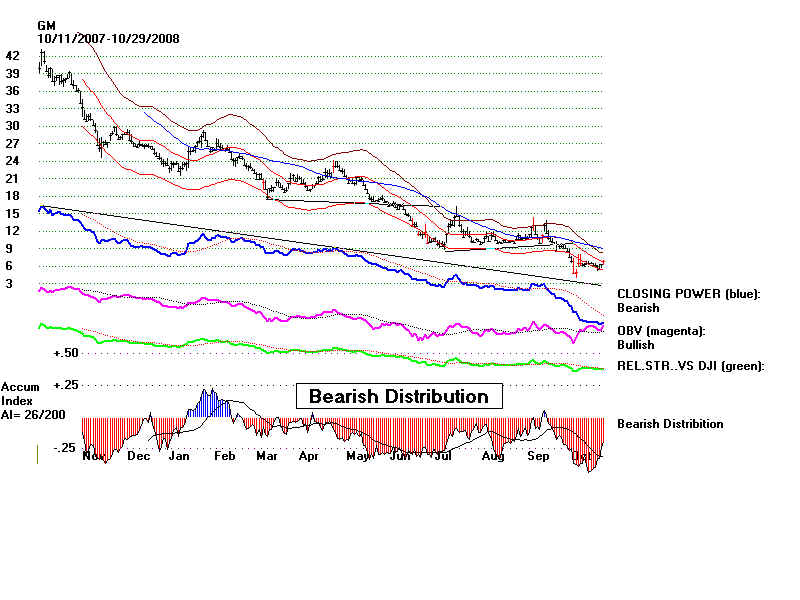
HOW TIGERSOFT CAN SAVE YOU A LOT OF MONEY IN THE STOCK MARKET. SPOT THE CLASSIC SIGNS OF TOPS The Cases of Two Silver Stocks: PAAS and SSRI by William Schmidt, Ph.D. TigerSoft's inventions, the "Accumulation Index" and "Closing Power", show you what insiders are doing with their own money. Forget what they are saying, watch whether they are buying or selling, It is vital to your investment survival that you understand the degree to which the stock market is rigged by insiders and market professionals against the unwary investor. Step #1, memorize below what a stock looks like on its way to bankruptcy. IndyMac Bank illustrates this. Google "TigerSoft" "Bankruptcy" to see other examples. 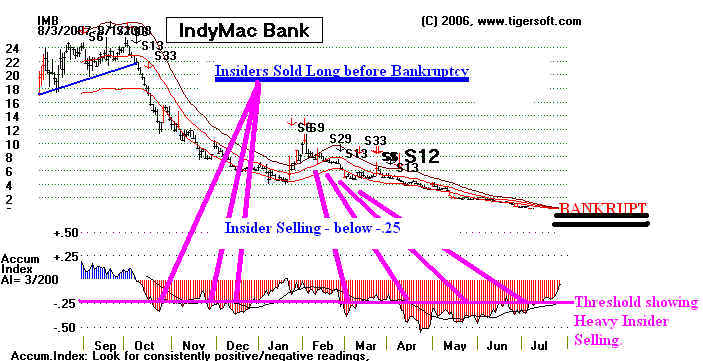
Step #2, read Insider Trading Is Rampant and Unregulated
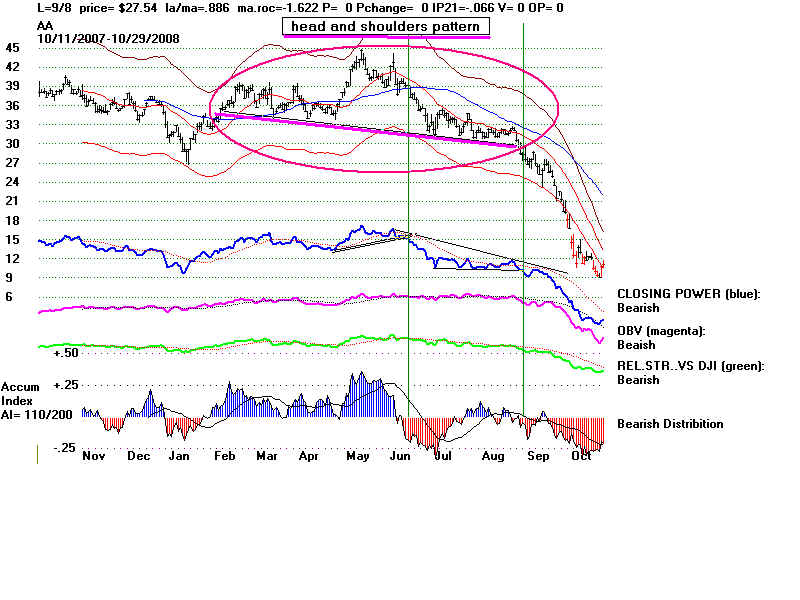
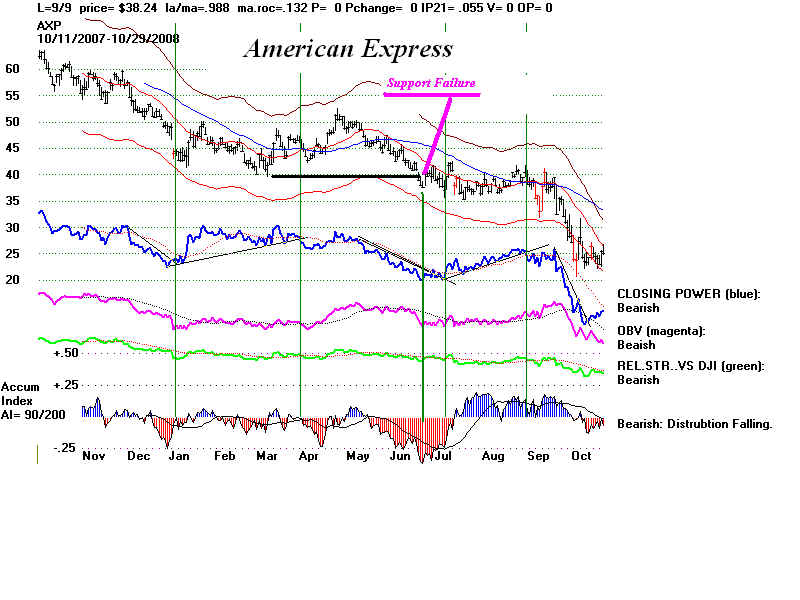
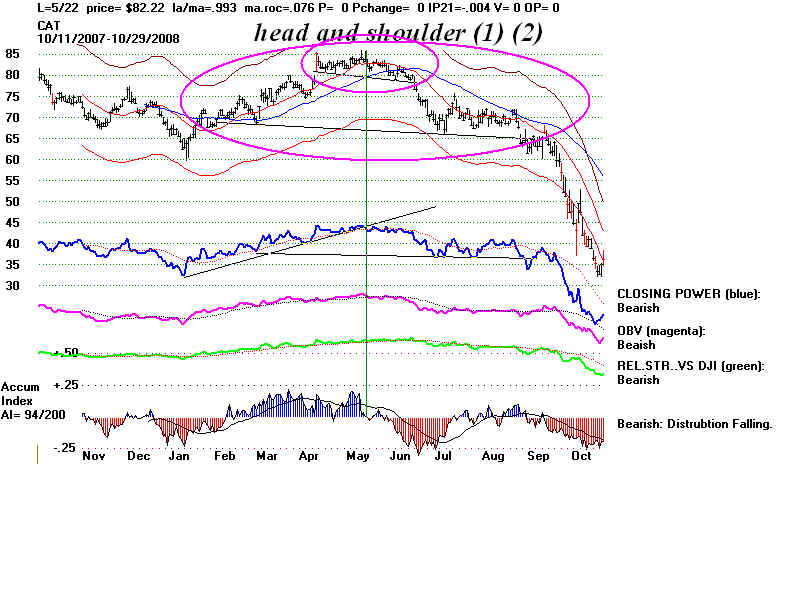
Classic technical analysis will help you recognize key chart patterns,
|
 |
 |
  |