 TigerSoft
News Service 8/6/2008 www.tigersoft.com
TigerSoft
News Service 8/6/2008 www.tigersoft.com Use TigerSoft 's Many UniqueTools
To Spot Insider Trading
And
Learn What Savvy Professionals Are
Intending for Your Stocks
Examples: Gold, Copper and Silver Stocks
Original Tools, Unique to TigerSoft
TigerSoft Accumulation Index
IPA
ITRS - Intermediate-Term Relative Strength
Opening Power
Closing Power
TigerSoft Day Traders' Index
Synchronicity and Asynchronicity
by William Schmidt, Ph.D. - Creator of TigerSoft
 |
Tiger
Software
Research on Individual Stocks upon Request: Composite Seasonality Graph
|
|
TigerSoft's Unique and
Original Tools To Spot Insider Trading. In the stock market, we compete with some pretty cut-throat people. They are no longer effectively regulated by the SEC. So, if you want to do well over time, use TigerSoft and see what their intentions are for your stocks. Here we illustrate the use of the best indicators which I have invented for this purpose since 1981. Every day we see the truth of the propositions that "Insiders always know" and professionals are apt to know long before the broad public finds out. Not for nothing do we say: "TigerSoft's unique technical trading tools will give you virtual access to the gilded board rooms on Wall Street." Tiger's Accumulation Index, IPA, Opening Power, Closing Power and Day Traders' Tool TigerSoft's Closing Power is very important. It needs more attention. The simplest approach: watch for its trend-breaks. Here are recent charts of Gold and Silver. --------------------------------------- Gold ------------------------------------------------ 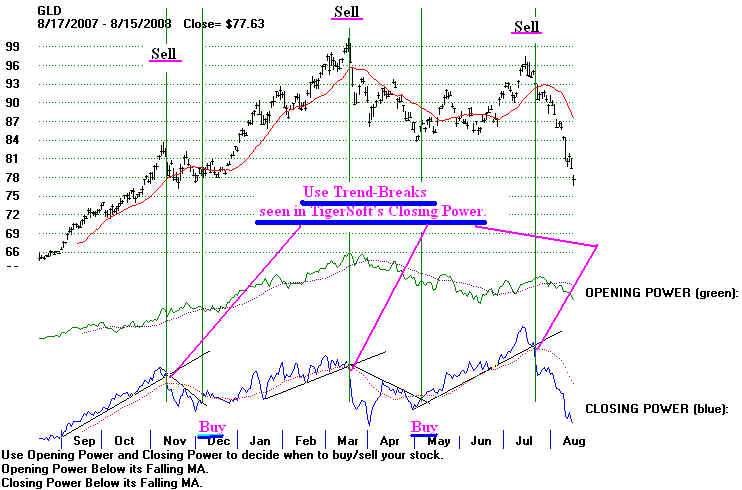 ----------------------------------------------- Silver ------------------------------------------------------ 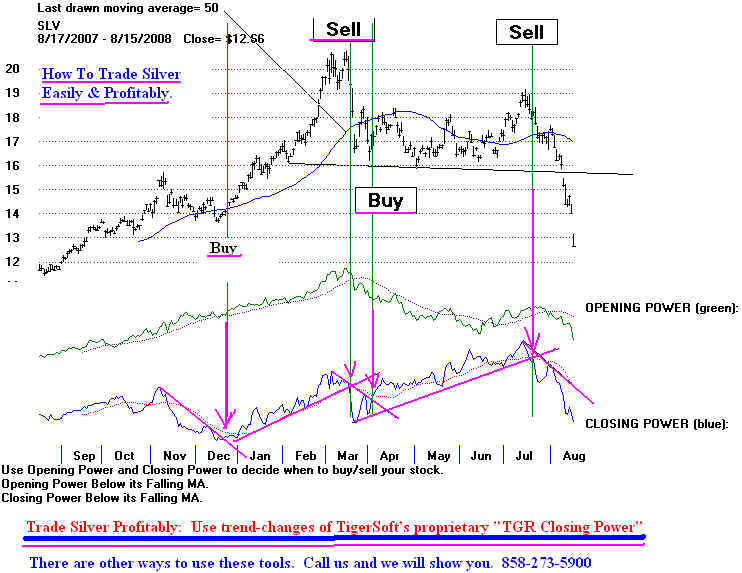 Crude Oil - Weekly Accumulation What happens to crude oil is of great significance to holders of gold and gold stocks. A steep rise on crude oil brings inflation. When there's inflation investors seek to buy gold as a hedge against their paper money declining in value. TigerSoft's weekly chart of crude oil shows very high and steady positive (blue) accumulation for much of the last 5 years, especially since last April. This represents heavy institutional buying. The current decline is therefore most likely a temporary shakeout. We reach this conclusion because "big money" is in crude oil. They are not apt to be wrong. They are apt to be strong holders. And they are apt to buy more on the current decline. So, while crude oil is dropping now, it is not likely to stay down. And if it starts up again vigorously, Gol will rise, too. Crude oil is being talked down in the Presidential political campaign. Both candidates are saying they will seek to make America much more independent of foreign oil. They have said they would want more off-shore drilling to take place in the Gulf states and along the Atlantic coast. This jaw-boning is having an effect on crude oil. Weekly Crude Oil - "CL1600" = perpetual contract for crude oil A 50% retracement yields a downside target of 100. 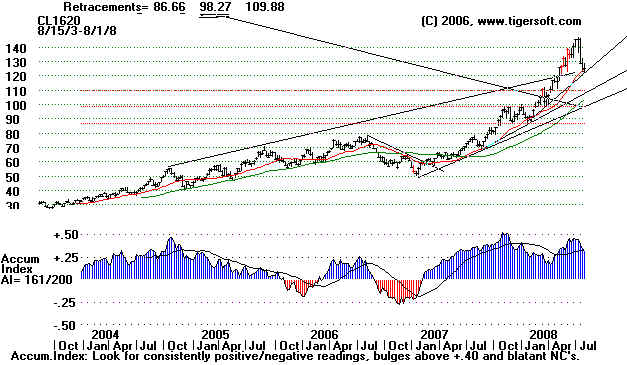 Crude Oil - Daily Accumulation ("CL1600" = perpetual contract for crude oil) We like to buy on new highs when the previous levels of Accumulation are generally very positive and the current level is above +.25. These are readily flagged by our Tiger-Power-Ranker. This works with daily and weekly charts. After a long run upwards, it's usually a good idea to take profits when the stock drops below the 50-day ma and the Tiger Accumulation Index is negative. These are Sell S29s. They are flagged and the signal appears on the chart. If you are a current user, view the Help Section for more examples. . 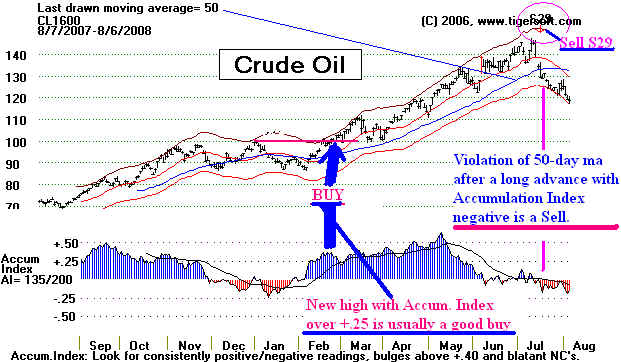 Crude Oil - Daily Accumulation - IPA Indicator IPA is an indicator that is similar to our Accumulation Index.. Cross-overs after a long advance are usually good sells. 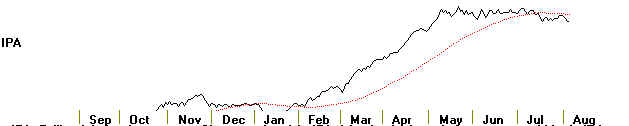 NEM - Newmont Mining. The five year, weekly chart of NEM, Newmont, shows a stock that has spent most of this timing rallying and falling back. In all this, the channel is rising. The TigerSoft Accumulation Index shows no steady pattern of Accumulation (big money buying) or Distribution (big money selling). 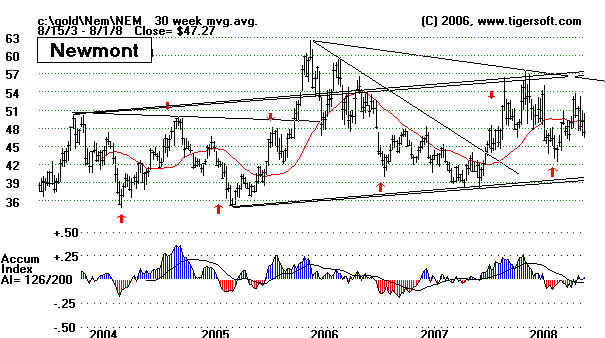 NEM - Newmont Mining. The next chart, a one-year daily chart of NEM, Newmont, shows a bearish head and shoulders top pattern that was formed from November to February. This price pattern was made more bearish by the presence of steady red Distribution during most of this period. Prices tagging the upper band with the TigerSoft Accumulation Index negative constitute a reliable sell. The bearishness of this pattern prompted me to do a full report of NEM on 2/14/2008. The conclusion reached was that the stock was spending far too much money fighting environmental law suits and bribing public officials. If Gold ever started declining, they would probably lose money. Their production costs were rising faster than the price of gold. NEM and OBV - On-Balance-Volume More recently the stock has formed another bearish head and shoulders top. The tagging of the upper band was too quickly reversed in late June. Now the stock is breaking down with red big-money distribution. The breakdown will probably bring a test of the year-long support at 44. There is another technical problem. Look at the pink trendline for the stock's OBV. This is a measure of aggressive buying and selling. It is is a downtrend. Since it usually takes ample aggressive buying to push a stock up past overhead price resistance, the stock will probably have trouble rallying. 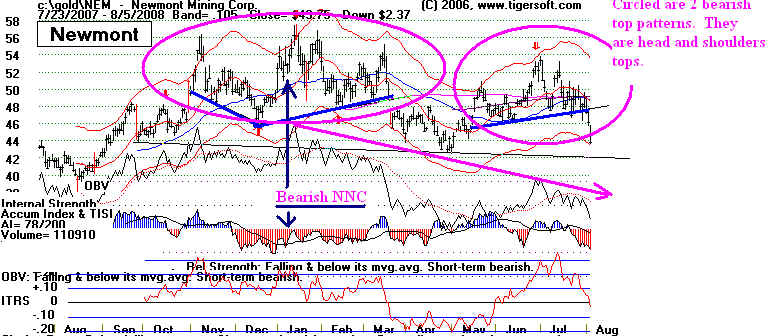 NEM and TigerSoft's Opening Power and Closing Power The openings in stocks are advertising for the public. The general public is more likely to place orders in overnight for the opening. A sequence of rising openings means the broader public is actively buying the stock. It can be shown over and over that the less informed general public is more emotional and more likely to be wrong about most stock than informed professionals. What professionals think about the stock is indicated by the trend of the TigerSoft Closing Power. A falling trend is bearish, even when openings tend to be higher. Almost always, the stock will fall when the TigerSoft Closing Power breaks its uptrend, as in early June in NEM's case. When using TigerSoft's Closing Power take note of its readings and trend when the stock reaches the upper band. The January price peak at the upper band occurred with the TigerSoft Closing Power lower than what it was on the November peak. This is a bearish Closing Power non-confirmation of a new high. 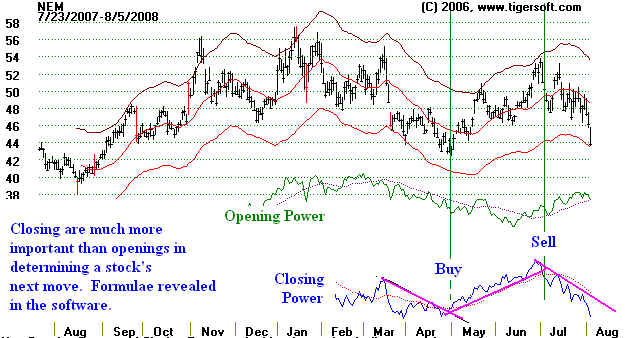 NEM and TigerSoft's Day Traders' Tool Day Traders' sentiment is normally a good measure of a stock's internal strength. Watch closely this tool for trend-breaks. The TigerSoft Day traders' Tool is currently declining. When that trend is broken the stock will be a good trading buy. Use this tool in conjunction with the trends shown by TigerSoft's Accumulation Index and Closing Power. Doing this, your rate of trading successes will rise significantly, especially it you have been making decisions because they simply felt right. Emotions are predictable to professionals. And so, investors who are emotional are "played", and thus are proven wrong most of the time. 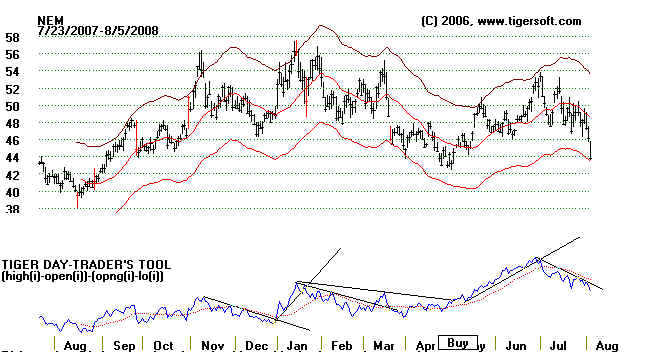 |
|
FCX - Freeport-McMoran - Copper and Gold Use Weekly Accumulation Index to conform new highs. Weekly data requires Dial Data subscription $50/mo) and Procomm for Windows (about $50). 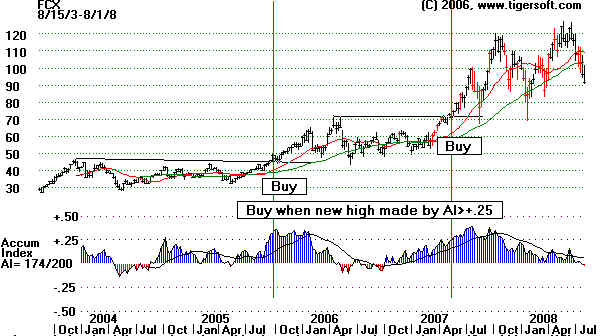 FCX - Use TigerSoft Closing Power To See What Professionals Expect of Stock Openings are very deceptive. Closings show the real balance of power between professional buyers and sellers. Breaks in the uptrend-line of Closing Power, especially when a Peerless Sell signal operates, should be used to sell.  FCX - Use TigerSoft's Day trader's Tool To See What Professional Day Traders Expect the Stock To Do. Buys - When the TigerSoft Day Traders' Tool breaks its downtrend, significant pressure comes off the stock and it is apt to rise. See February 2008 below. Sells - Having failed to make a new high in June, the break-down by the TigerSoft Day Trader's Tool below its uptrend line was distinctly bearish, especially in the context of Peerless showing a major Sell on the general market. 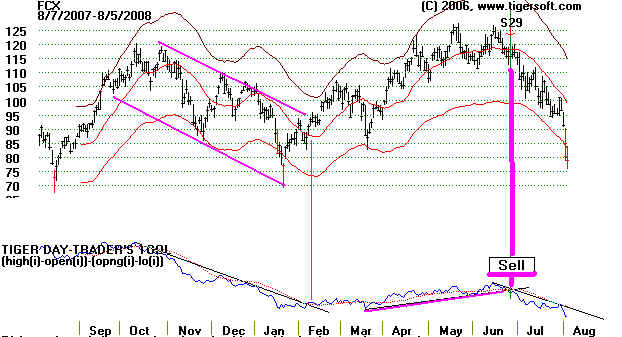 |
| PAAS - Pan American Silver - See if you can apply these concepts to this stock's TigerSoft charts. Do you see the bearish head and shoulders top patterns? Do you see the falling Closing Power trend? The Opening Power's rise showed the public was bullish at the wrong time. Day Traders have been preponderantly bearish PAAS since November 2007.. 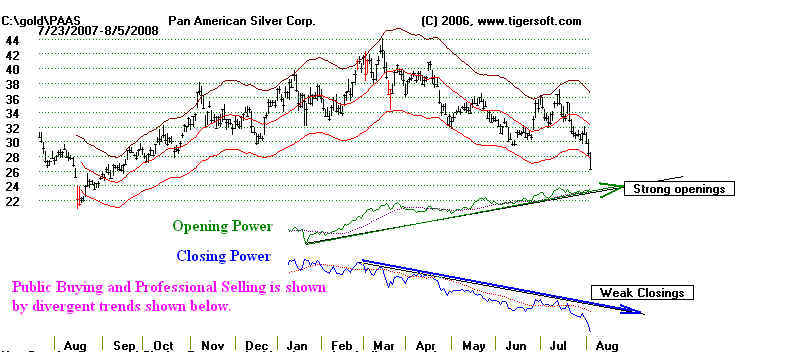 The head and shoulders price pattern with heavy red distribution on its right side points to the same bearish conclusion. 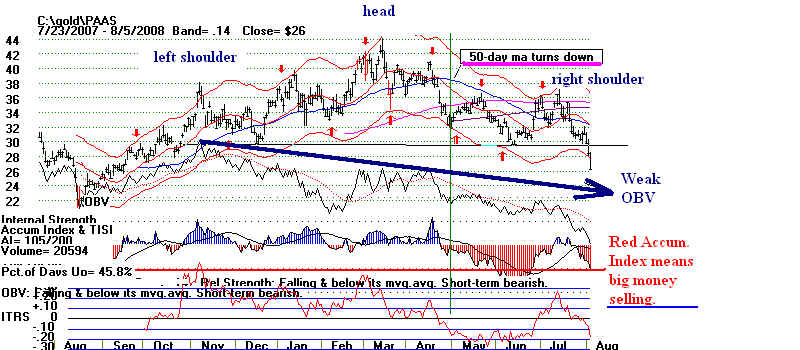 PAAS - TigerSoft Day Traders' Tool has been falling since November. Break-downs by it to new lows could have been used for profitable short-sales.. 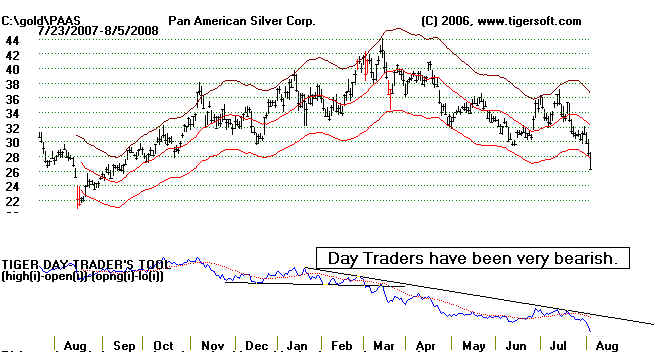 SSRI - Silver Standards - See if you can apply these concepts to this stock's TigerSoft charts. Do you see the bearish head and shoulders top patterns? Do you see the falling Closing Power trend? The Opening Power's rise showed the public was bullish at the wrong time. Day Traders have been preponderantly bearish SSRI for many months. TigerSoft's automatic red Buys and Sells work best when the direction of the signal is supported by the internal strength readings. The February and May red Sells worked well for short sellers because the Accumulation Index readings were (red) negative as the upper band was reached. 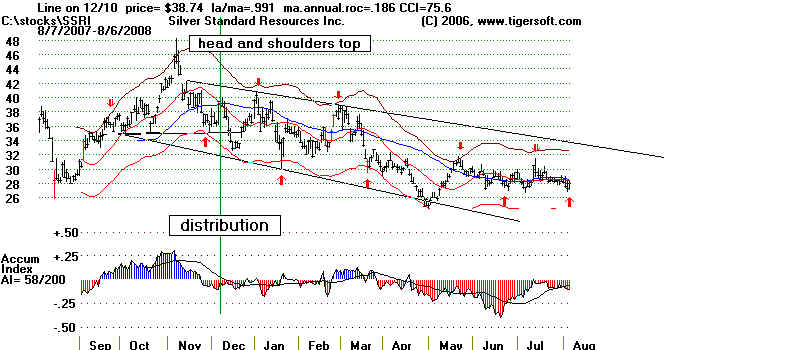 TigerSoft's Closing Power's Trend Usually Sets Direction for Stock 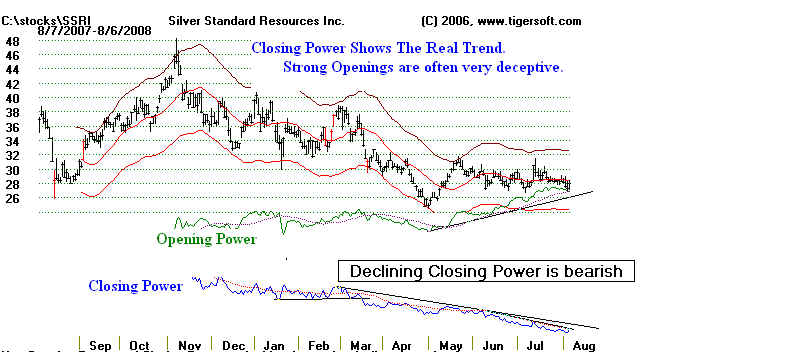 Professional Day Traders Are Usually Right. 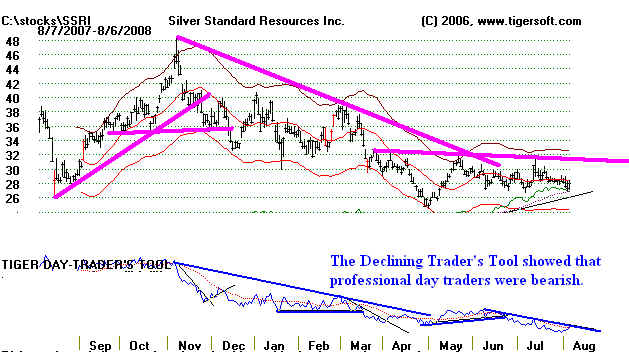 |
|
|