TigerSoft
News Service 10/31//2008 www.tigersoft.com
TigerSoft
News Service 10/31//2008 www.tigersoft.com Measuring Public versus Professional Buying.
The Six Stages in A Market Cycle.
Predicting The QQQQ Using TigerSoft's
Opening Power, Closing Power and Tiger's
Day Traders' Tool: 1999-2008.
by William Schmidt, Ph.D. - Creator of TigerSoft
 |
Tiger
Software
Research on Individual Stocks upon Request: Composite Seasonality Graph
|
I believe we can learn a lot from history. Here are
the TigerSoft charts of the QQQQ
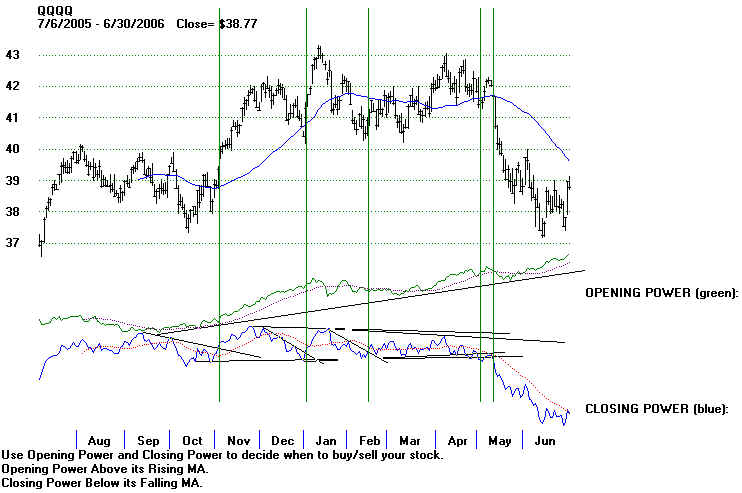
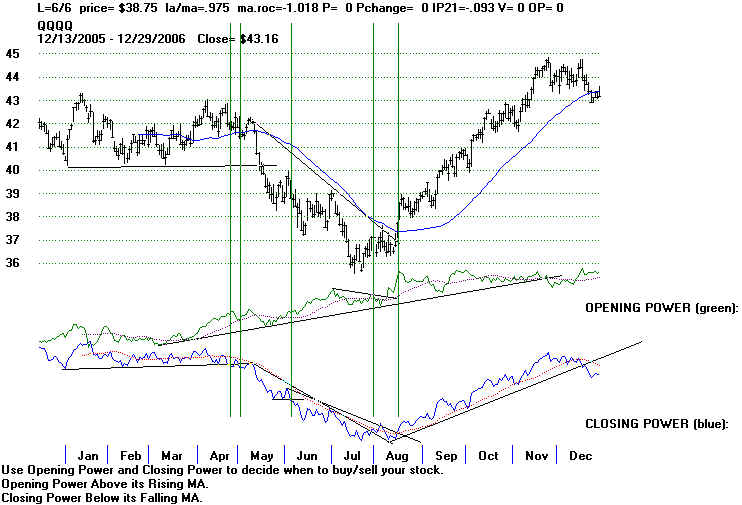
since 1999. The
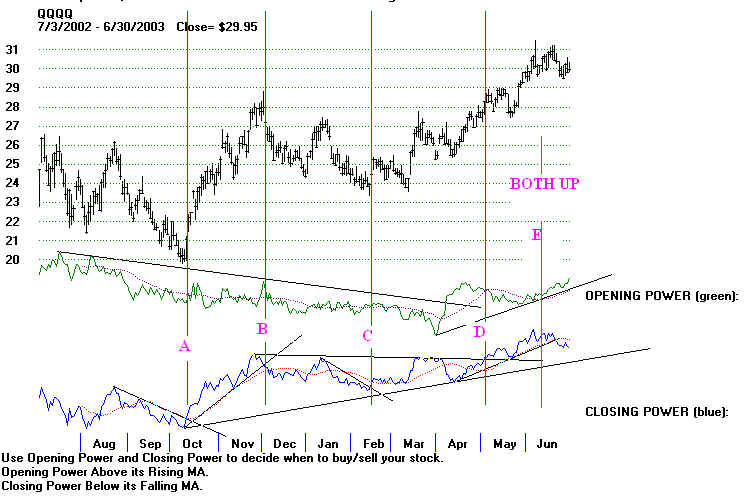
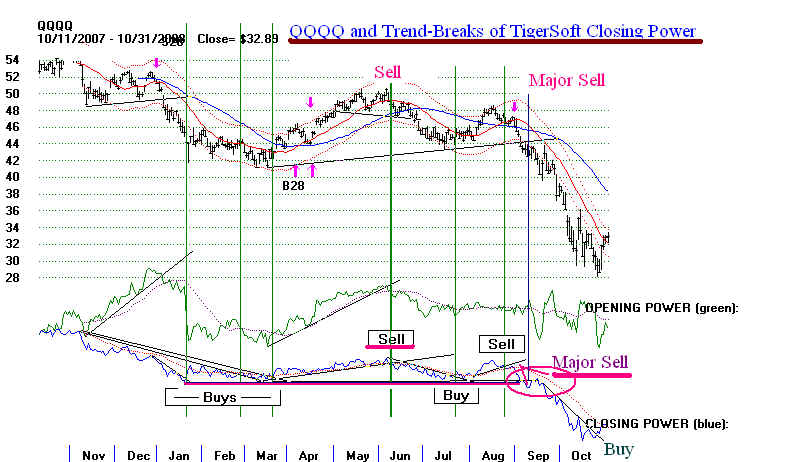
focus is on TigerSoft's Closing Power. Opening Power is more apt to reflect US public
and over-night Asian buying or
selling. This is very often proven wrong. Closing
Power reflects
professional buying or selling
sentiment. It is much more often proven correct. Opening Power
and Closing Power often move in
different directions. The basic idea is that the public tends to
react emotionally to news that may
already be priced into the market. It may be reacting
simply to the fear and greed that
extreme price changes create. It (the public) tends to buy/sell
at the opening or soon afterwards,
having made a decision overnight or early in the day, while
professionals buy/sell more
carefully, later in the day, especially as they accumulate or lay-off
their larger positions and have the
advantage of watching the market all day long. These are
tendencies, not idon-clad rules;
not only may professionals decide to buy at the opening
when they see that as advantageous,
but non-professionals may finally awake to higher "false"
openings and put in
"limit", rather than pre-opening "market", orders.
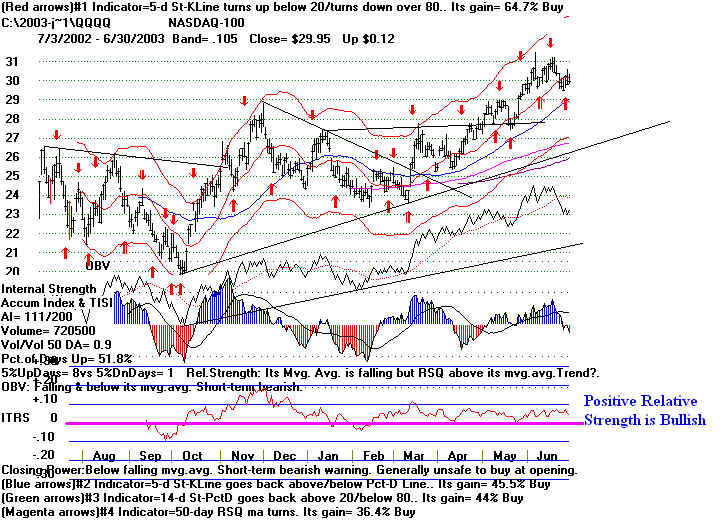
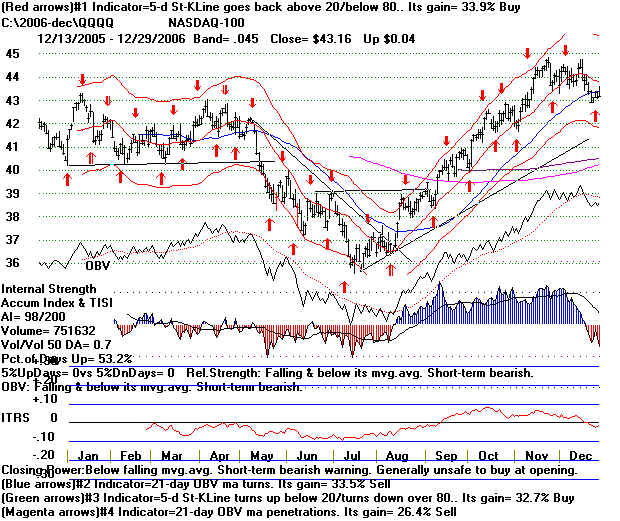
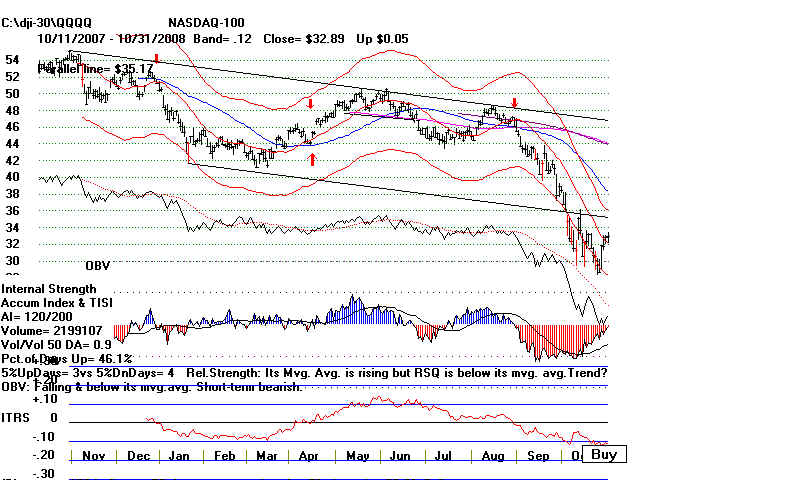
TigerSoft's Accumulation Index
measures a related concept: insider buying or selling.
We want to use all our tools
together. Intense accumulation (readings above +.50) adds bullishness
to a pattern of professional
buying and public selling. Intense distribution (readings below -.25)
adds bearishness to the
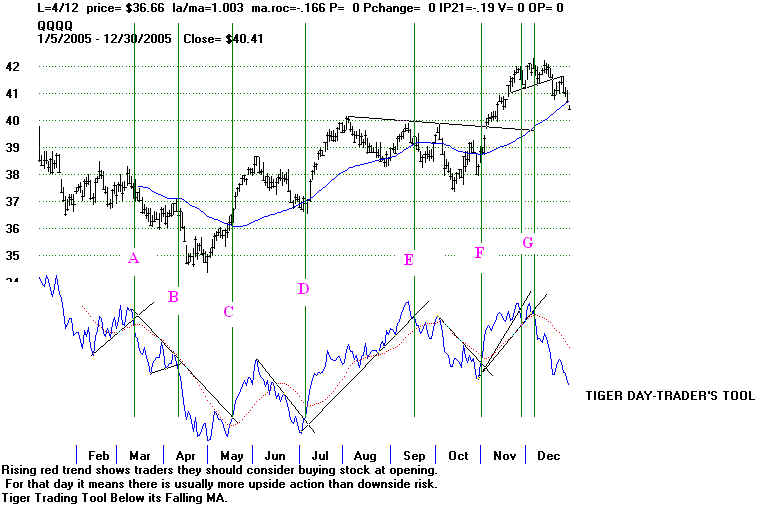
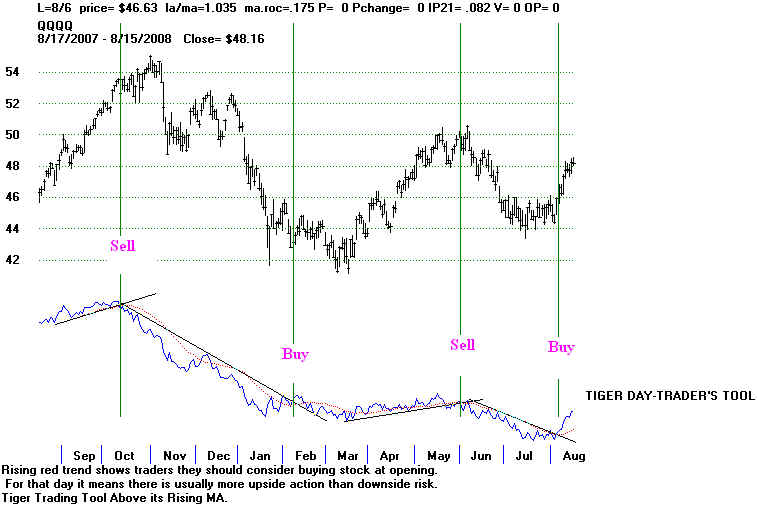
pattern of professional selling and public buying. Similarly, a rising
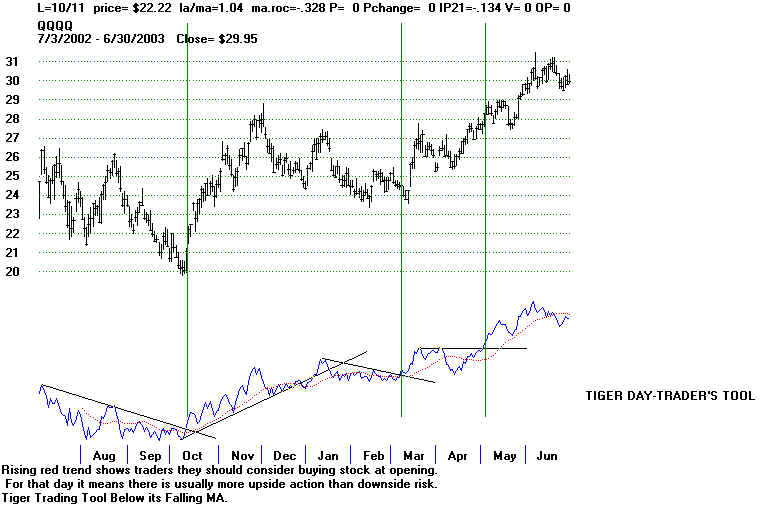
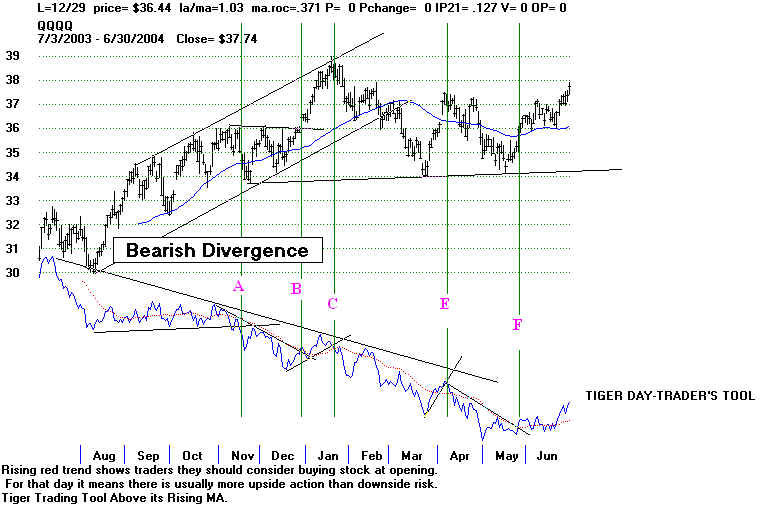
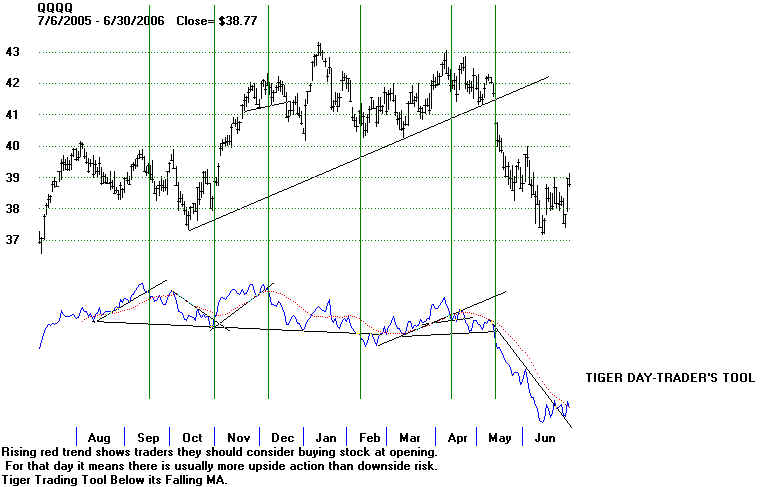
TigerSoft Day Traders' Tool
adds bullishness to a chart, while its declining trend should suggest
additional bearishness.
Six Stages in A Complete Cycle.
I theorize there are 6 different stages in a stock's or
commodity's rise and fall in a typical price cycle.
As Elliot Wave theorists have
noted, there are cycles within cycles. So a trader may see all 6 stages in
a relatively short period of time,
from days to 3 months. A longer term investor will see these stages play
out very often over an entire year.
Here I want to emphasize intermediate-term trends..
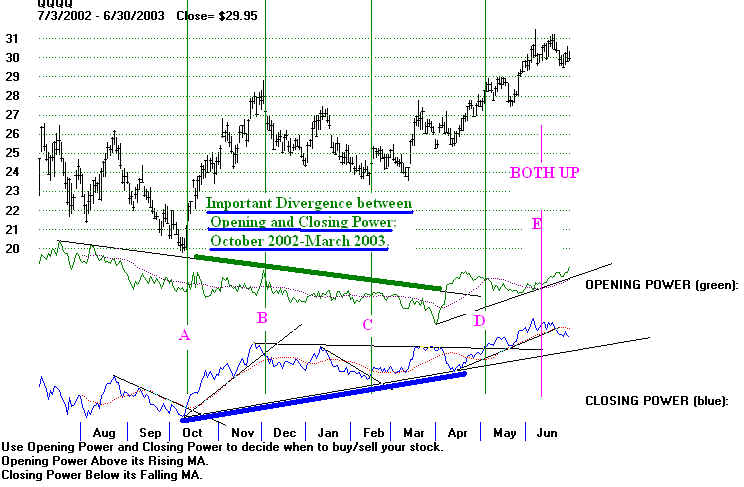
Stage 1 - Professional Accumulation and Public Selling. This is a bullish
divergence. It suggests a bear barket
bottom is being formed. Prices are
beginning to rise from an important bottom. The financial news is bleak,
but this
is the best time to take longer-term positions. Example: Look below at the second
half of 2002 and the first few months of 2003 in the QQQQ
shown below.
Opening Power was declining and Closing Power was rising. This is
a "bullish divergence".
The public is bearish and professionals are
much more bullish.
--------------------- QQQQ 2002-2003 -----------------
Stage 2 - Prices Advance as
Professionals buy aggressively..
The
public turns from bearish to more neutral on balance.
Opening Power does not rise as steeply as Closing Power.
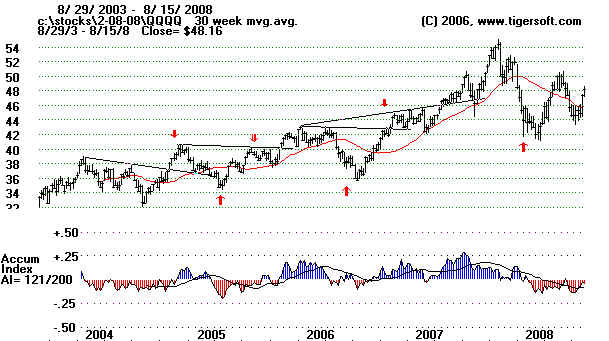
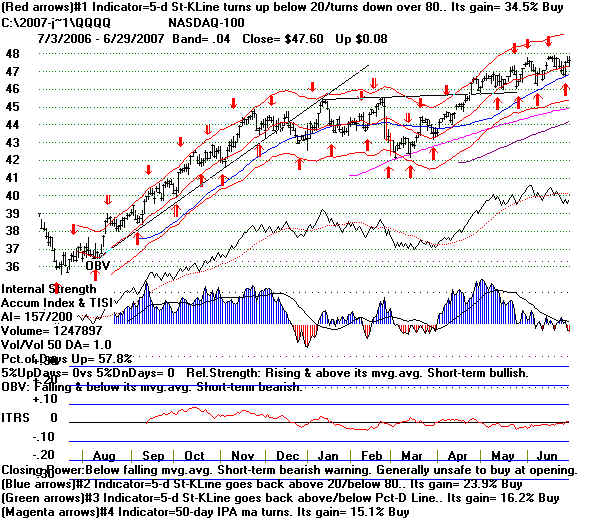
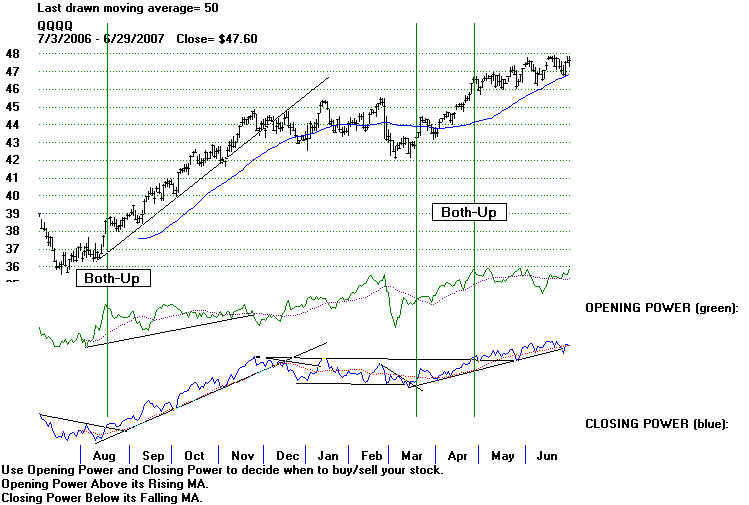
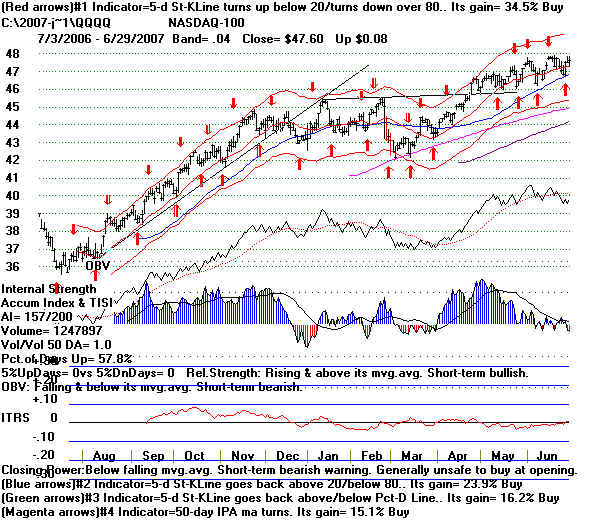
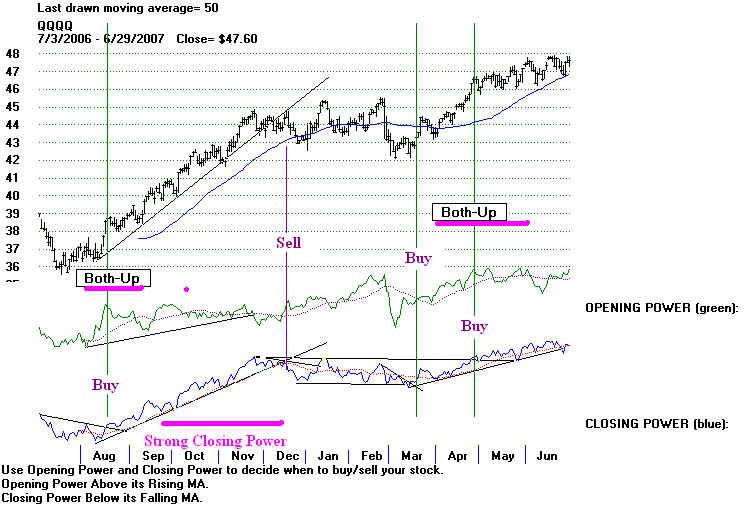
Example: April to July in 2003, just below. This was a time
when aggressive buying was amply rewarded. (See also
QQQQ, August to December 2006 in charts below.)
----------- QQQQ 2003 ------------
 .
.
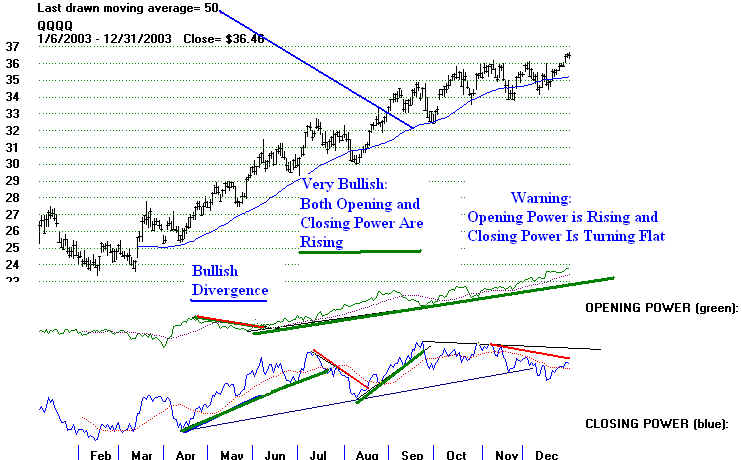
Stage 3 - Prices rise very
quickly as Both Public and Professionals
Are Buying Aggressively. Closing Power
is still rising. though it
may start to turn flat after an extended advance. Opening power is
rising steeply. Shorts are being run in. Prices open higher day
after day and close strongly. This is the most exciting phase in a
bull market. This is the stage when prices rises most steeply.
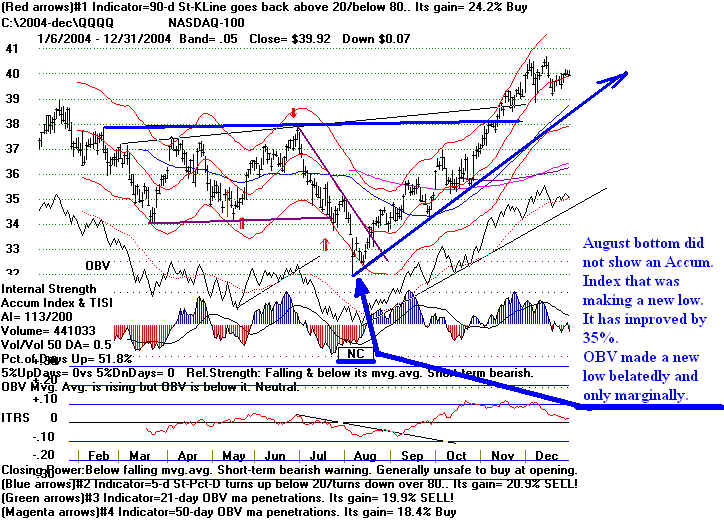
Examples: In chart above, see
the QQQQ: July 2003-November 2003
and below October 2004-December 2004..
------------------- QQQQ 2004-2005 -------------------
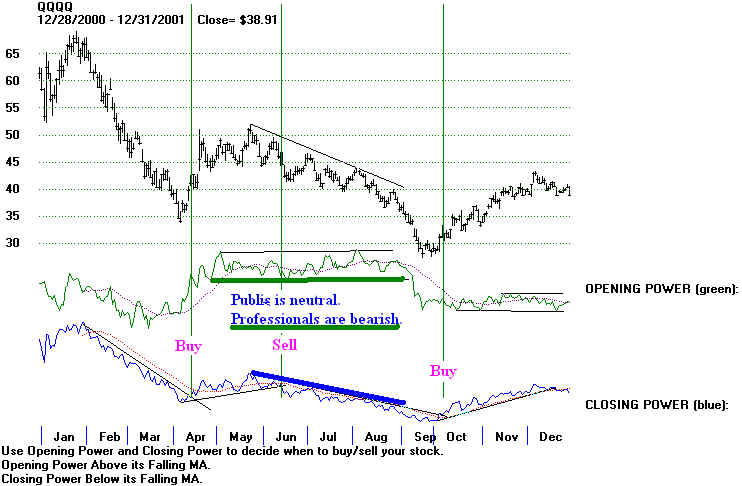
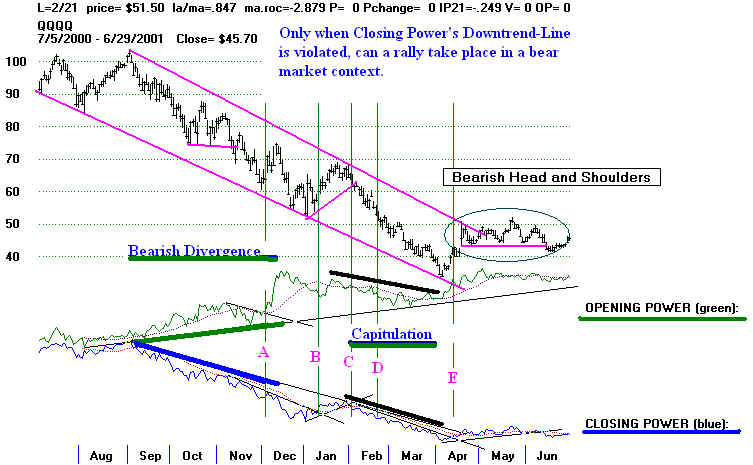
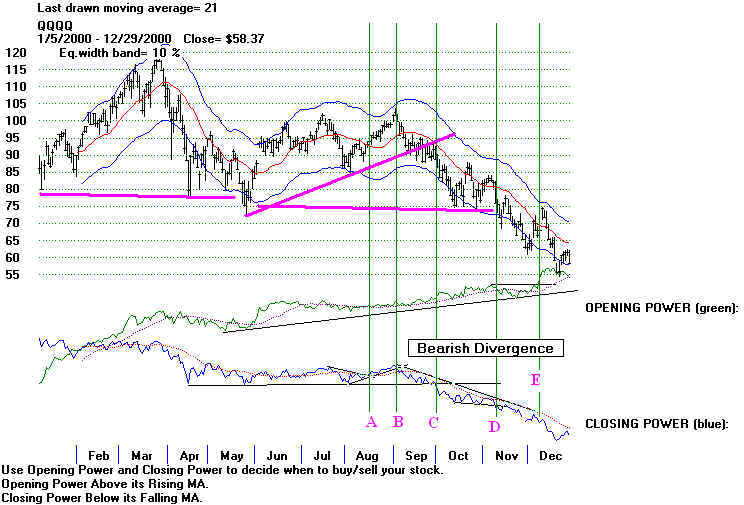
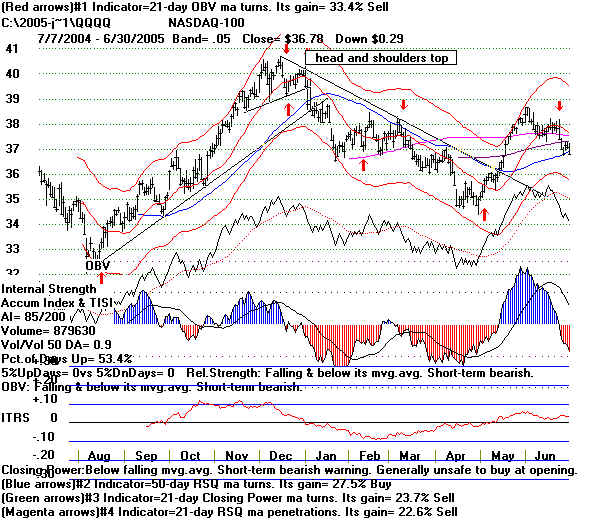
Stage 4 - Professionals Distribute to Public.
Prices reach a peak and
Then come under pressure despite public's buying aggressively at the
opening. Professionals are in control. The price decline can be quite
steep. It is usually orderly. Opening Power is still rising,
showing that the Public
thinks all dips are buying opportunities. The earlier advance and good news
have made them bullish even as prices decline. Meanwhile professionals are
selling (distributing) and Closing Power is falling. A "bearish divergence" is
said to exist: the public is buying while professionals are selling. You can see
this bearish divergence in the period January 2005 - April 2005 in the chart
above. Another
example: QQQQ: September 2000-December 2000.
(below)
------------------ QQQQ 2000-2001 ---------------
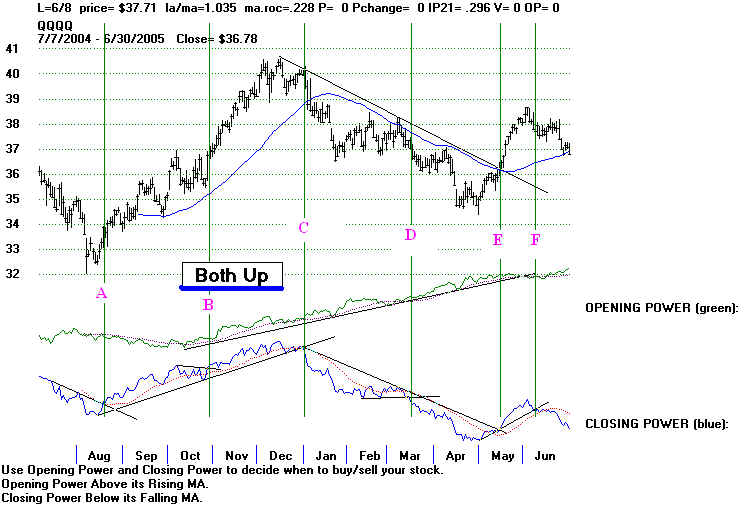
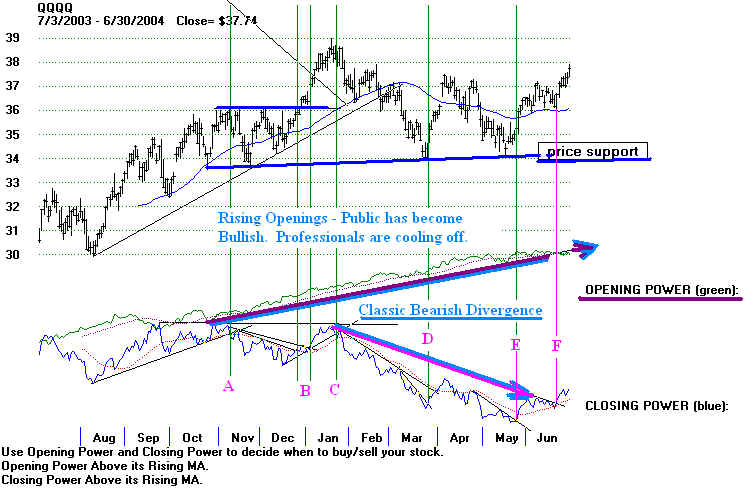
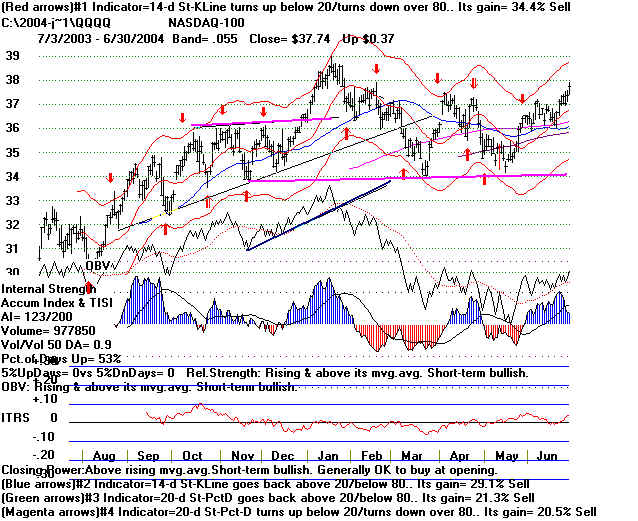
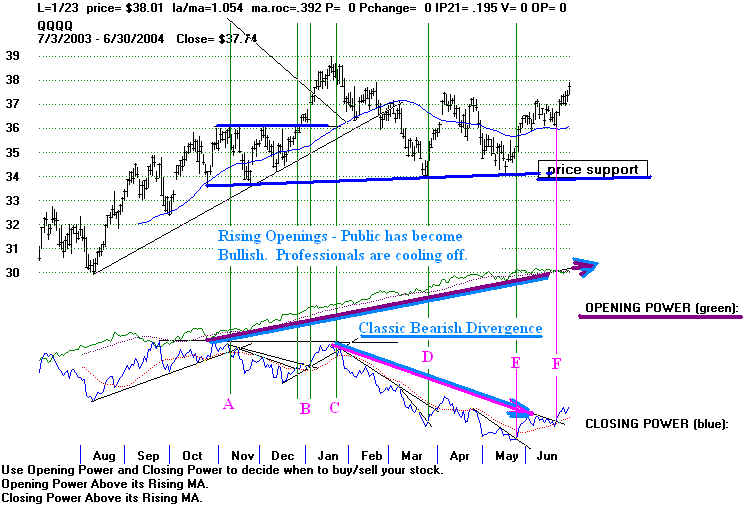
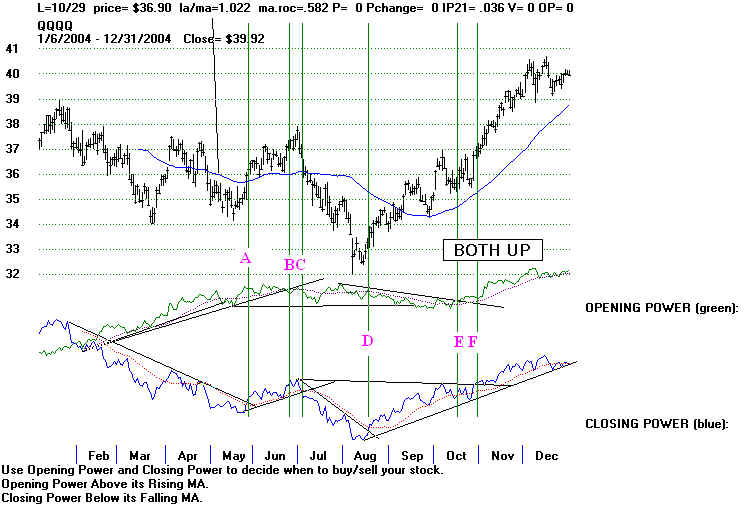
More examples: In chart below, you will see the QQQQ: January 2004-June 2004.
Note that a stage 4 "bearish divergence" is not necessarily followed by Stage 5
Capitulation. As in 2004, the bearish divergence decline may produce only a six
month
or year-long "consolidation, tilted downward" which is eventually followed by Stages 1-4
again. This was the case with the QQQQ from January 2004 to May 2005. It was
also
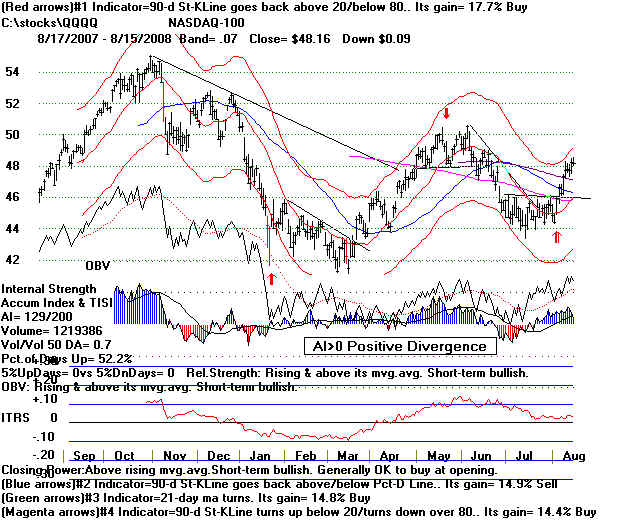
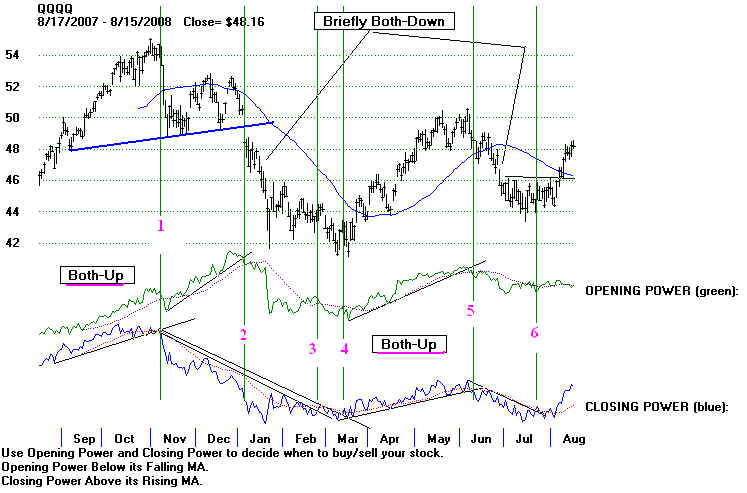
the case in the period November 2007-December 2007. Both are shown just below.
Generally, if the bearish divergence between Opening Power and Closing Power
lasts under three months, the resulting decline will either be relatively shallow or
relatively quickly over. To spot a reversal, we must watch Closing Power to see when
its downtrend ends and Professionals are ready to buy again.
------------------------------------ QQQQ 2003-2004
-------------------------------------------
------------------------------------ QQQQ 2007-2008
-------------------------------------------
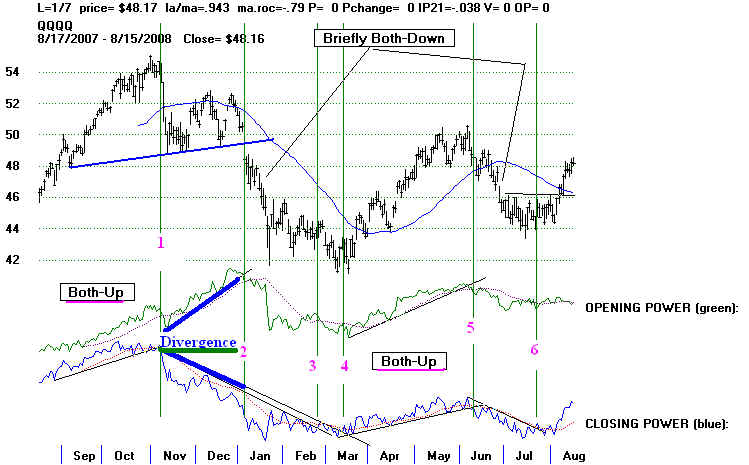
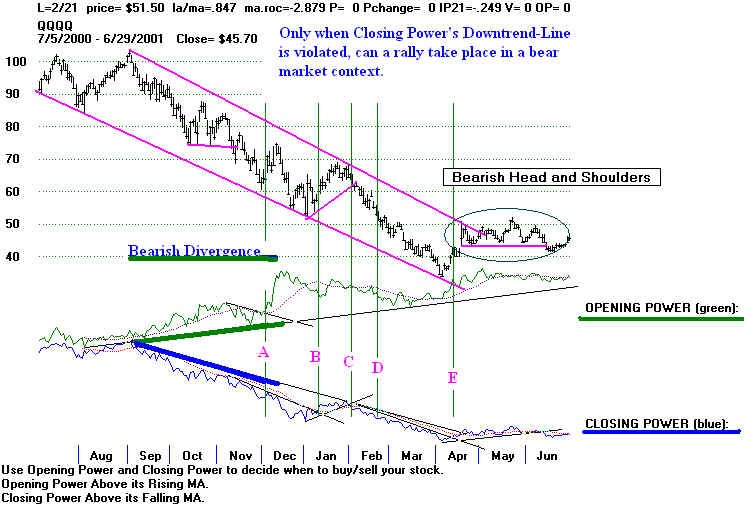
Stage 5 - Prices break down from a top. Professionals
Selling is steady and
the Public gradually has turned from Bullish to Neutral. Opening Power breaks its
uptrend
and turns flat, while Closing Power's decline worsens. This normally leads to a
Stage 6 capitulation phase. Example: QQQQ: April 2001-August 2001.
------------------- QQQQ 2001 -------------------
Stage 6 - Prices fall very
quickly. Professionals Selling (Closing Power is declining)
is matched by Public Selling (Opening Power is declining.)
This is the capitulation or
panic stage. The condition of "Both-Down" is exists. Example:
See QQQQ:
February 2001-March 2001 below. At the very least, a relief counter-trend recovery
follows.
------------------- QQQQ 2000-2001 -------------------
When you look at the charts below keep in mind the the longer term cycle that played out.
==================================================================================
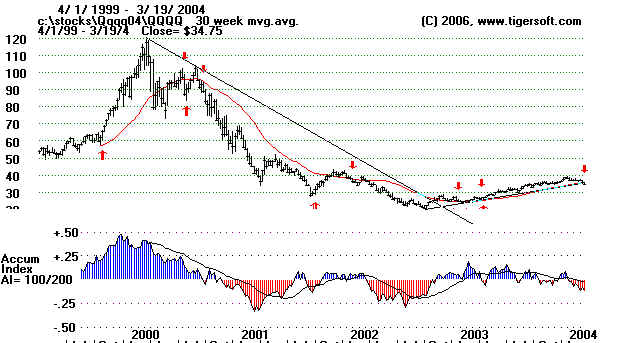
Background on The QQQQ
The QQQQ (Nasdaq-100) peaked in March 2000 at 120. By September 2001, it had
fallen to 28.
The attack of 9/11 brought on a
selling climax. Within this 18 months, there was a temporary bottom
at 75 in May 2000. (This
first leg down was the breaking of the internet bubble.) The next leg down
to prices down 50% from 75 to a
bottom at 38 in March 2001. The third leg down took the QQQQ
to 28 in September 2001.
After a counter-trend rally lasting 3 months, the QQQQ fell steadily to
a bottom at 20 in October 2002.
All through the long bear market, the public was generally buying
the Openings until May 2002.
Only as the QQQQ was nearing its bottom did Opening Power start to
fall. Professionals, judging
from the mostly falling Closing Power, remained bearish until October. At that
point they recognized the bottom
much more quickly than the public.
--------------------- QQQQ since 2004 ---------------------------------------------
This is a
simplification of reality, of course. But sensing where a stock, commodity or index
is in the cycle
will help you understand what is
happening and how and why the market reacts differently at various times
to the same news.
This theory will become another book eventually. The concepts are
needed now, so
I am publishing them in a limited
way now, to Tiger Elite Subscribers.
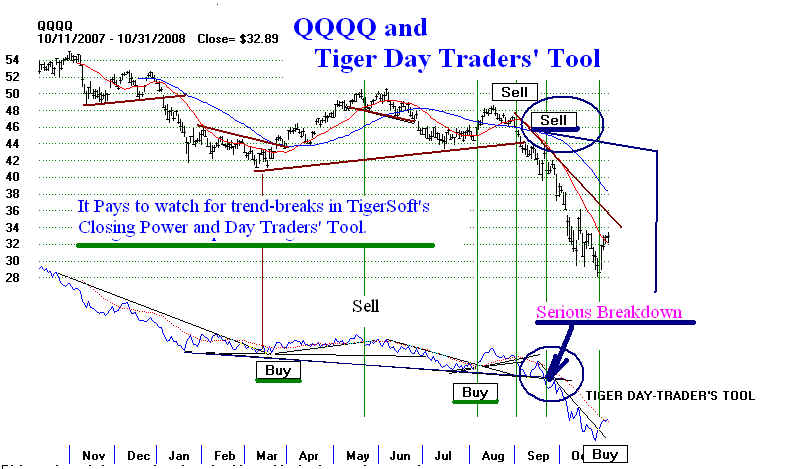
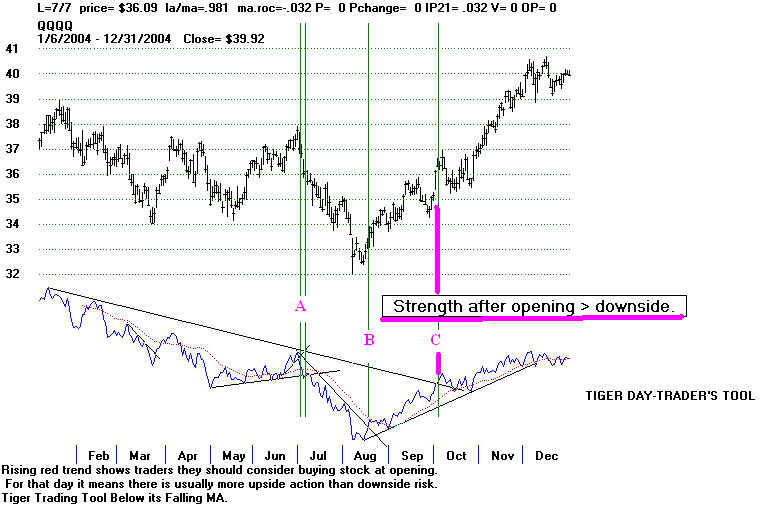
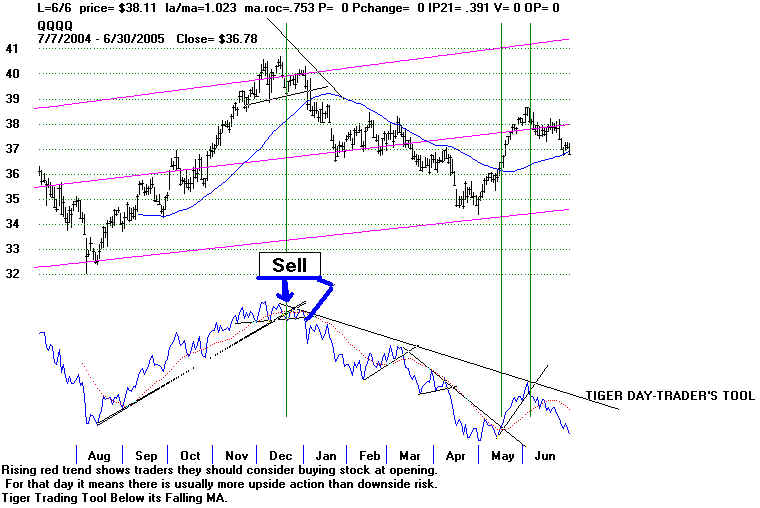
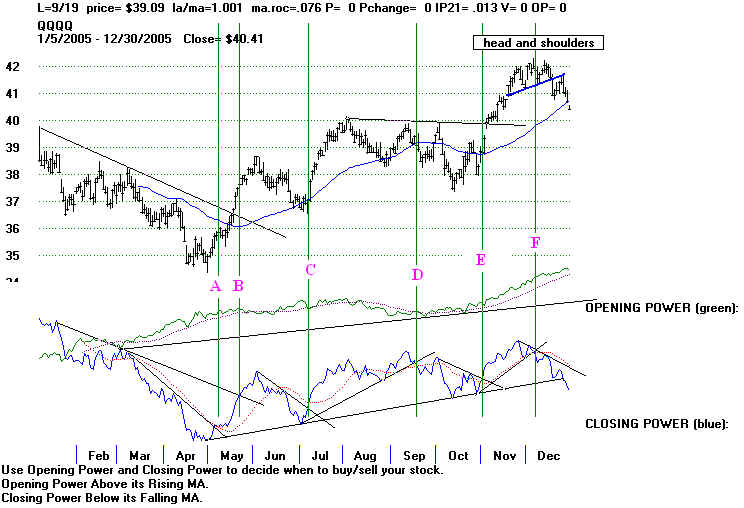
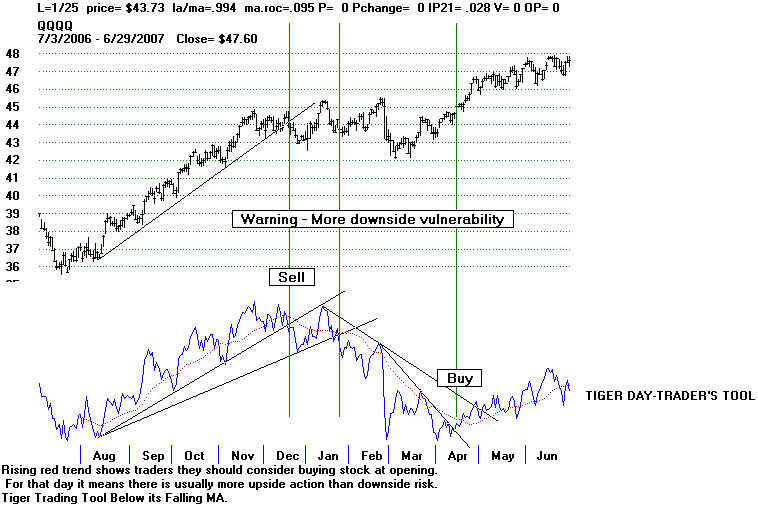
Trading Tactics Applied to The QQQQ
Chronlogically.
Consider these trading tactics:
Closing
Power Trend-Breaks Upwards is Bullish
Downwards is Bearish.
Closing Power Breakouts above earlier peaks that are nearly flat
is Bullish.
Closing Power Breakdowns
below earlier peaks that are nearly flat is Bearish.
When Closing Power has been declining for some time,
it is very bearish when Opening Power breaks down.
When
Closing Power has been rising for some time, it is very bullish when Opening Power breaks
out.
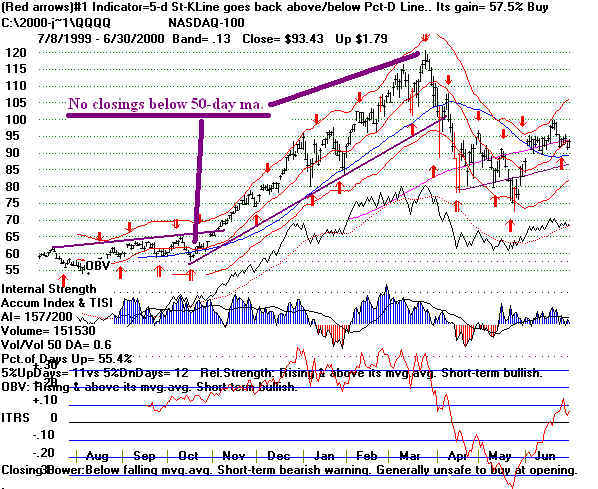
QQQQ 1999
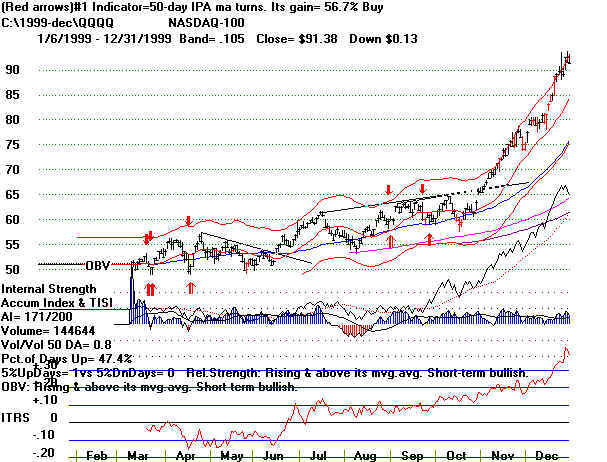
QQQQ 1999-2000 (1)
50% advance...
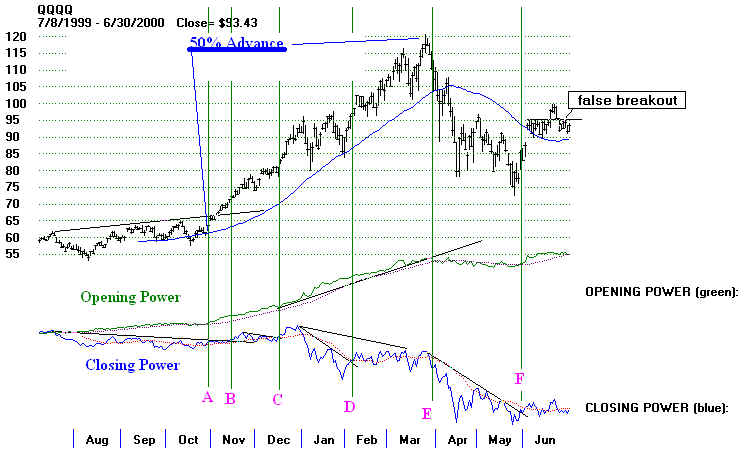
QQQQ 1999-2000 (2)
(A) Both Opening and Closing Power are rising. Can be very bullish.
(B) Closing Power
breaks out over its flat resistance. Opening Power rising. Bullish.
(C) Closing Power
breaks out over its flat resistance. Opening Power rising. Bullish.
(D) Closing Power
breaks out over its declining resistance. Opening Power rising. Bullish.
(E) After 10 week period when
Closing Power was declining and Opening Power was
falling, it is bearish when the Opening Power breaks its uptrendline.
(F) Closing Power surpasses
its downtrendline while Opening Power is flat to rising.
Bullish.
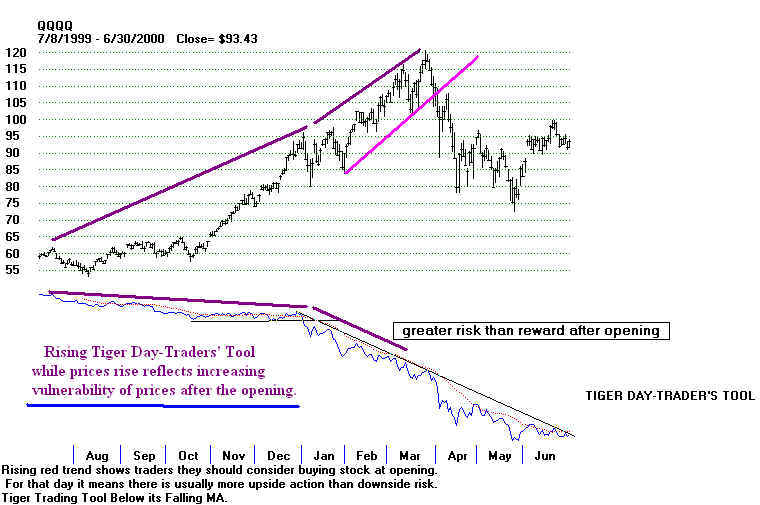
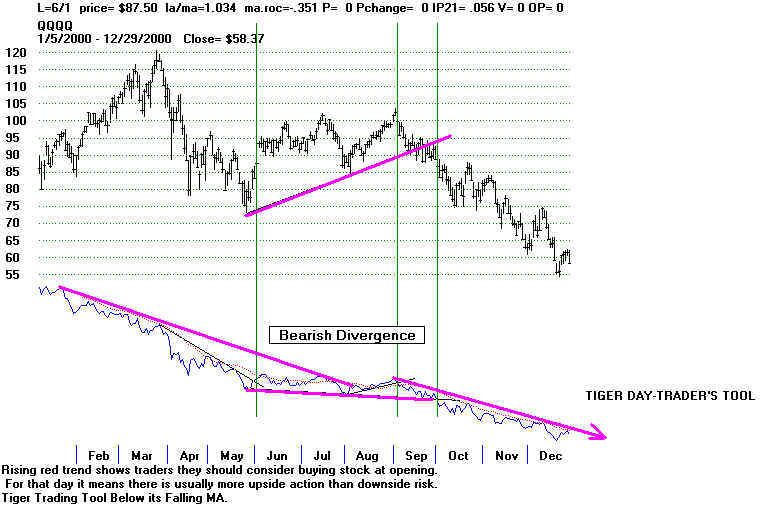
QQQQ 1999-2000 (3)
Prices Doubled from July 1999 to March
2000,
while Tiger Day-Traders' Tool was falling. This was
an early warning of the coming bear market. When
prices top out, they must come down a long ways.
QQQQ 2000 (1)
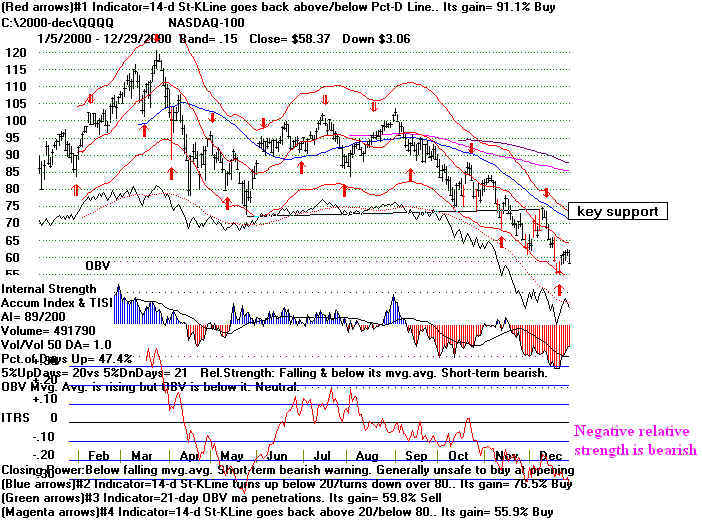
QQQQ
2000 (2)
Note how
in April 2000, both Opening and Closing Power are falling.
This is quite bearish. This condition is called "BOTH-DOWN".
(A) Closing Power surpasses its
downtrendline while Opening Power is flat to rising.
Bullish.
(B) Closing Power
breaks its uptrend. Opening Power is flat. Bearsh.
(C) Closing Power
breaks down below its flat support. Thought Opening Power
is rising, Closing Power proved correct. Bearish. Consider bearish context.
(D) Closing Power
breaks down. So does Opening Power. Bearish.
(E) After 10 week period when
Closing Power was declining and Opening Power was
falling, it is bearish when the Opening Power breaks its uptrendline.
(F) Opening Power upside
breakout in context of declining Closing Power is
misleading. Bearishly Closing Power rules.
QQQQ 2000 (3)
| QQQQ 2000--2001 (1)  QQQQ 2000--2001 (2) 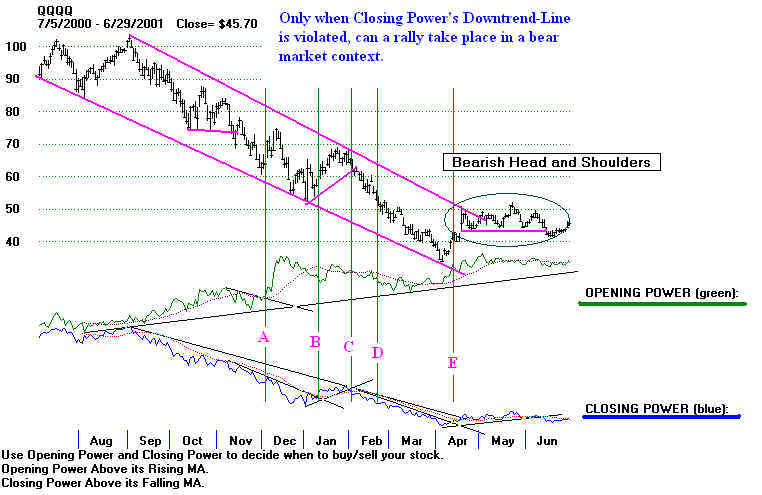 QQQQ 2000--2001 (3) 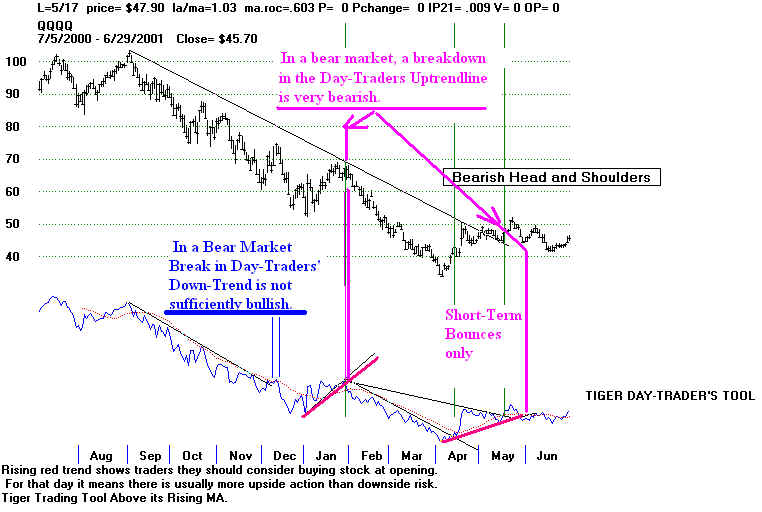
QQQQ 2001--2002 (1) 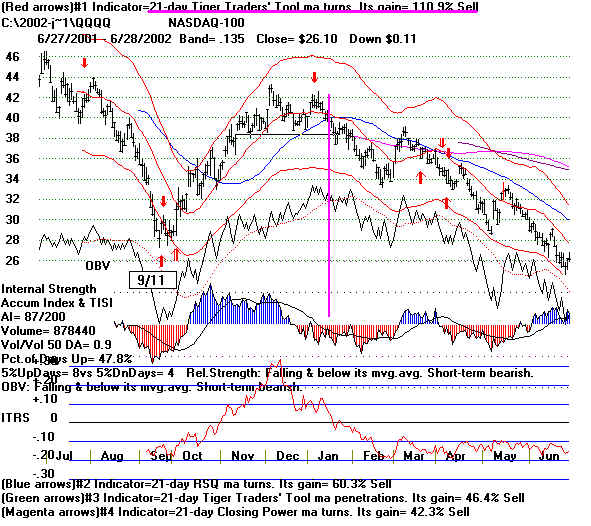 QQQQ 2001--2002 (2) 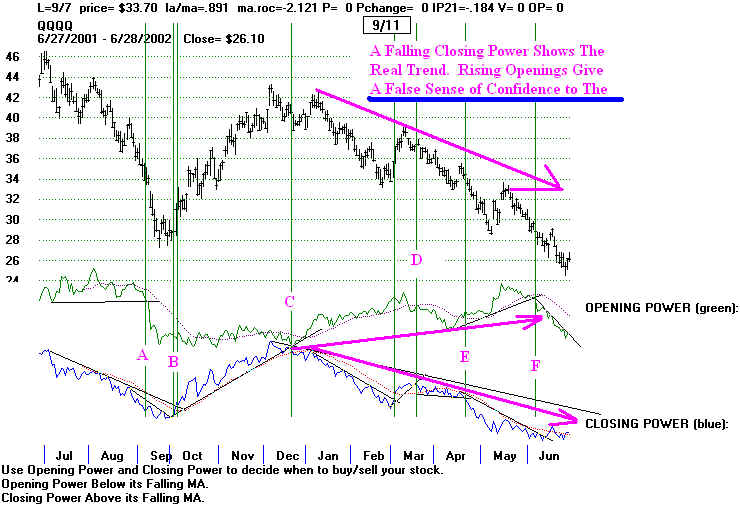 QQQQ 2001--2002 (3) 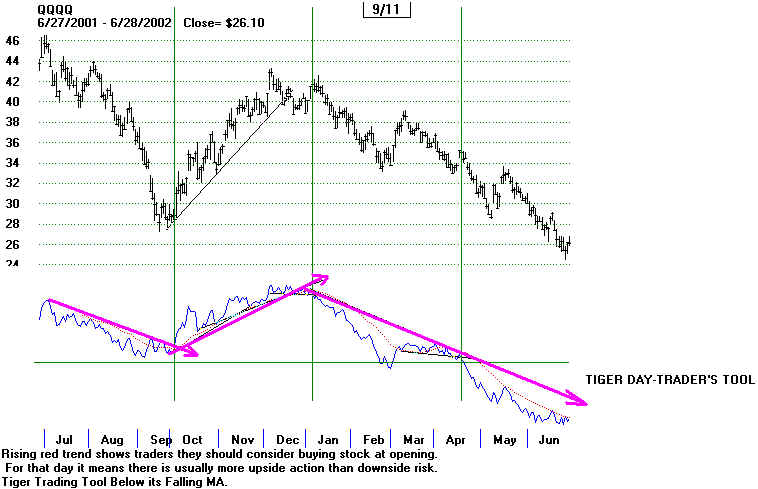 |
| QQQQ 2002 (1) 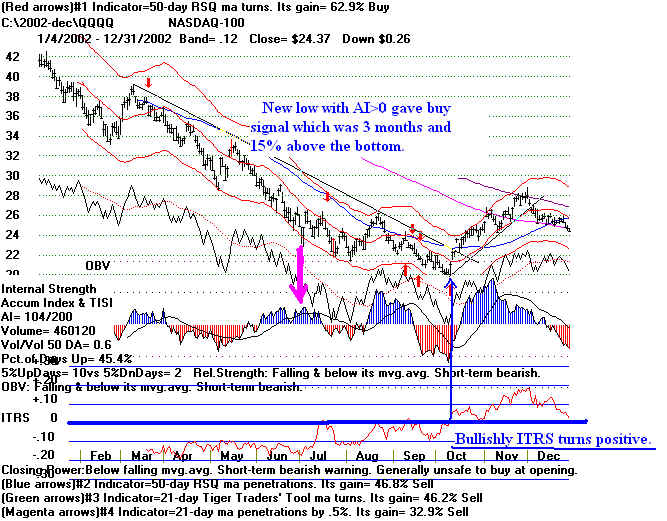 QQQQ 2002 (2) 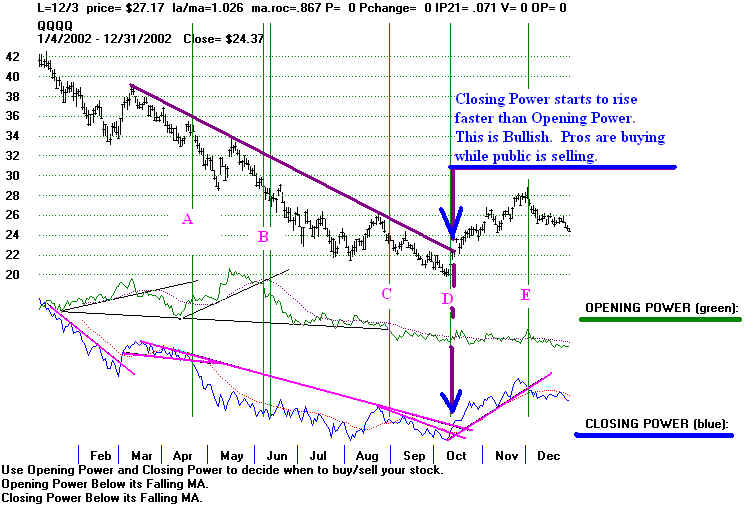 QQQQ 2002 (3) 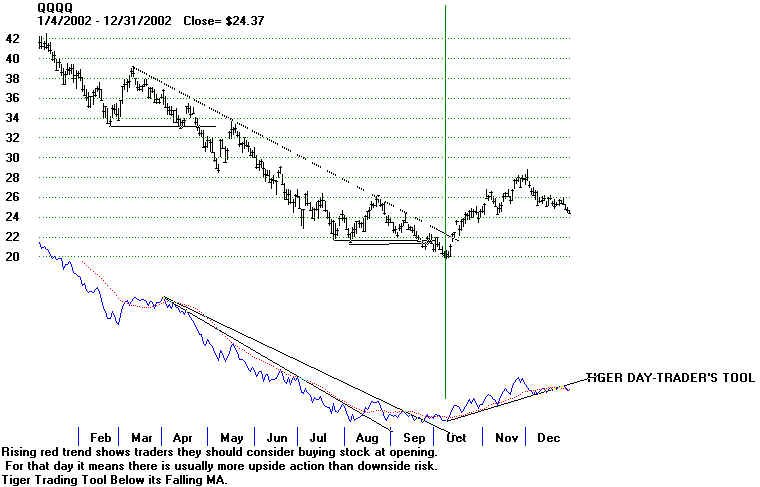 |
|
QQQQ 2002-2003 (1) 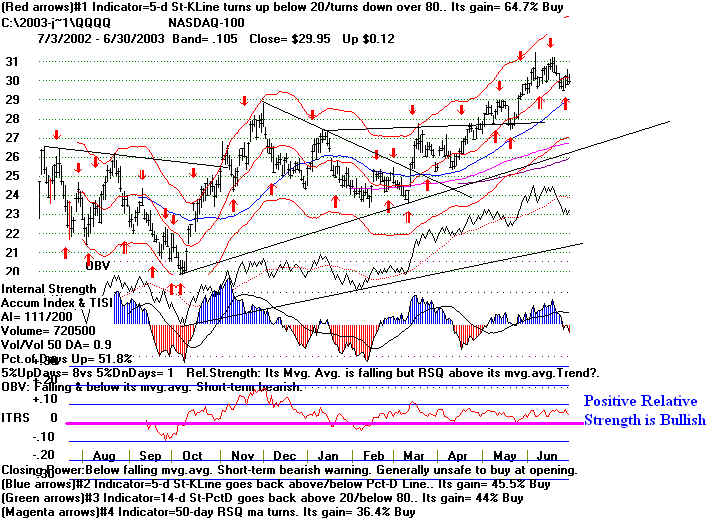 QQQQ 2002-2003 (2)  QQQQ 2002-2003 (3) 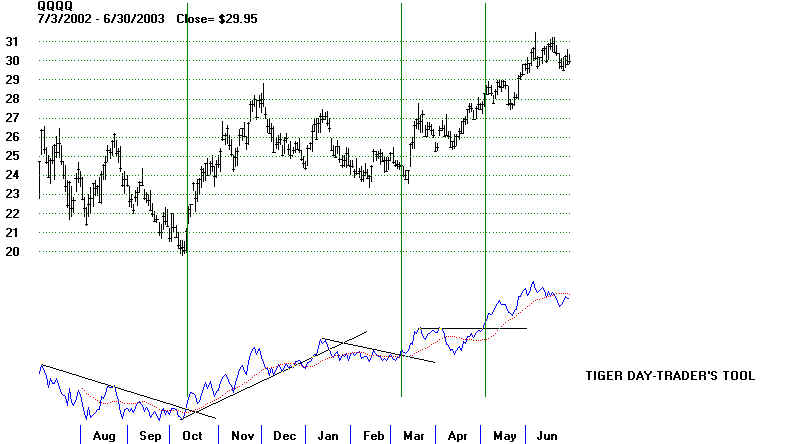 |
QQQQ 2003 (2)
QQQQ 2003 (3)
QQQQ
2003-2004 (1)
QQQQ 2003-2004 (2)
QQQQ 2003-2004 (3)
QQQQ 2004 (1)
QQQQ 2004 (2)
QQQQ 2004 (3)
QQQQ 2004-2005 (1)
QQQQ 2004-2005 (2)
QQQQ 2004-2005 (3)
QQQQ 2005 (1)
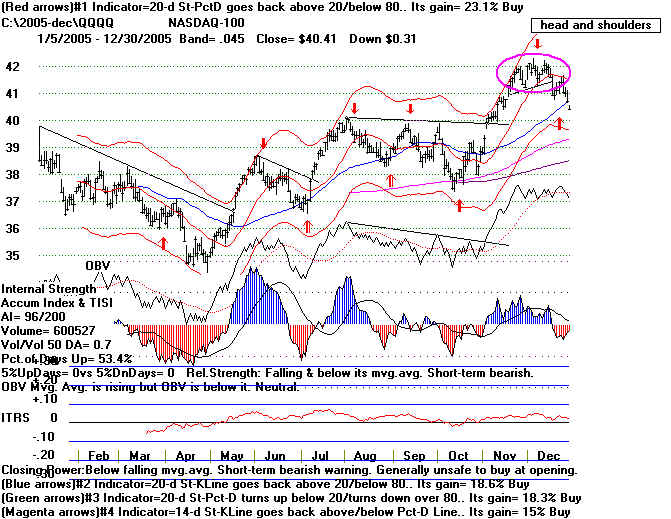
QQQQ 2005 (2)
QQQQ 2005 (3)
QQQQ 2005 -2006 (1)
QQQQ 2005 -2006 (2)
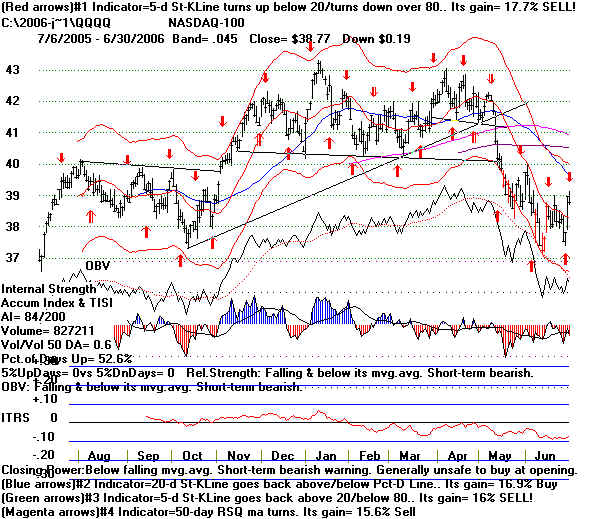
See the mildly bearish divergence from November 2005 to April 2006.
QQQQ 2005 -2006 (3)
QQQQ 2006 (1)
QQQQ 2006 (2) Bearish Divergence is seem from April 2006 to
Augusat 2006.
QQQQ 2006 (3)
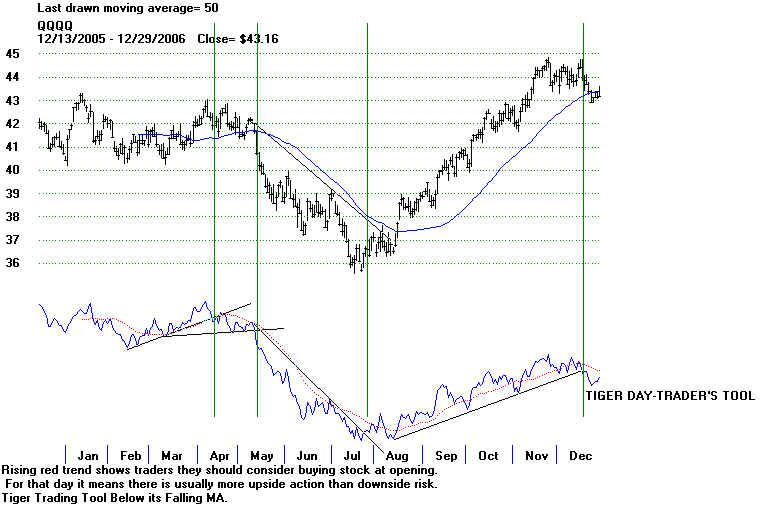
QQQQ 2006-2007 (1)
QQQQ 2006-2007 (2)
QQQQ 2006-2007 (3)
QQQQ 2007 (1)
QQQQ
2007 (2)
QQQQ 2007 (3)

QQQQ 2007 -2008(1)
QQQQ 2007 -2008(2)
QQQQ 2007 -2008(3)
QQQQ - 2008
QQQQ 2008 (1)
QQQQ 2008 (2)
QQQQ 2008 (3)