
TigerSoft News Service 8/27/2008 www.tigersoft.com
Baseball's Huge Home Field Advantage:
What Behind It?
Are Catchers' Signs Being Stolen? What's Up?
by William Schmidt, Ph.D. (Columbia University)
(C) 2008 All rights reserved. Reproducing any part of this page without
giving full acknowledgement is a copyright infringement.
Research on Individual Stocks upon
Request:
Composite Seasonality Graph of Any Stock for $125.
Example of historical research NEM
- Newmont Mining. Order Here.
 |
Tiger
Software Helping Investors since 1981 More Oil
Profits' Cartoons.
|
Baseball's Home Field Advantage:
What Behind It? Signs Being Stolen? What's Up?
by William Schmidt, Ph.D
Now, I like statistics. But it's baseball that got me to like numbers. When I
was
very little, my grandfather took me aside and explained what "numbers" were.
See, he
worked in a factory and "ran numbers" there. He would go around and
collect bets on
such things as the total number of runs in baseball for a given week, as well as take
straight-up
bets for a bookie who payed him a little on the side. He never got rich at it, for
sure. In fact,
he was always real poor. His vacation was going down to the train station and
counting the box cars
going by with me. He was thinking how he would like to hop up on one of them, I
think. Well, I
loved him. He taught me basic arithmetic long before I had it in school. And
getting this
head start in math has kept my interest in numbers all my life. So I grew up liking
them
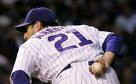
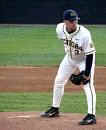
and baseball especially. And I still do. I was a catcher. So I study the
pitching part of the
game.
San Diego's hitting leaves a lot to be desired.
What I want to consider here is what's with the huge home-field advantage that now
exists in baseball. It been documented, of course, for some time, but look at how
different
the wins and losses are this year from home to away, for almost all teams, especially
those
near the top of their division. Below are the win-loss record to date in 2008 for
the teams
leading each division. Only the LA Angels, the team with second best record in
baseball
this year, is doing nearly as well away as at home. The differences are enormous.
Of all 30 major league teams, only 5 have won more away than they have lost. Even
the
best
teams have trouble winning much mor ethan 50% of their away games.
Win-Loss Record
At Home Away
American League
East
Tampa Bay
47-19
32-32
Boston
43-18
33-37
NY Yankees
38-28
32-33
Central
Chicago W.Sox
46-22
30-34
Minnesota
48-23
28-35
West
LA Angels
40-26
40-25
National League
East
Philadelphia
39-28
34-31
NY Mets
41-25
32-35
NY Yankees
38-28
32-33
Central
Chicago Cubs
49-19
33-31
Milwaukee
41-24
36-31
West
Arizona
37-28
31-36
LA Dodger
39-30
26-37
I found lengthy study on the Net that concluded the advantages covered
most aspects of baseball.
Home teams succeed at:
- Hitting more homeruns
- Striking out less
- Walking more
- Getting hits on balls in play
- Pitching complete game shutouts
- Allowing fewer runners to reach on error
- Stealing bases more successfully
- Getting hit by more pitches
- Hitting triples
- NOT especially at hitting doubles, but at hitting extra base hits on balls in play overall
- Picking off opponents’ runners
Statistics back to 1981 show that the biggest advantage is in the 1st and 9th
inning. Is that
from the crowd cheering, in part? This notion is supported because home teams have a
noteworthy advantage in close games and low-scoring games.
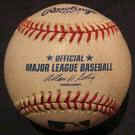
In baseball there is official rulebook that teaches boys how to play. And then there
is the
unofficial way in which baseball can be won by intimidation, stealing signs and the fans
getting to the umpires. Watch the pitcher, some of them clearly release the ball
3" or
4" in front of the rubber. They are never, never called on it!
The Wall Street Journal reported that the 1951 New York Giants scored their miracle
comeback from 13 and a half games behind the Brooklyn Dodgers in September
with an "elaborate sign-stealing scheme that involved telescopes in the scoreboard
and a system of bells and buzzers." (Source: http://findarticles.com/p/articles/mi_m0FCI/is_8_61/ai_88575166
)
I've always wondered with today's technology whether someone might steal the
visiting catchers' signs and post them in some secret way on the billboard in center
field,
or in another spot the hometeam batters could see. That would help them enormously.
Knowing that the next pitch is going to be curve would takes all the surprise away and let
batters dig in for a fast ball and flex up for a curve ball. Since the catcher also
signals
the location he wants for the pitch, the home-team batter could have quite an advantage
once the catcher's signs were understood.
The problem with this is that the pitcher and catcher could change the signs anytime
they want. That would cross-up hitters a lot.. It's probably easier to explain
home-town
advantage in other ways. "Tthe stealing theory surfaces with teams like
the Cubs more
often because of the scoreboard. the belief is that someone in the scoreboard appears
in 1 of 2+ openings depending on the pitch (1 for fastball, 2 for curve, add more
as necessary). the batter is supposed to know which opening means what." Source.
.
Explanation for Home Field Advantage
I can list a lot of possible explanations. And tell a few
stories. But there are a lot of unanswered questions.
1.
Familiarity and comfort for the batter working with a familiar backdrop
in the outfield. The
home-field batter see the ball better.
2. The height of the pitching rubber and how the pitchers' mound is
maintained must
vary from stadium to stadium. The hometown pitcher is more comfortable on the mound
he plays half his games on. Home team hitters are hit by more balls, for
example, for
this reason.
3. The outfield varies a lot from stadium to stadium and so does the
foul territory. The
home-field team has a big advantage knowing where the outfield fence is and how far they
can go to catch a foul ball.
4. Infields are better maintained in some stadiums than others.
And in all stadiums,
the field is in better shape to field infield grounders on in the top of the 1st inning.
5. The home-town players know how to play the lights in their stadium
better. Outfield
errors on fly-balls lost in the sun would give the home team an edge.
6. Crowd noise. Baseball etiquette has changed a lot since I was
a kid. Home-town fans
razz opposing team outfields quite personally now.
7. Traveling to play on the road is more tiring. Muscles are
tighter. It's certainly harder
to play with a hangover.
8. Climate differences are important. Places like Coors Field, 5000'
high, produce
longer fly balls. The Home team would know how to take advantage of this and
prevailing conditions. Colder locales require more time to warm up. Perhaps,
the
visitors don;t fully realize this. Houston's humidity and Arizona's heat is very
debilitating
unless one knows from experience how to prepare for and cope with it. From 1977
to 2008, the biggest home-field advantage was Colorado, Houston, Tampa Bay and
Florida.
Difference Between Home Winning Pct
and Away Winning Pct.
.
0.159 COL (meaning that Colorado winning percentage for home
ganes was 15.98% higher than its winning percentage
for away games).
0.114 HOU
0.113 TBD
0.11 FLA
0.105 TEX
.
Look at how different the dimmensions are from one ball park to
another.
( Source: http://www.andrewclem.com/Baseball/Dimensions.html
)
Stadium
Team(s)
Behind home plate
Outfield dimensions (feet)
Left field
Left center
Center field
Right center
Right field
Marked
Actual
Marked
Actual
Marked
Actual
Baker Bowl
Philadelphia Phillies
62?
342
382
408
300
281
Forbes Field
Pittsburgh Pirates
75
365
406
395
435
435 (?)
408
395
300
Shibe Park*
Philadelphia Athletics & Phillies
64
334
(405)
358
447
(400)
355
329
Sportsman's Park*
St. Louis Browns & Cardinals
67
351
379
420
354
335
310
League Park
Cleveland Indians
60
375
415
420 (?)
410
340
314
290
Comiskey Park
Chicago White Sox
86
352
382
415
382
352
Polo Grounds
New York Giants
65
(279)
447
483
440
(258)
Griffith Stadium
Washington Senators
61
405
391
421
(373)
390
320
Crosley Field
Cincinnati Reds
78
328
378
387
360
366
Tiger Stadium*
Detroit Tigers
66
340
365
360
440
370
360
325
Fenway Park
Boston Red Sox
54
310
(379)
335
390
380
302
Ebbets Field
Brooklyn Dodgers
71
348
351
(393)
384
(344)
352
297
Wrigley Field
Chicago Cubs
55
355
368
350
(400)
394
368
353
Braves Field
Boston Braves
60
337
355
390
355
318
Yankee Stadium
New York Yankees
75
318
(399)
388
408
(385)
372
314
Cleveland Municipal
Stadium
Cleveland Indians
60
320
380
410
380
320
Milwaukee County
Stadium
Milwaukee Braves & Brewers
60
315
377
402
377
315
Memorial Stadium
Baltimore Orioles
58
309
376
405
376
309
Municipal
Stadium
Kansas City Athletics & Royals
60
369
409
421
382
338
Memorial Coliseum
Los Angeles Dodgers
66
251
320
420
380
300
Seals Stadium
San Franciso Giants
55
365
375
410
360
335
Candlestick Park
San Franciso Giants
66
335
(365)
355
400
(365)
355
328
Wrigley Field (L.A.)
Los Angeles Angels
56
340
345
412
345
339
Metropolitan
Stadium
Minnesota Twins
60
343
(360)
373
425
373
330
Dodger Stadium
Los Angeles Dodgers
53
330
(375)
368
395
400
(375)
368
330
Colt Stadium
Houston Colt 45s
60
360
395
390
420
395
390
360
Robert F. Kennedy
Stadium*
Washington Senators & Nationals
55
335
(380)
388
410
(380)
388
335
Shea Stadium
New York Mets
58
338
371
410
371
338
Astrodome
Houston Astros
67
325
375
400
375
325
Anaheim Stadium
L.A./Anaheim* Angels
59
330
387
382
400
370
365
330
Atlanta-Fulton
County Stadium
Atlanta Braves
58
330
385
402
385
330
Busch Stadium II
St. Louis Cardinals
64?
330
372
402
372
330
Oakland Coliseum
Oakland Athletics
45?
330
362
400
362
330
Jarry Park
Montreal Expos
62
340
368
420
368
340
Sick's Stadium
Seattle Pilots
54
305
345
402
345
320
Jack Murphy
Stadium*
San Diego Padres
75
327
370
405
368
330
Riverfront Stadium
Cincinnati Reds
51
330
375
404
375
330
Three Rivers
Stadium
Pittsburgh Pirates
60
335
375
400
375
335
Veterans Stadium
Philadelphia Phillies
60
330
371
408
371
330
Arlington Stadium
Texas Rangers
60
330
380
400
380
330
Kauffman Stadium*
Kansas City Royals
50
330
375
(410)
375
330
Olympic
Stadium
Montreal Expos
53
325
375
404
375
325
Kingdome
Seattle Mariners
63
331
(376)
358
405
(352)
340
312
Exhibition Stadium
Toronto Blue Jays
60
330
375
400
375
330
H.H.H.
Metrodome
Minnesota Twins
60
343
(385)
370
408
(367)
352
327
Skydome
Toronto Blue Jays
60
328
375
400
375
328
U.S. Cellular Field
Chicago White Sox
60
335
(375)
363
400
(375)
363
330
Oriole Park at Camden
Yards
Baltimore Orioles
58
333
364
(410)
400
373
318
Dolphins Stadium*
Florida Marlins
55?
330
360
(404)
394
(363)
373
345
Mile High Stadium
Colorado Rockies
60?
333
(366)
360
423
400
370
Jacobs Field
Cleveland Indians
60
325
(370)
360
405
375
325
Ameriquest Field*
Texas Rangers
60
332
(390)
380
400
381
325
Coors Field
Colorado Rockies
54?
347
390
415
(375)
382
350
Turner Field
Atlanta Braves
55?
335
380
400
390
330
Tropicana
Field
Tampa Bay Devilrays
48?
315
370
364
404
370
364
322
Bank
One Ballpark
Arizona Diamondbacks
58?
330
376
407
376
335
Safeco
Field
Seattle Mariners
62?
331
(388)
375
405
(385)
365
326
AT&T Park*
San Franciso Giants
55?
339
(382)
368
399
421/365
378
309
Minute
Maid Park*
Houston Astros
56
315
(362)
335
436
(373)
365
326
Comerica Park
Detroit Tigers
62?
345
370
420
(365)
388
330
Miller Park
Milwaukee Brewers
54?
344
370
400
374
345
PNC Park
Pittsburgh Pirates
55?
325
(378)
389
399
(375)
364
320
Great American
Ballpark
Cincinnati Reds
52?
328
(379)
365
404
(370)
365
325
Citizens Bank Park
Philadelphia Phillies
60?
329
(374)
360
401
(369)
357
330
PETCO Park
San Diego Padres
45?
334
(367)
378
396
387
322
Busch Stadium III
St. Louis Cardinals
55?
335?
375?
400?
375?
335?
Sources:
http://www.thegoodphight.com/2008/7/3/564256/homefield-advantage