TigerSoft
News Service 10/28/2008 www.tigersoft.com
TigerSoft
News Service 10/28/2008 www.tigersoft.com
THE BIGGEST U.S. STOCK
MARKET DECLINES
1915-2008
Applied
Lessons Appear Nightly in TigerSoft's On-Line Hotline.
by William Schmidt, Ph.D. (Columbia University)
 |
Tiger
Software
Research on Individual Stocks upon Request: Composite Seasonality Graph
|
|
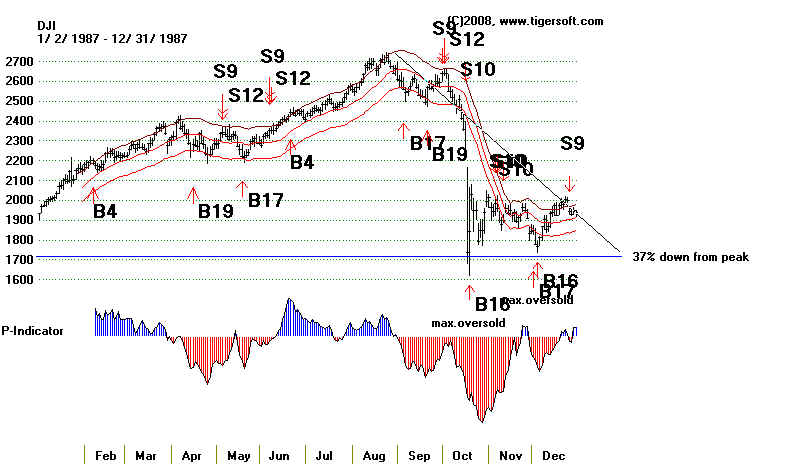
THE BIGGEST U.S. STOCK MARKET DECLINES 1915-2008 by William Schmidt, Ph.D. Stock market Crashes ruin the lives of millions. Each generation seems to have to learn the lessons of the past. History is not "more or less bunk", as Henry Ford said. History is our only hope of not repeating the same mistakes over and over again, and improving public policy and corporate conduct so that Crashes are limited in scope, duration and size. We study stock market history very closely. Many patterns repeat and repeat. Insiders always know in advance. We track their buying and selling to help you spot the changes in trend very early in the market's major moves. Our automatic Peerless Buys and Sells are derived from these studies. Using Peerless and TigerSoft is worth so much, how can you not want to use our insights and tools? Some tid-bits: 1) We use the DJI-30, not the SP-500 or the NASDAQ because its data goes back much farther. Barron's is the best source. 2) What happens in the US closely affects overseas markets. On October 19, 1987 the DJI lost 22.8% in one day! Overseas markets got clobbered. By the end of October, stock markets in Hong Kong had fallen 45.8%, Australia 41.8%, Spain 31%, the United Kingdom 26.4%, the United States 22.68%, and Canada 22.5%. New Zealand's market was hit especially hard, falling about 60% from its 1987 peak, and taking several years to recover.[2] 3) Wall Street malfeasance and corruption is devastating millions of people all over the World. The 2008 Crash, just like in 1908, 1929 and 1987 owes directly to unbridled greed and regulatory connivance. Short selling was again allowed in July 2007 on down-ticks and without even bothering to have to borrow stock. Leverage and excessive margin caused the Crashes of 1929, 1987 and 2008. Trust in Moodys and Standard & Poor's was woefully misplaced. Transparency was the exception. Greedy swindlers in the major banks exaggerated their profits to get obscene bonuses. They imprudently leveraged their firms to maximize their short-term profits and obscured the dangers therin. Confidence cannot be restored quickly. Tragically, when Wall Street fails to perform its capital allocation functions smoothly, rationally and responsibly, widespread suffering results on Main Street and around the world. Arrogantly dogmatic Wall Street ideologues de-cry regulation of Wall Street as socialism. Hardly! But with such great power must come responsibility. Wall Street must be regulated for safety of millions around the world. Wall Street cannot be trusted. Every generation seems to have to learn the hard way. I just got this email from someone in Hong Kong: "We are riding the roller coaster in the stock market here in hongkong. Things are pretty ugly here,wtih closing stores, restaurants, factories, high unemployment, disappearing employers and people jumping off the roof. the lehman brothers mini bonds affected thousands of investors in hongkong. some people's life saving got all wiped out. Everyday,the newspaper have bad news. it affects all walk of lives." 4) One can try to figure out what causes a collapse. For example, the causes for the Crash in 1987 can be discussed usefully. As citizens, we should care. As investors, it is important to predict crashes and bottoms. Seeing that insiders are selling can be every bit as important as knowing why they are selling. Congressman Edward J. Markey, had warned about the possibility of a crash, stating that "Program trading was the principal cause."[10] In program trading, computers perform rapid stock executions based on external inputs, such as the price of related securities. Common strategies implemented by program trading involve an attempt to engage in arbitrage and portfolio insurance strategies. The trader Paul Tudor Jones predicted and profited from the crash, attributing it to portfolio insurance derivatives which were "an accident waiting to happen" and that the "crash was something that was imminently forecastable". Once the market started going down, the writers of the derivatives were "forced to sell on every down-tick" so the "selling would actually cascade instead of dry up."[11]  Wall
Street Racism Wall
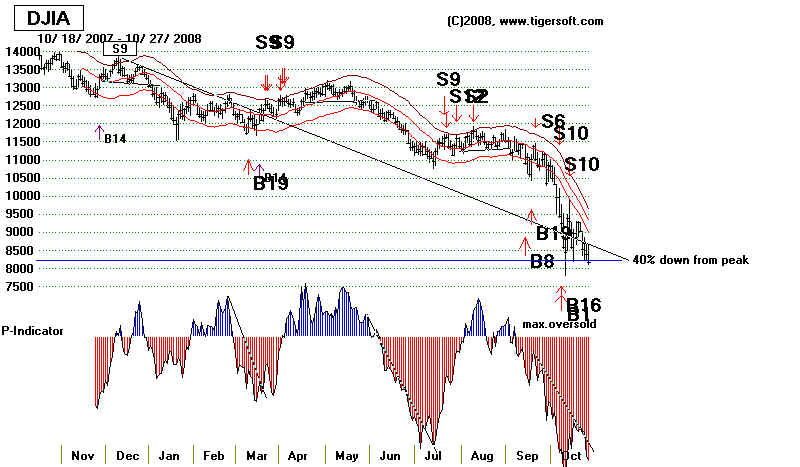
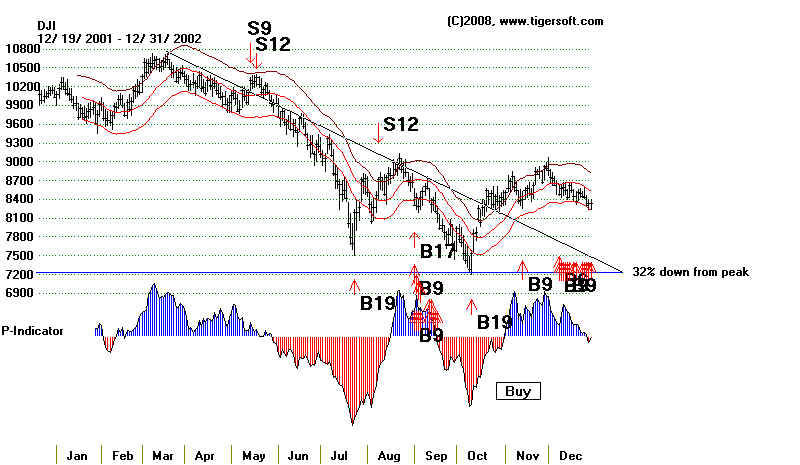
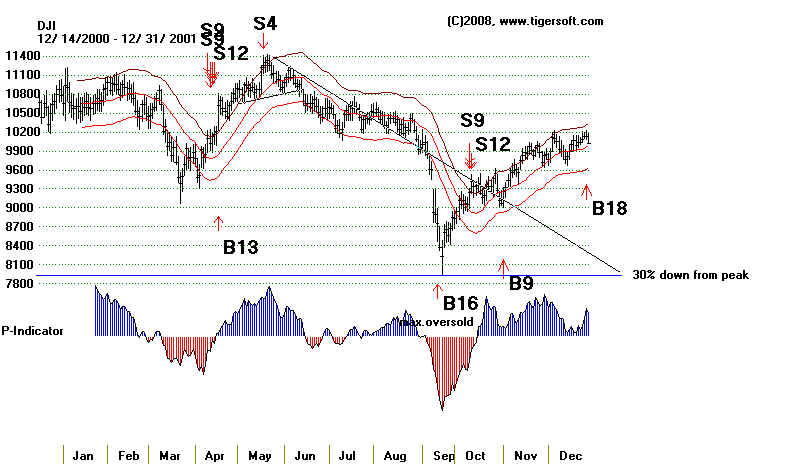
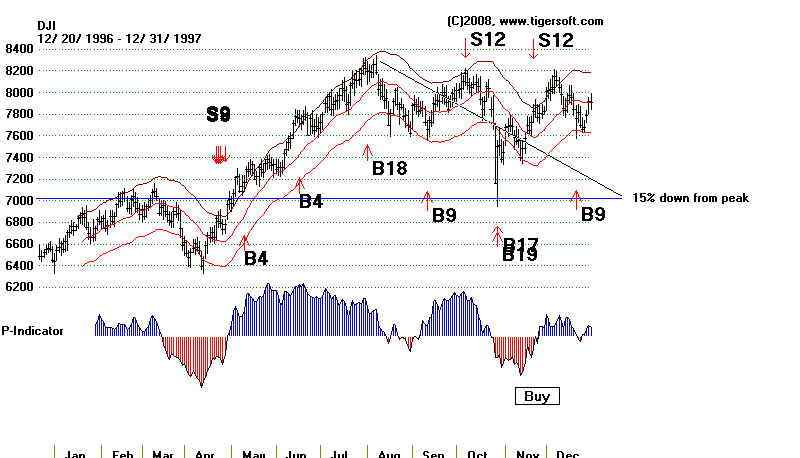
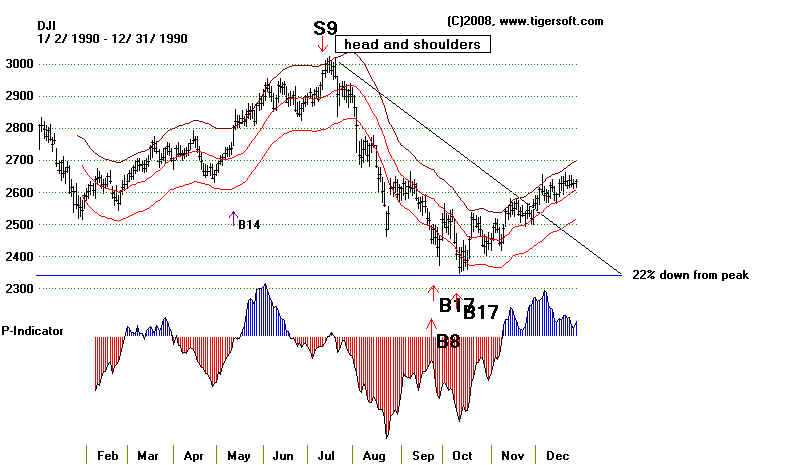
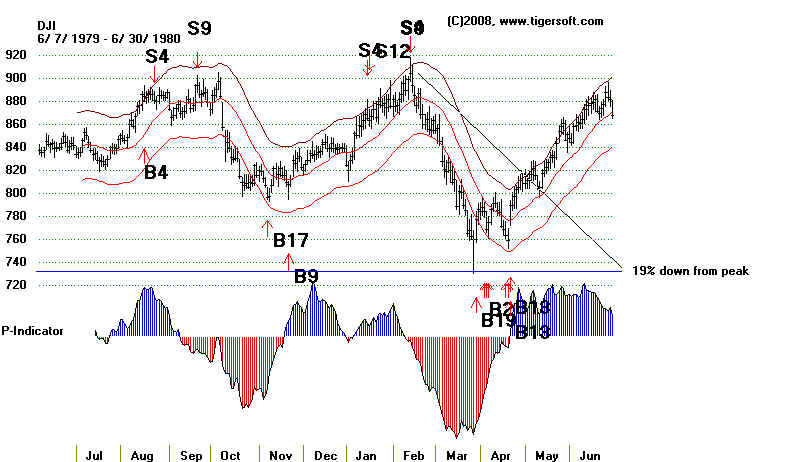
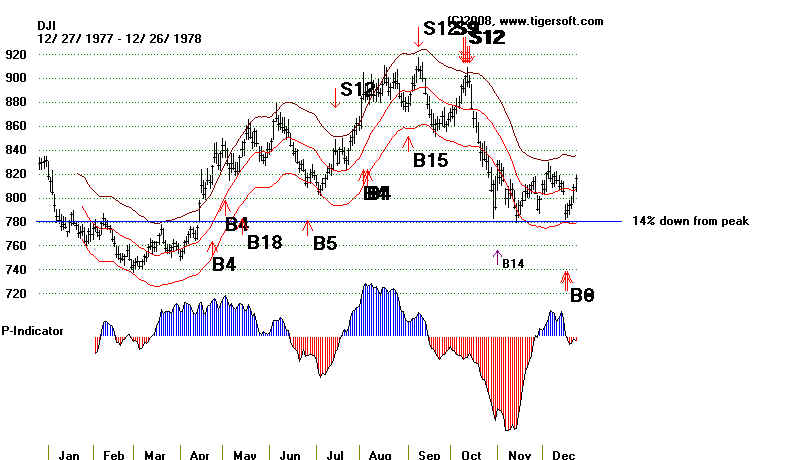
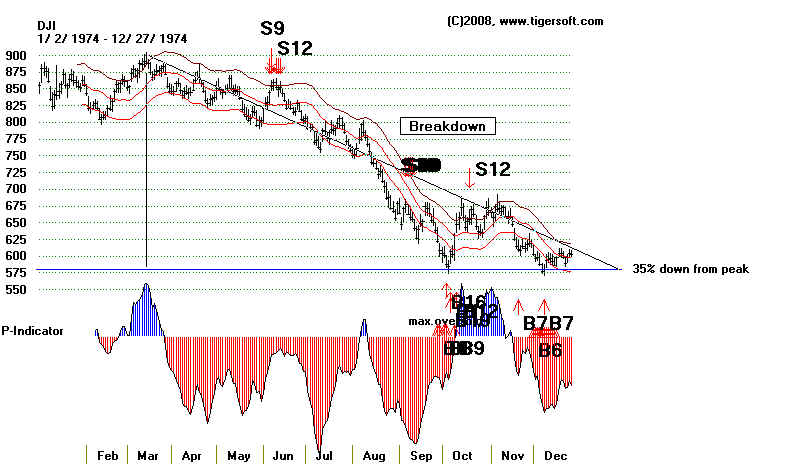
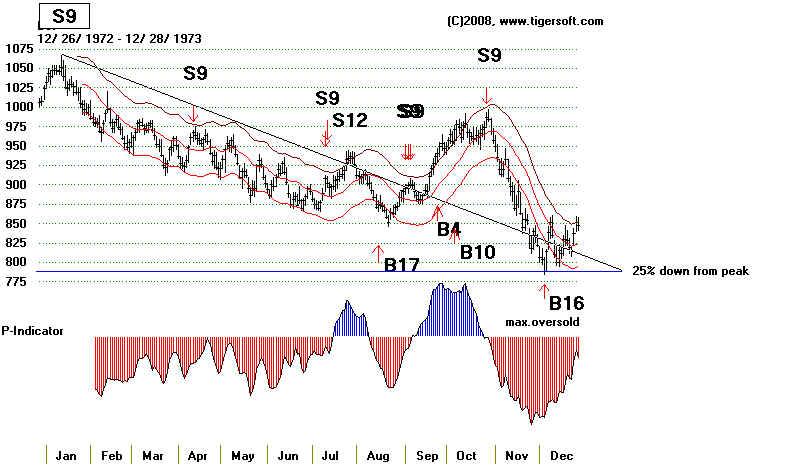
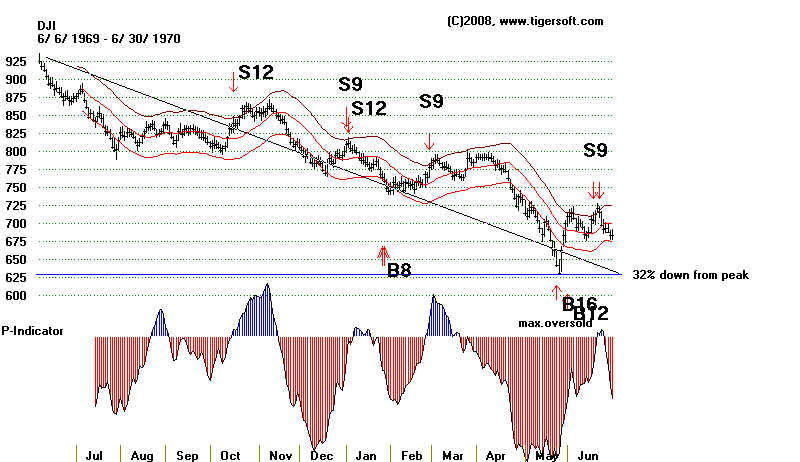
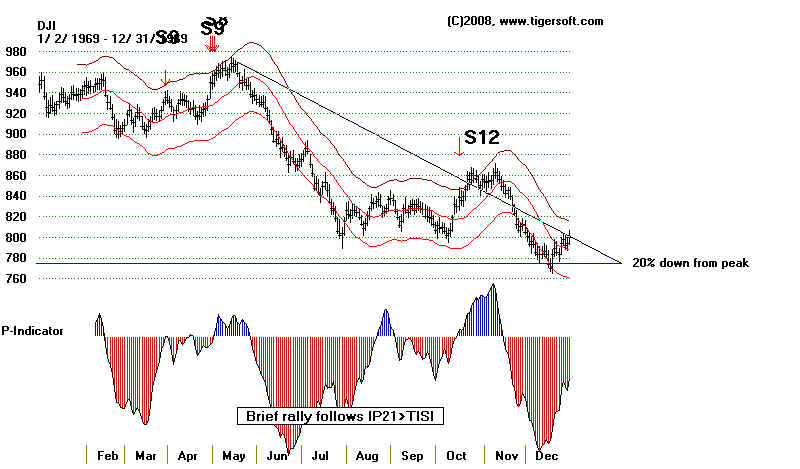
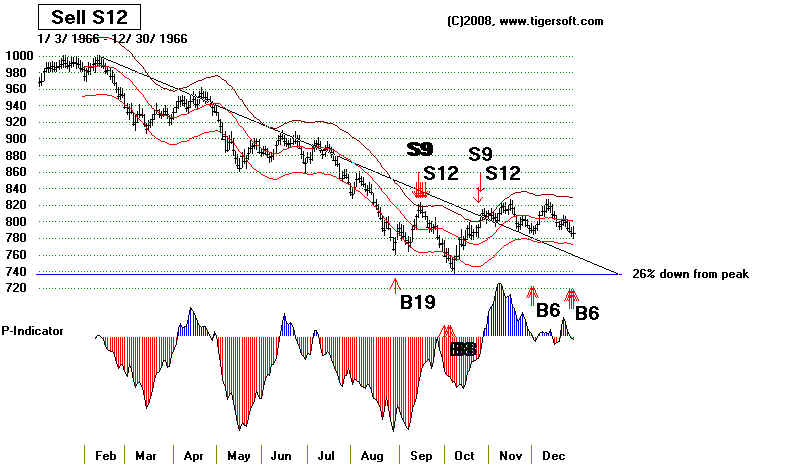
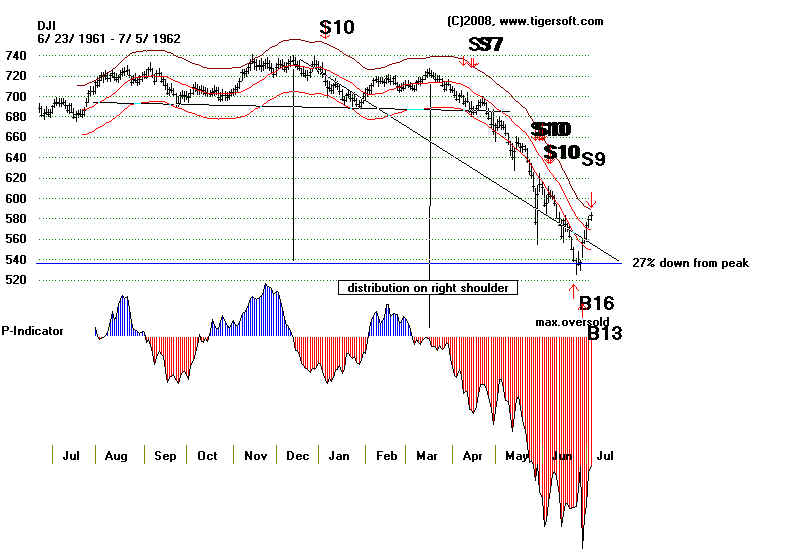
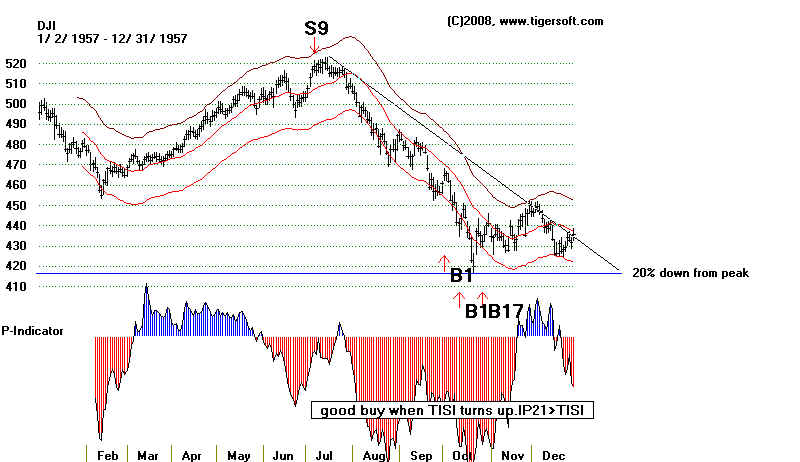
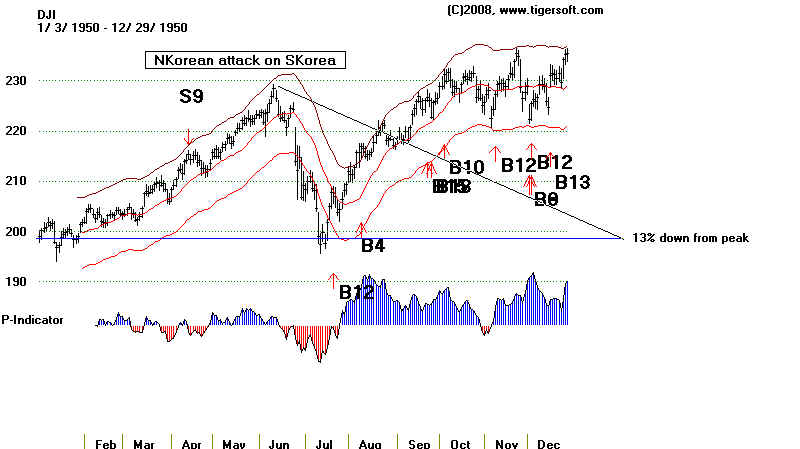
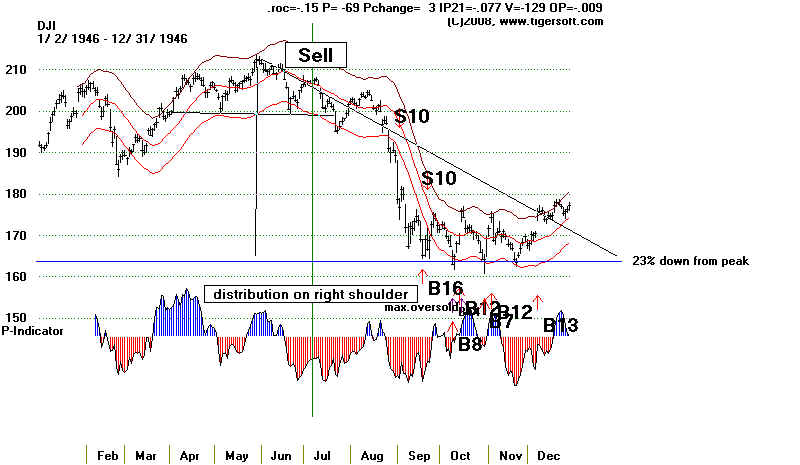
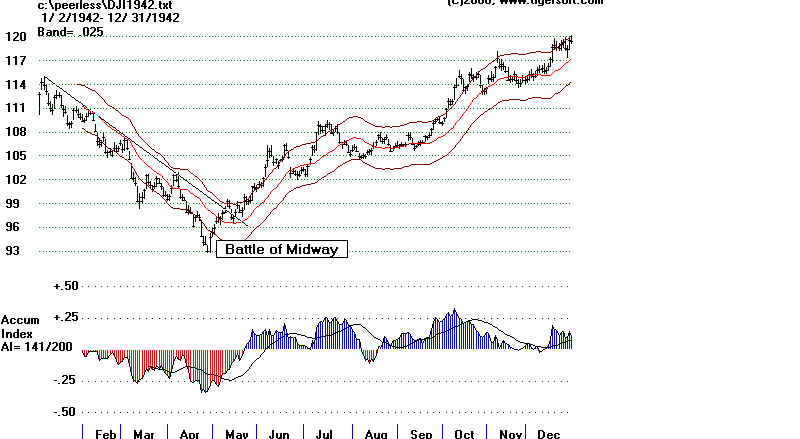
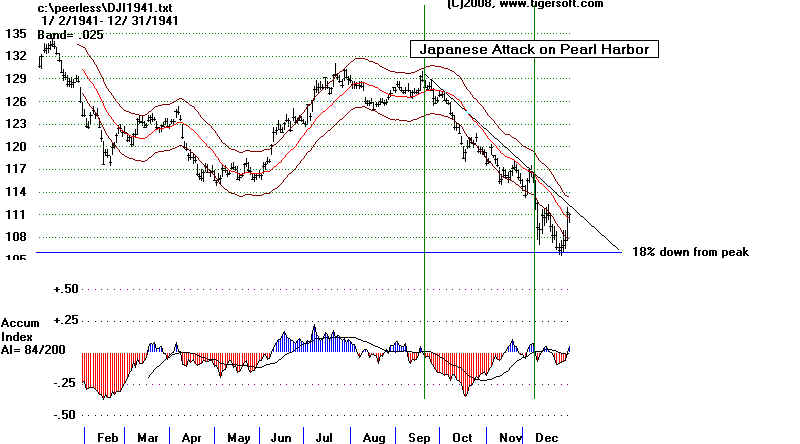
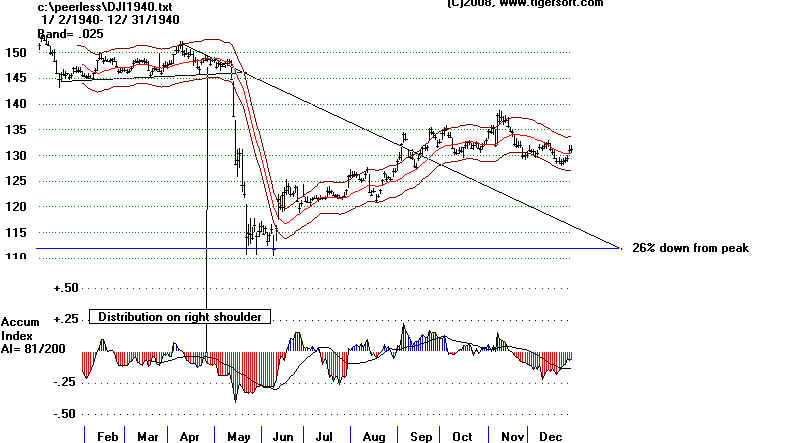
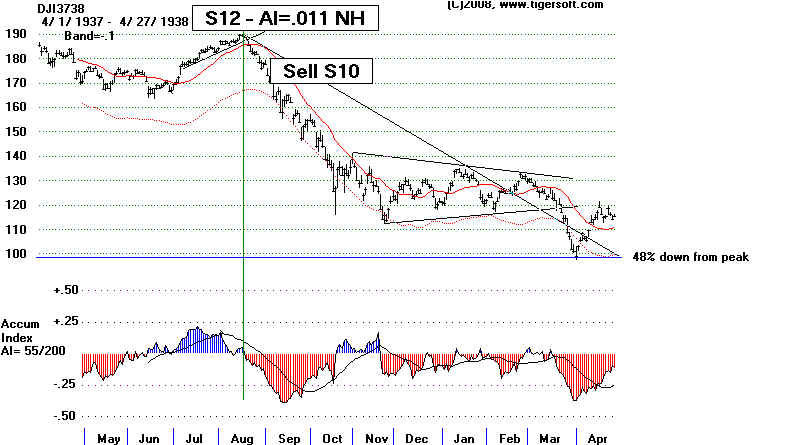
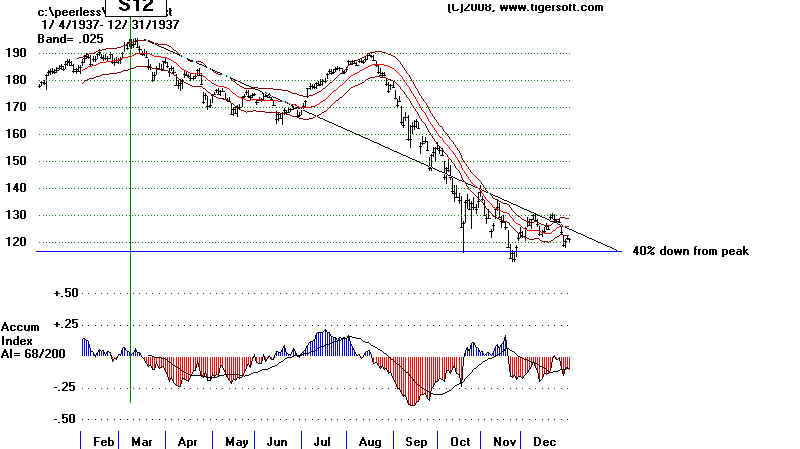
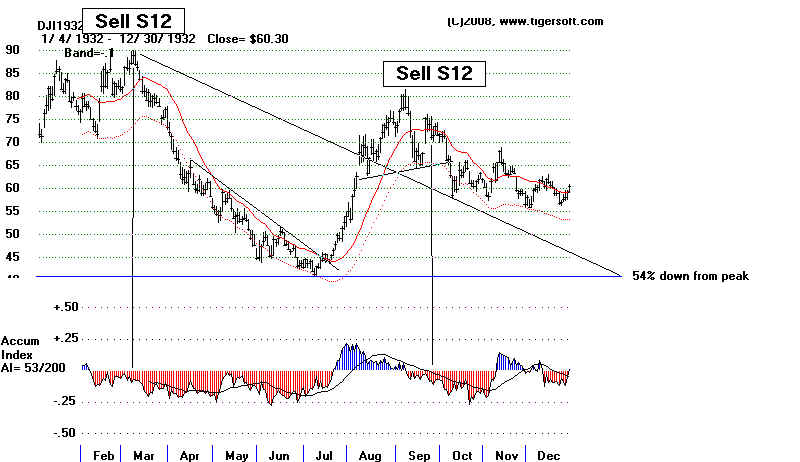
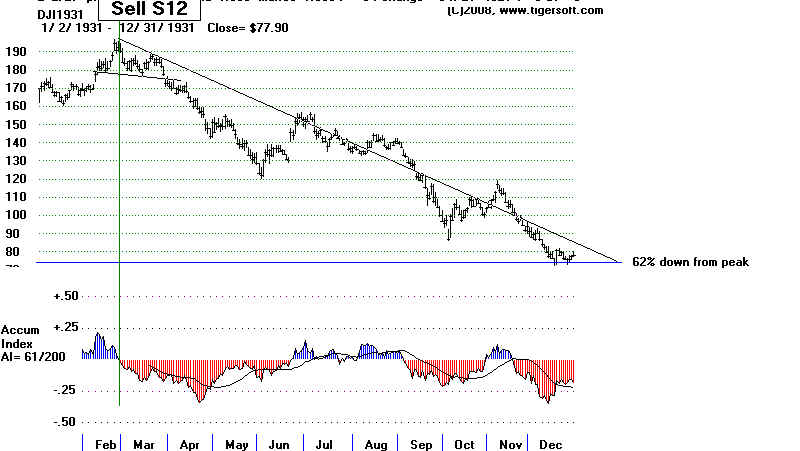
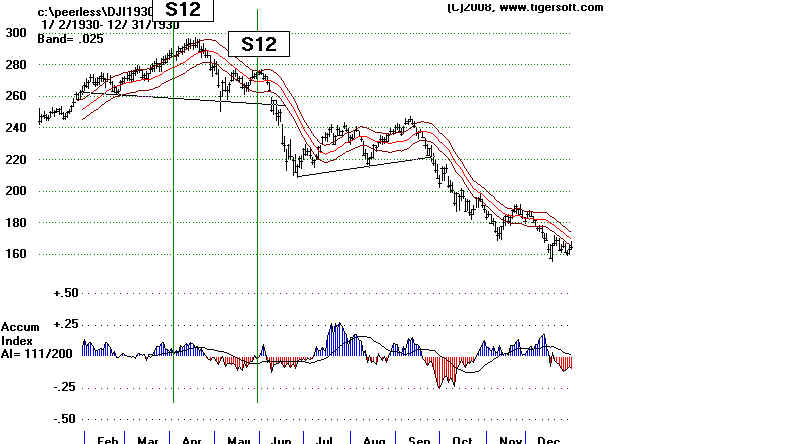
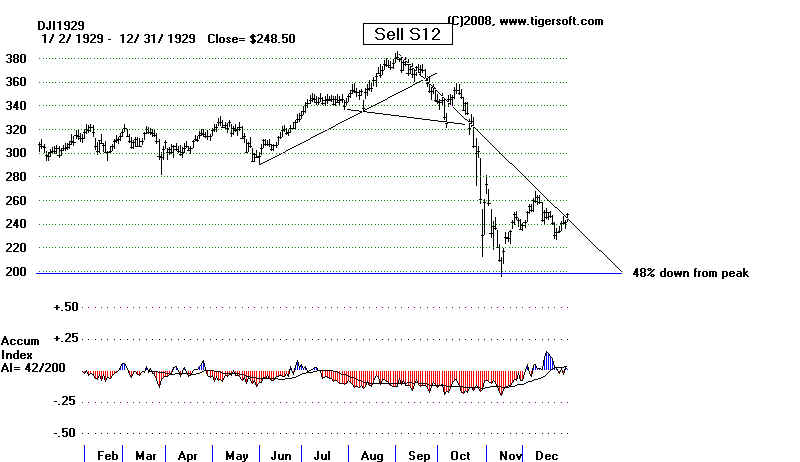
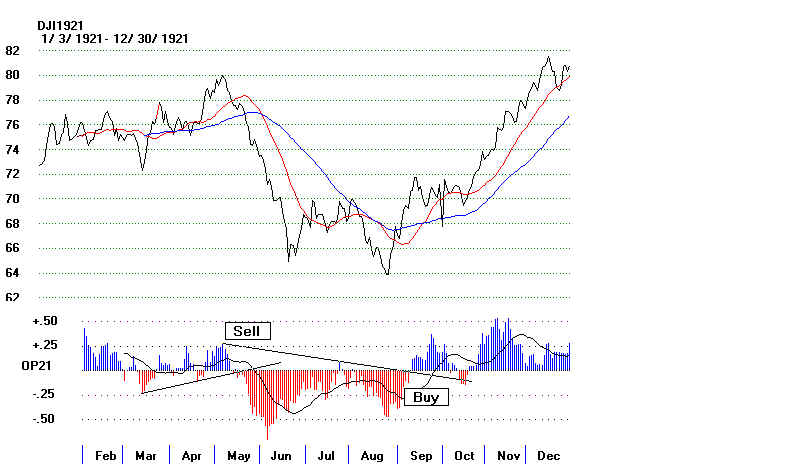
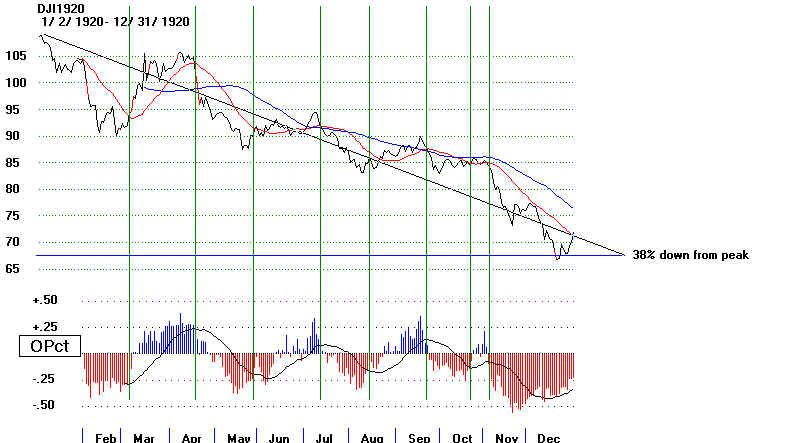
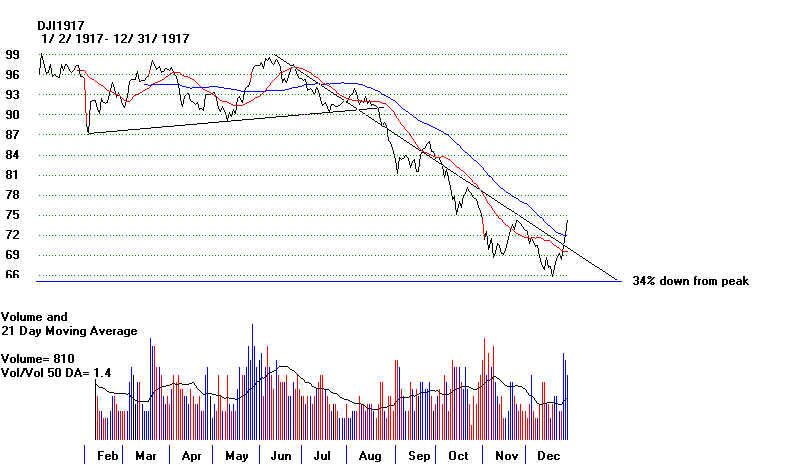
Street Racism 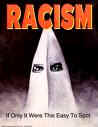 4) Wall Street is one of the most segregated and racist communities in America. They even call big drops of a given day of the week, "Black Monday". Or in 1929, they talked about "Black Thursday" or "Black Tuesday". But Black people had nothing to do with it. Why not call them "White Crashes", since white people not Black people brought them to pass, causing widespread suffering not just in the US but around the world. Wall Street hype, insider trading, excessive leverage, self-serving lies, obfuscation and unregulated short selling. brought about the crashes and the resulting Depressions, Lay-Offs and Recessions. The world pays for Wall Street's misdeeds for years and years and then Wall Street terms the "Black Days." What arrogance! It's like Karl Rogue blaming Obama for the Financial Panic of 2008. People interested in Wall Street racism can do a lot of reading. One Womans Story of Racism & Sexism on Wall Street Black and White on Wall Street: The Untold Story of ... Bonfire of Vanities. Displacement of Blacks and Financial Crisis CHARTS OF THE DJI IN BEAR MARKETS:
|
|||||||||||||||||||||||||||||||||||||||||||||||||||||||||||||||||||||||||||||||||||||||||||||||||||||||||||||||||||||||||||||||||||||||||||||||||
| |
|||||||||||||||||||||||||||||||||||||||||||||||||||||||||||||||||||||||||||||||||||||||||||||||||||||||||||||||||||||||||||||||||||||||||||||||||