WEEKLY PRICE AND VOLUME CHARTS
Weekly charts are coming to TigerSoft soon.
The weekly chart of a
home-builder Lennar shows
a 15
year price uptrend, from 2 to 60. Prices moved
upwards in a channel, made up of parallel lines of
support
and resistance. In 1998, prices broke above
a rising resistance line and then
fell back within the|
earlier pattern. The false breakout discouraged buyers
until in late 1999-early 2000, the well-tested price support
held. Prices then achieved a valid breakout in 2000
and moved steadily up to a peak
near 50, at the top of
the price
channel. The steep price
uptrend-line was
violated and from 2004-2006, a bearish head and shoulders
pattern developed. This
chart comprises most of the
key concepts used by a professional
chartist.
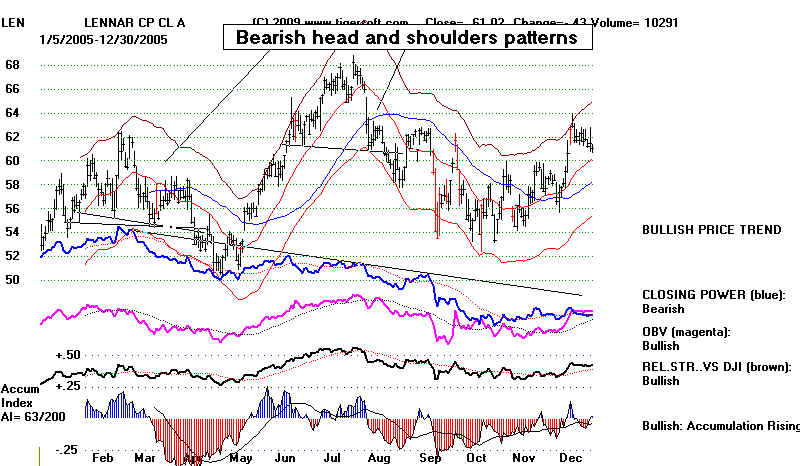
LONGER-TERM CHART OF HOME-BUILDER LENNAR 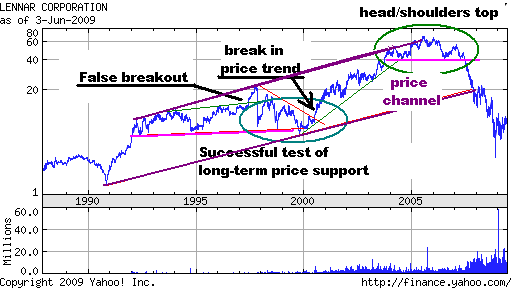
After a long advance in a stock, be on
the look out for topping
patterns. Head and shoulders
tops have been common topping patterns
going back, at least, to the 1920s.
LEN's daily chart of the exact top
shows two head and shoulders
patterns within the longer term head
and shoulders top shown by the
weekly chart. Note how the daily
chart shows heavy red down volume
days, red insider selling from the
TigerSoft Accumulation Index and
increasing professional selling,
as judged by the falling TigerSoft
CLosing Power.
Home-Builder Lennar at 2005 Top. Daily TigerSoft Chart
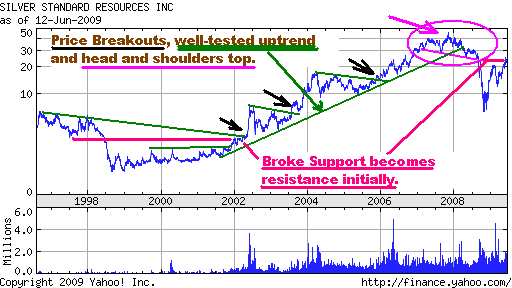
The concepts in the LEN charts above
reoccur in the
longer-term chart of SSRI.
There are price breakouts
above reisstance from 2002-2006.
But in 2007 there
is a false breakout over 40.
A bearish head and shoulders
top forms and prices break down
badly.
A new
concept here is that broken
support tends to
become resistance. The broken support (the neckline
in the head and shoulders pattern)
tends to be resistance
on the next rally or two. If there is a rise in volume, this
resistance from broken support may
be overcome and
then prices will rise, as in 2002.
LONGER-TERM CHART OF SILVER STOCK - SSRI.
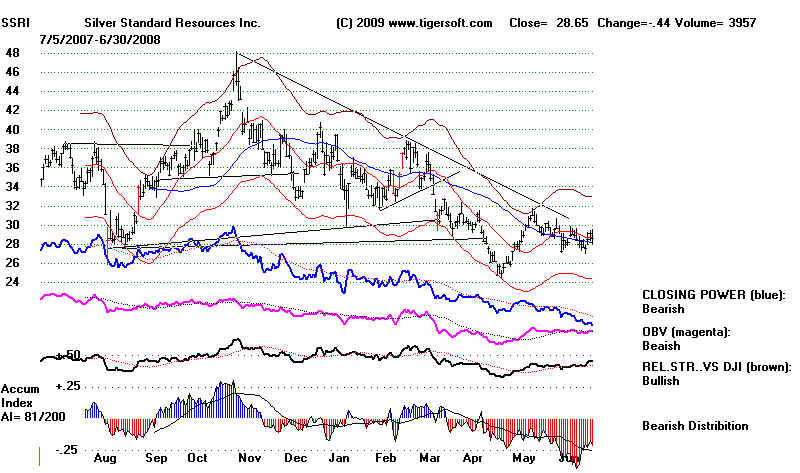
DAILY CHART OF SILVER STOCK - SSRI in
2007-2008.
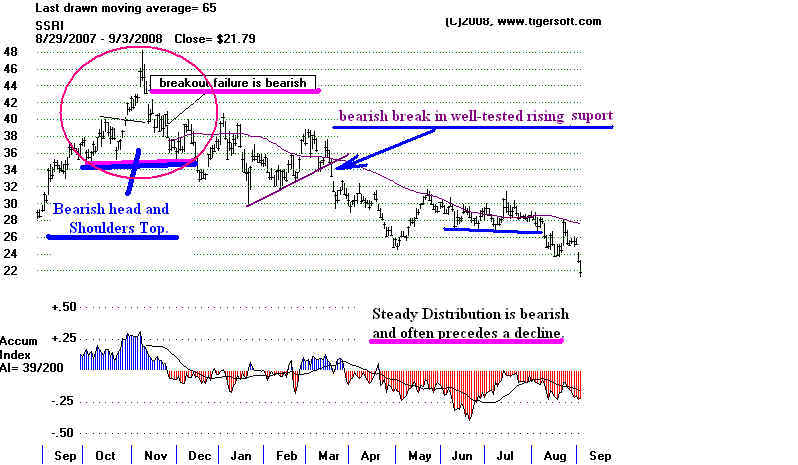
Breakouts on high volume above
flat or nearly flat
and well-tested
(3x or more) resistance are often very
bullish. As the scale grows smaller because of big
price increases,
the resistance looks flatter and the
breakout more
dramatic. Traders will want to watch
these on weekly
and daily charts. TigerSoft's Power
Ranker makes this
easier.
LONGER-TERM CHART OF QUALOMM.
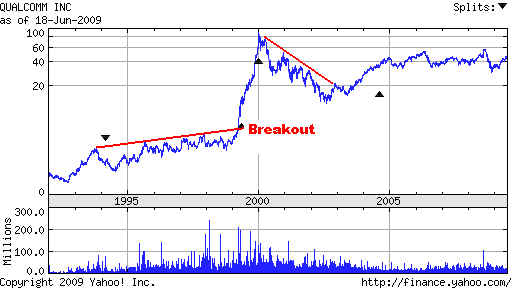
Compare the
weekly chart of QCOM's stellar breakout in
1999 with the daily TigerSoft chart
below. Note the flat
top, unusual volume on the breakout, very
high Tiger Accumulation
and multiple TigerSoft automatic Buys.
All these are flagged
by the TigerSoft Power Ranker.
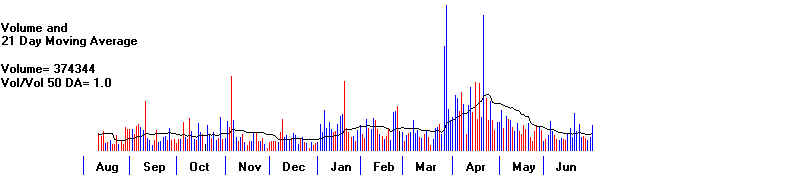
TIGERSOFT DAILY CHART OF QUALCOMM - 1998-1999.
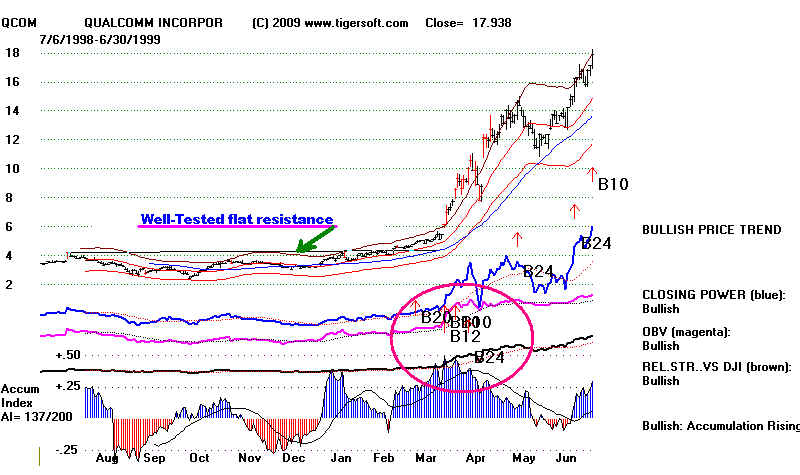 
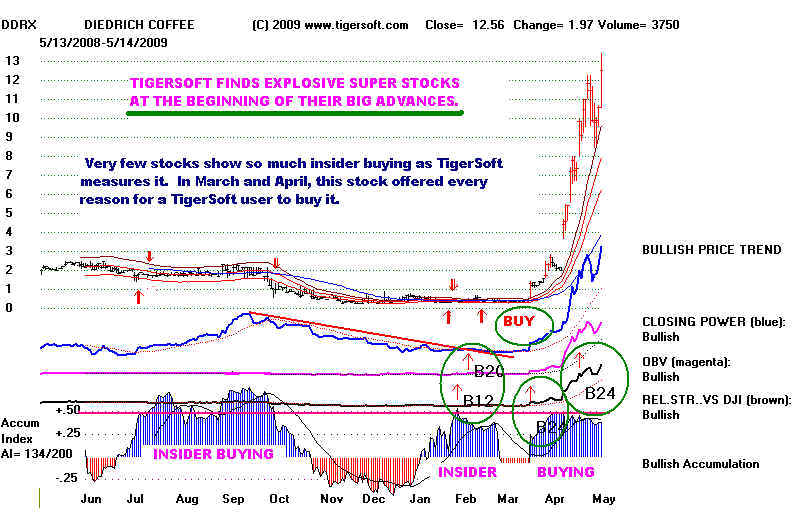
Compare the breakout in QCOM
with the best performing|
stock of the 2nd Quarter in 2009.
The daily TigerSoft charts
make these breakout stocks'
emergence from their previous
trading ranges appear more
dramatic, by highlighting red high
volume, insider buying and nested
automatic Red Buys.
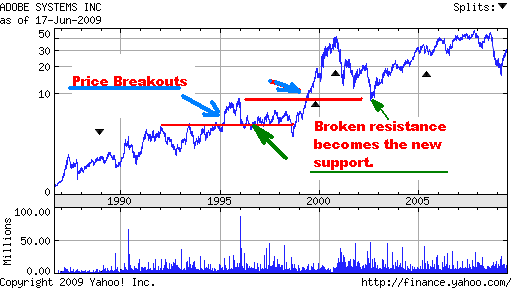
Broken resistance tends to become support. If
general market conditions are weak, there
is often
a retreat following a valid breakout to
the new support
that develops at the point where there
was an earlier
price breakout.
:LONGER-TERM CHART OF ADBE.
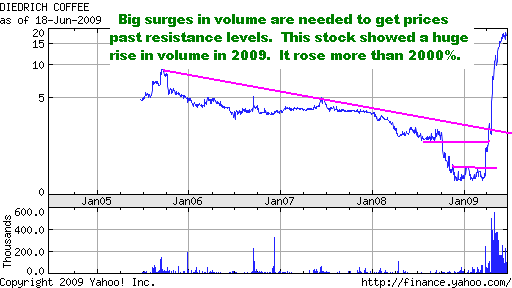
Unprecedented Volume
surges are important.
On
advances, they are usually needed to allow
dramatic price advances past points that would
otherwise be bexpected points of resistance.
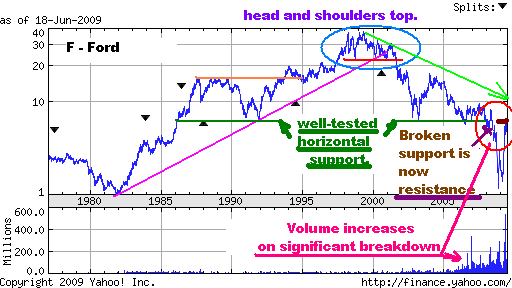
Unprecedented Volume surges in FORD confirmed
the
bearishness of the price breakdown below
the
well-tested support in 2008.
For weekly charts, go to Yahoo + Finance
+
stock symbol +
max (chart on right)
Read John T.
Murphy, Technical Analysis of The
FInancial
Markets, 49-156
TigerSoft Weekly
Charts only go back 5 years, but
they have the
advantage of showing that data in a way
that can be
manipulated and studied in detail.
WEEKLY TIGER CHART -
HOT COFFEE STOCK - DDRX

WEEKLY TIGER CHART -
HOT SILVER STOCK - SSRI 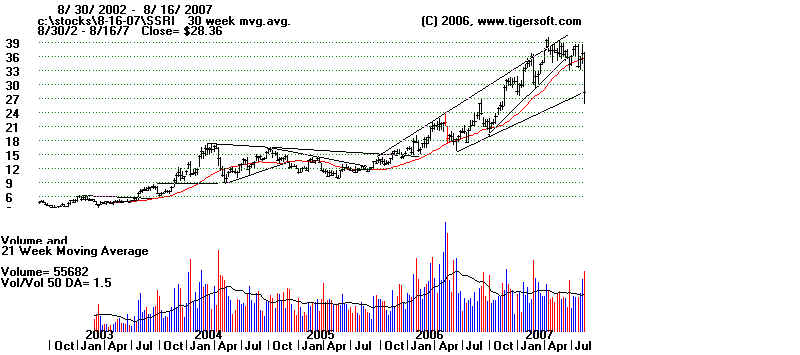
The TigerSoft
daily charts allow a trader to
focus
on tactics. The weekly charts offer a
strategic
approach. The rules developed here can be
applied
over and over to most weekly and daily charts.
In the
next few weeks TigerSoft will be setting up
weekly data
for all stocks.
Below are the Daily TigerSoft
charts
of the volatile silver stock from 2003 to 2009.
The
charts below show 12 month charts for the full
year
and also for two half years.
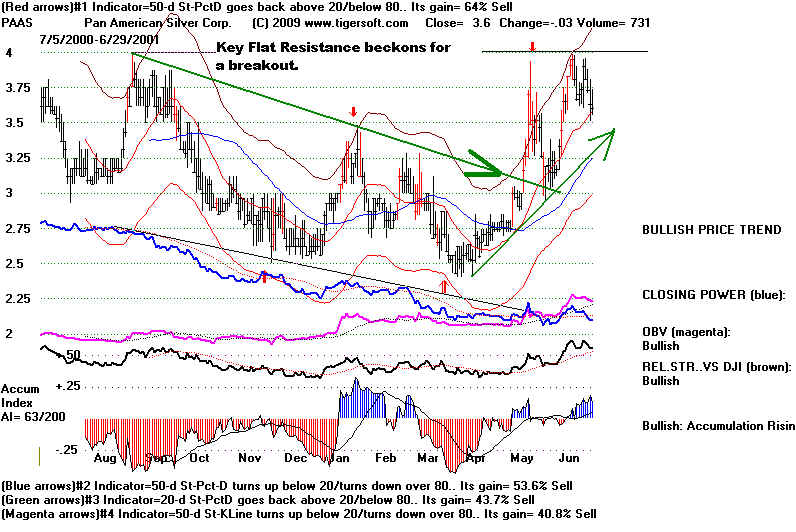
When start to study charts,
emphasize the price charts
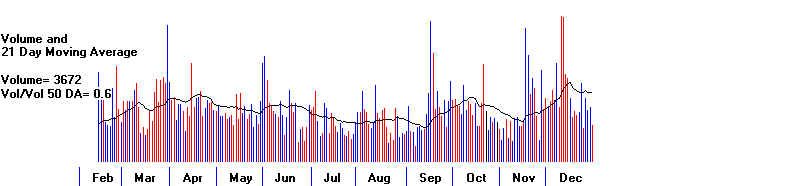
first. Then look for volume
to confirm the rises. It usually
takes more and more volume to keep
a stock moving up.
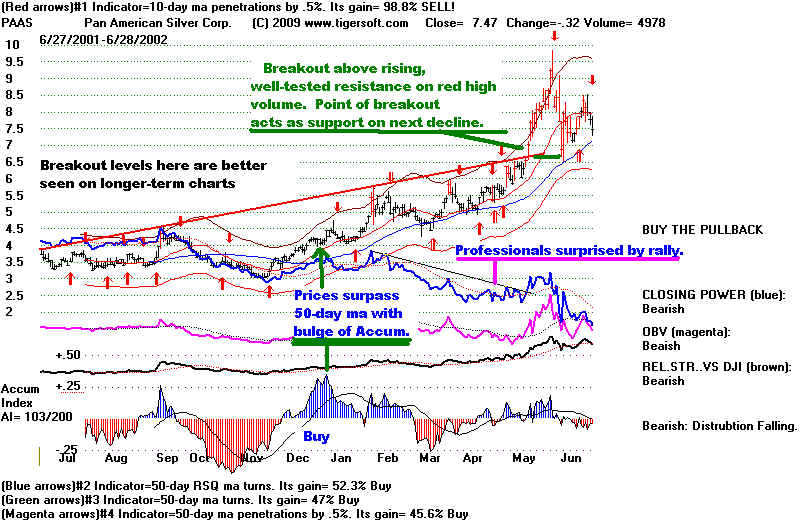
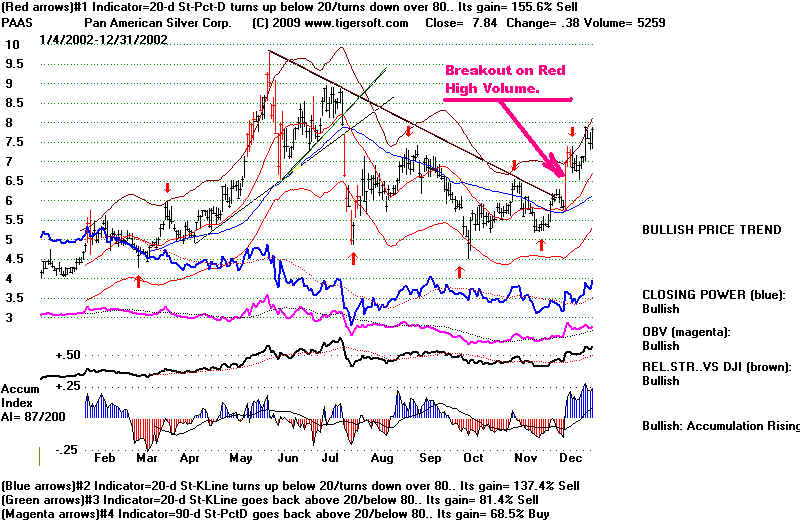
Price breakouts and price
breakdowns should be confirmed
by red price-bars showing unusual
volume at the time of
or soon after the breakout or
breakdown.
TigerSoft uses other indicators to confirm moves:
1. Tiger's Closing Power - Professional Buying
2. OBV - A crude but effective indicator which should,
if a move is confirmed, make new highs when prices
do and make new lows when prices make new lows.
3. Relative Strength. How strong is the stock versus the DJIA?
4. Tiger's Accumulation Index. What are insiders doing?
Are they buy into weakness or sell on strength?
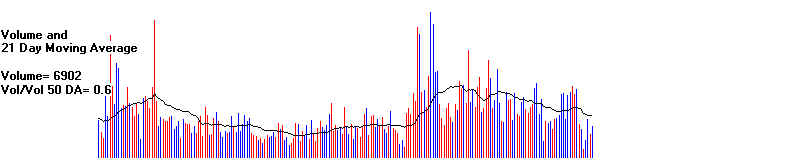
5. Volume histogram.
SSRI - Silver Standards: 2003-2009
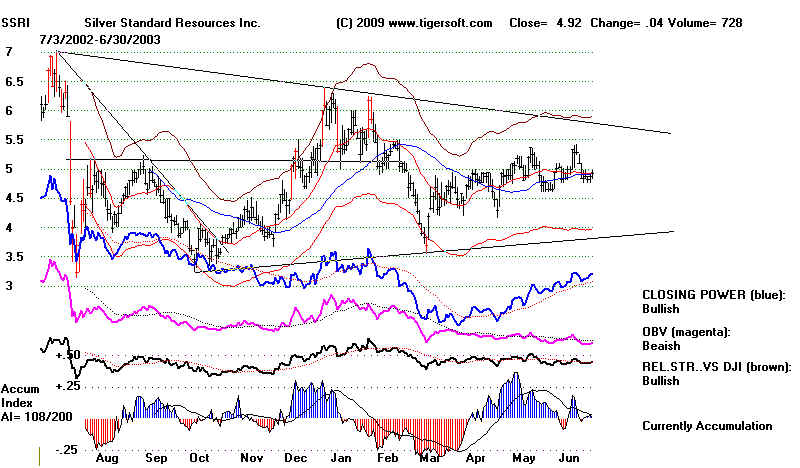
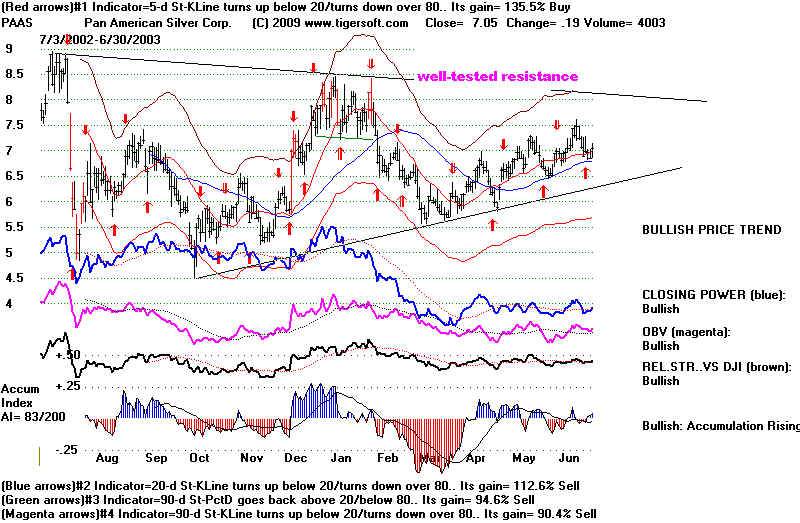
DAILY SSRI - 2002-2003
A quiet basing period. Practice
with drawing lines through bottoms and tops
to see support and resistance. The red high volume days in December and
January - shown by the red price bars - occur at resistance points. Bulls
will want to see red high volume on breakouts. At other times. it may show
high volume churning, which can be a pivot point of trends.
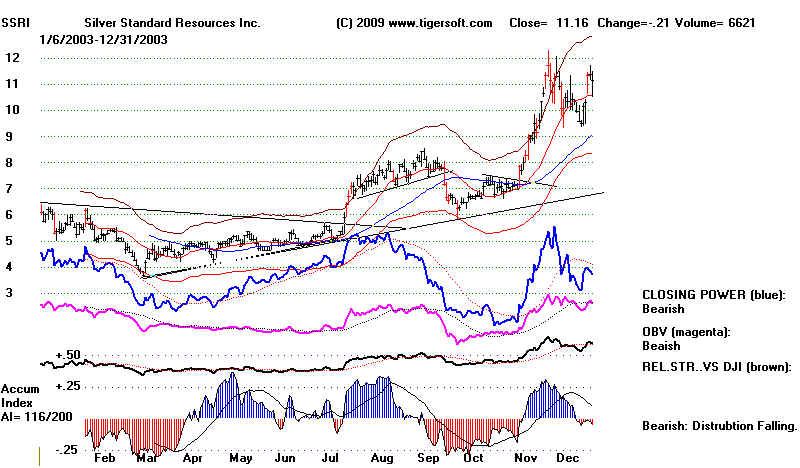
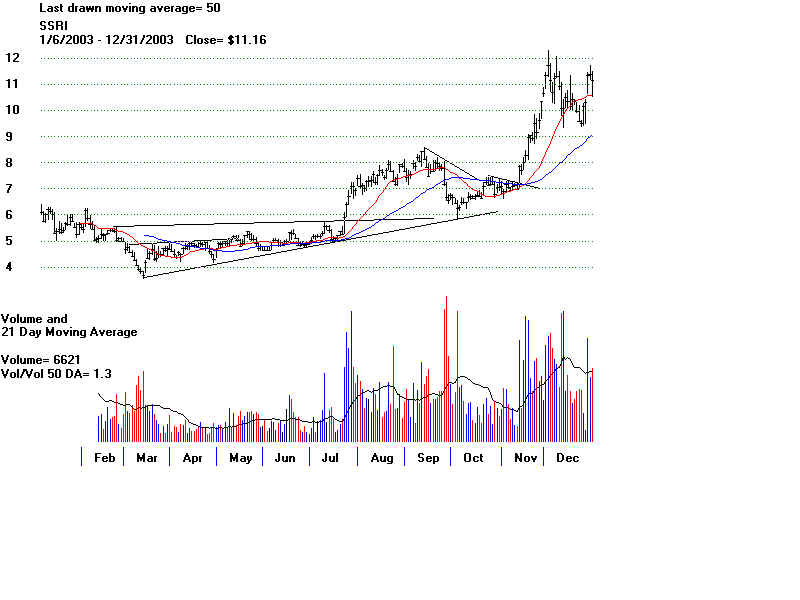
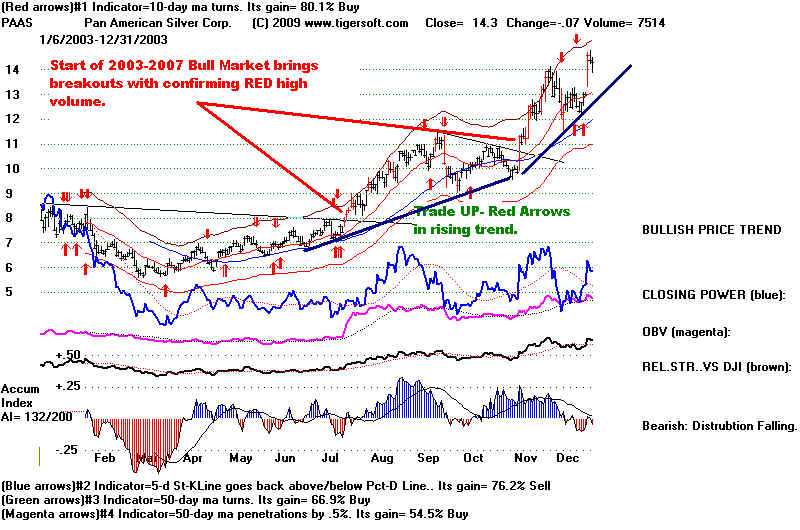
DAILY SSRI - 2003
See the price breakouts
in July and November. Watch what the
internal strength indicators do in these cases and whether the price bars on
the breakouts turn red.
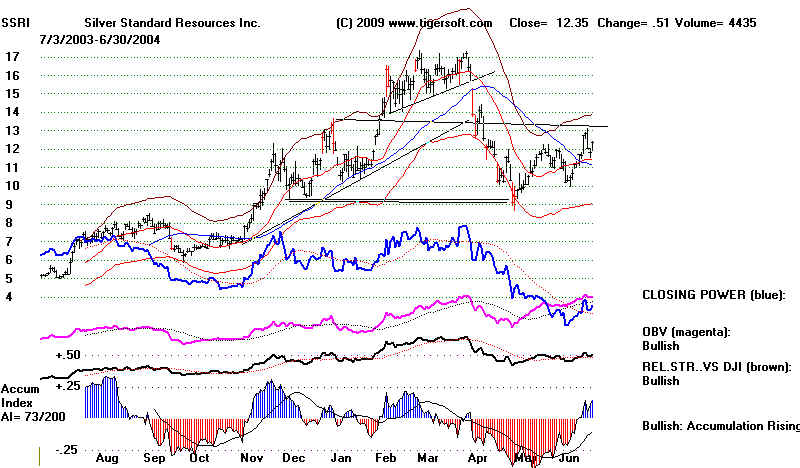
DAILY SSRI - 2003-2004
In March 2004, the
Accumulation Index turns red before the decline.
Then prices gap down on red high volume.
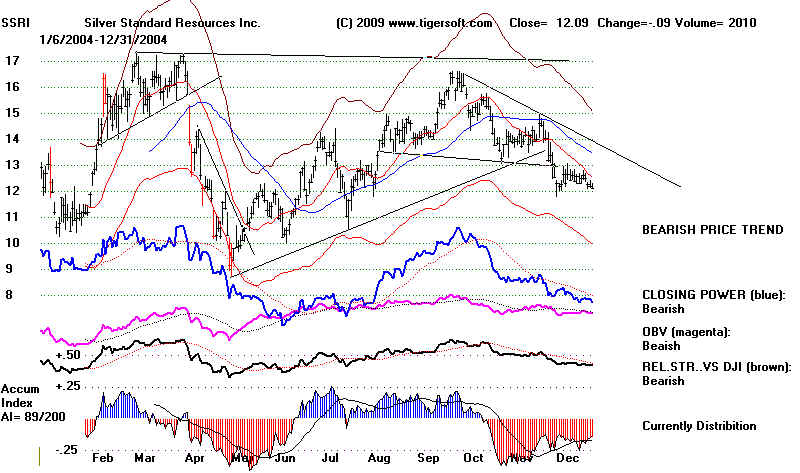
DAILY SSRI - 2004
In wild-swinging periods, use the
trends of the Blue Closing Power.
Draw trendlines on them.
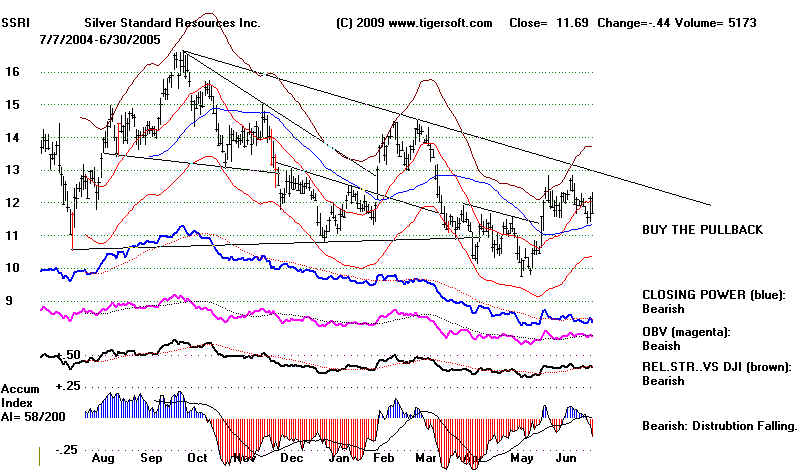
DAILY SSRI - 2004-2005
See the August-Sept.head and shoulders patterns. You can confirm
the
bearishness of such a pattern by noting that the Accum. Index is negative
and red on
the right shoulder.
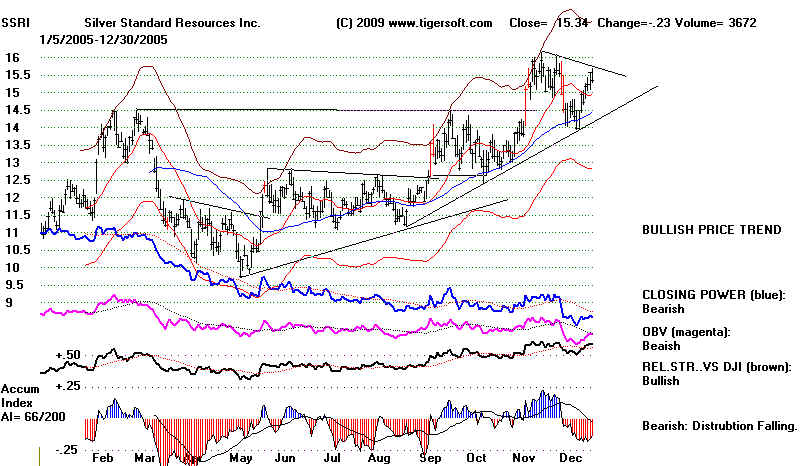
DAILY SSRI - 2005
Broken resistance levels becomes
support with each stage upwards..
DAILY SSRI - 2005 - 2006
Price
channels and easy to spot trendlines here. False breakout at thge top.
Blue 50-day ma shows trend, too. Watch for ruptures of it.
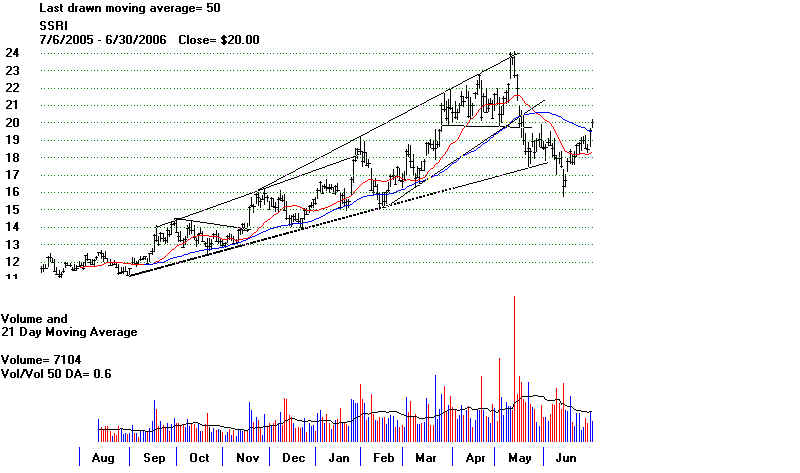
DAILY SSRI - 2006
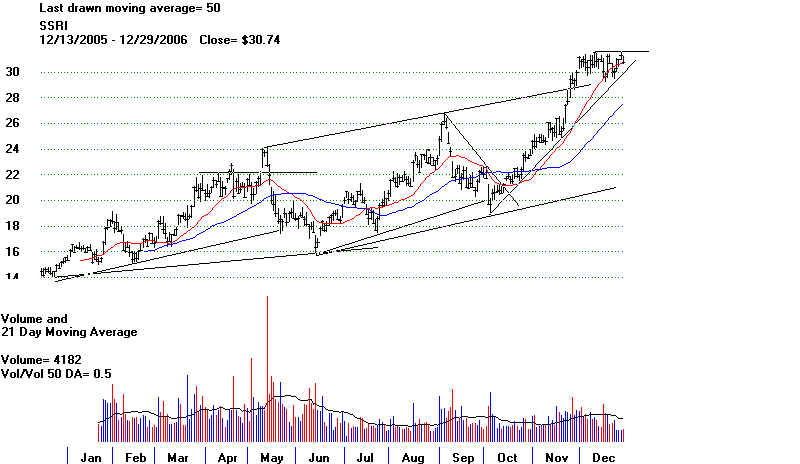
DAILY SSRI - 2006 - 2007
Note price channel.
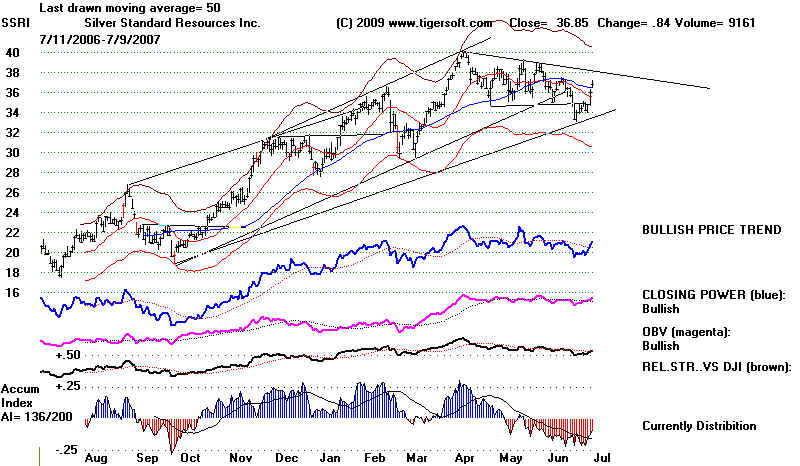
DAILY SSRI - 2007
Head and shoulders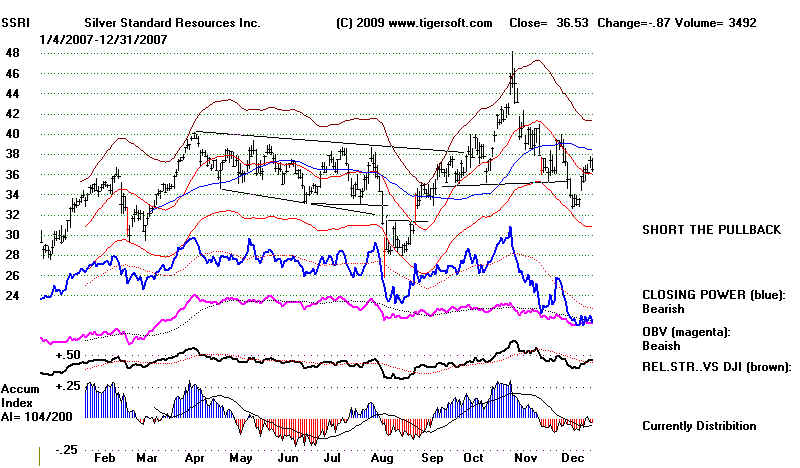
DAILY SSRI -
2007-2008
DAILY SSRI - 2008
Price break-down below support.
Inverted head and shoulders pattern appears at bottom.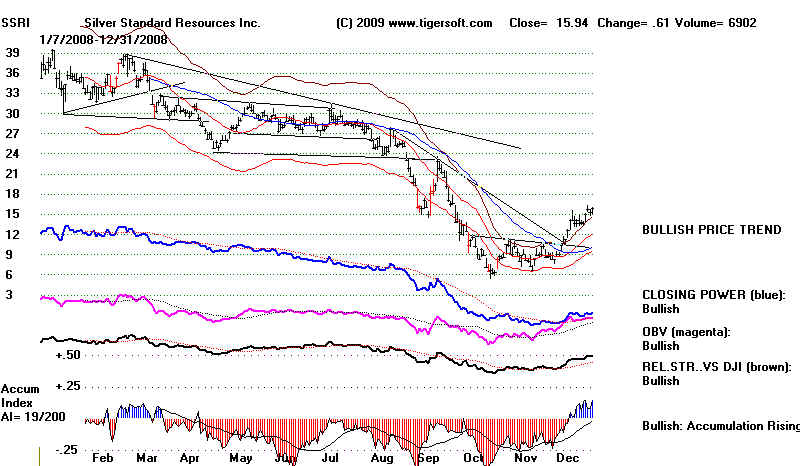
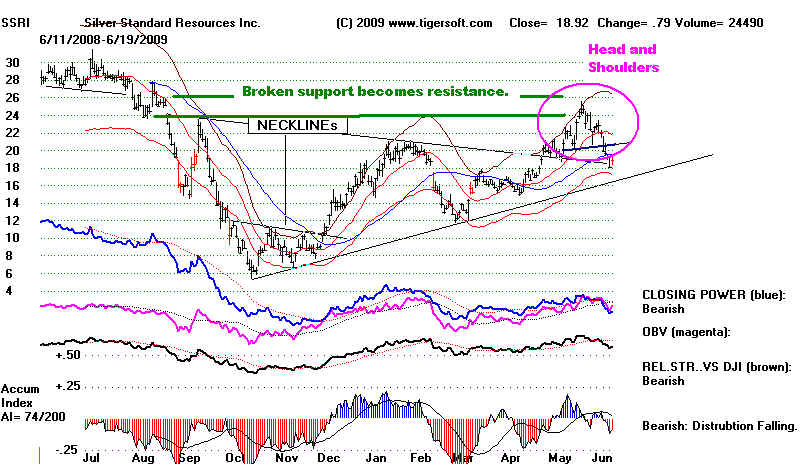
DAILY SSRI - 2008-2009
Stocks this volatile can be traded well
watch the CLosing
Power trends. Do you see the TWO head shoulders patterns
here? At the bottom there in an inverted head and shoulders
pattern. When prices surpass its neckline, BUY.
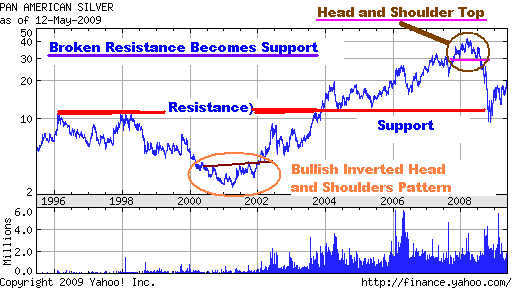
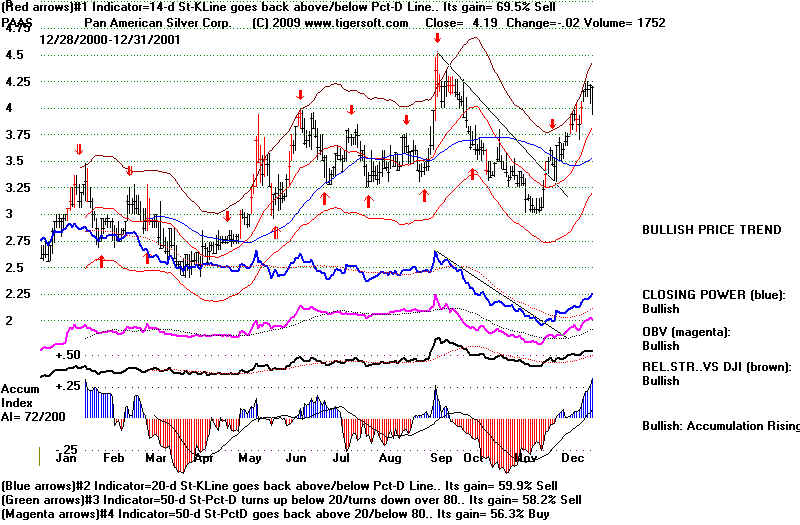
PAAS - Pan American Silver: 1999-2009
|