 TigerSoft
New Service TigerSoft Blog - 4/26/2011
TigerSoft
New Service TigerSoft Blog - 4/26/2011PEERLESS TRADING OF LATIN AMERICAN
AND BRAZILIAN STOCKS
Using PEERLESS STOCK MARKET TIMING: 1915-2011
Simply super-impose the automatic Buys and Sells from Tiger's
Peerless Stock Market Timing onto the
charts EWZ (Brazil), ILF (Latin America),
EWW (Mexico).
Mexico - $1000 becomes
$99,947 in 15 yrs.
Brazil - $1000 becomes $47,094 in 10
years.
Latin America $1000 becomes $25,042 in 9 years

![]() TigerSoft Makes The Stock Market Simple, Easy Safe Profitable!
TigerSoft Makes The Stock Market Simple, Easy Safe Profitable!
Simply super-impose the automatic Buys and Sells from Tiger's
Peerless Stock Market Timing onto the
charts EWZ (Brazil), ILF (Latin America),
EWW (Mexico)
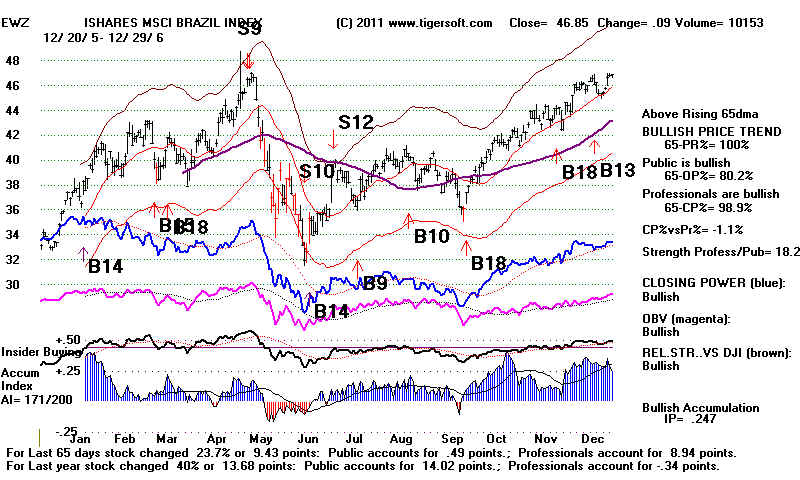
EWZ (Brazilian ETF) - 26 Peerless Trades since 2001,
Avg.Gain= 21.2%/trade.
$1000 becomes $47,094 in
10 years.
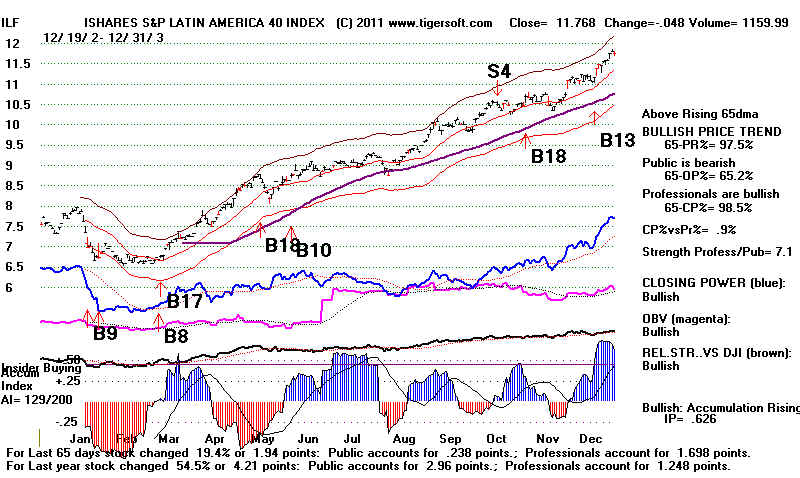
ILF (Latin American ETF) 24 Peerless Trades since
2002,
Avg.Gain= 18.4%/trade $1000 becomes $25,042 in 9 years
EWW (Mexican ETF) 35 Peerless Trades since 1996,
Avg.Gain= 17.7%/trade.
$1000 becomes $99,947
in 15 yrs.
See http://www.tigersoftware.com/TigerBlogs/May-16-2009/index.html
Results conservatively do not include
dividends
and
assume 2% for slippage/commissions
per
round-trip trade.
Results are as of
4/21/2011. No Sell signal occurred there.
EWZ (Brazilian ETF) 26 Peerless Trades since 2001,
Avg.Gain= 21.2%/trade. $1000 becomes $47,094 in 10 years.
Peerless Automatic Buys and Sells
Produce Very Big Profits
for A Trader of EWZ, the ETF for Brazilian Stocks
2001-2011
Trade Dates Signals EWF Pct. Gain $1000
Becomes
---------------------------------------------------------------------------------------------------------------------------------------------------------
1             3/ 23/ 1     BUY            14.3          4.1%           1021
1             5/ 17/ 1     SELL           14.9
----------------------------------------------------------------------------
2             9/ 19/ 1     BUY            9.33          38.3%          1393
2             2/ 26/ 2     SELL           12.91
----------------------------------------------------------------------------
3             7/ 24/ 2     BUY            8.35         -32.3%          916
3             10/ 15/ 2    SELL           5.66
----------------------------------------------------------------------------
4             11/ 13/ 2    BUY            7.04          24.7%          1125
4             1/ 6/ 3      SELL           8.78
----------------------------------------------------------------------------
5             1/ 22/ 3     BUY            7.8           81.2%          2017
5             10/ 15/ 3    SELL           14.14
----------------------------------------------------------------------------
6             11/ 3/ 3     BUY            14.3          20.6%          2392
6             2/ 11/ 4     SELL           17.25
----------------------------------------------------------------------------
7             5/ 18/ 4     BUY            13.14         29.3%          3047
7             9/ 2/ 4      SELL           17
----------------------------------------------------------------------------
8             10/ 14/ 4    BUY            18.3          20.1%          3601
8             12/ 28/ 4    SELL           21.99
----------------------------------------------------------------------------
9             4/ 21/ 5     BUY            22.45         106.9%         7379
9             5/ 5/ 6      SELL           46.45
---------------------------------------------------------------------------
10            6/ 15/ 6     BUY            35.35         10.6%          8018
10            6/ 30/ 6     SELL           39.12
---------------------------------------------------------------------------
11            7/ 18/ 6     BUY            36.8          20.8%          9529
11            1/ 5/ 7      SELL           44.47
----------------------------------------------------------------------------
12            3/ 2/ 7      BUY            43.84         55.6%          14639
12            7/ 17/ 7     SELL           68.22
----------------------------------------------------------------------------
13            9/ 25/ 7     BUY            71.25         10.5%          15897
13            10/ 15/ 7    SELL           78.8
----------------------------------------------------------------------------
14            11/ 14/ 7    BUY            83.85         2%             15901
14            12/ 6/ 7     SELL           85.55
----------------------------------------------------------------------------
15            3/ 7/ 8      BUY            80.78        -6.5%           14562
15            3/ 24/ 8     SELL           75.59
----------------------------------------------------------------------------
16            7/ 8/ 8      BUY            81.76        -2%             13993
16            7/ 23/ 8     SELL           80.2
----------------------------------------------------------------------------
17            9/ 15/ 8     BUY            57.8          8.9%           14960
17            9/ 22/ 8     SELL           62.95
----------------------------------------------------------------------------
18            10/ 8/ 8     BUY            37            2.2%           15000
18            10/ 21/ 8    SELL           37.84
----------------------------------------------------------------------------
19            11/ 21/ 8    BUY            29.36         37%            20264
19            1/ 6/ 9      SELL           40.25
----------------------------------------------------------------------------
20            1/ 21/ 9     BUY            35.14         2.2%           20314
20            1/ 29/ 9     SELL           35.93
----------------------------------------------------------------------------
21            2/ 17/ 9     BUY            36.4         -6.1%           18680
21            2/ 27/ 9     SELL           34.2
----------------------------------------------------------------------------
22            3/ 12/ 9     BUY            36.66         52.7%          28151
22            6/ 9/ 9      SELL           55.98
----------------------------------------------------------------------------
23            6/ 23/ 9     BUY            50.7          46.9%          40809
23            10/ 21/ 9    SELL           74.51
----------------------------------------------------------------------------
24            11/ 9/ 9     BUY            77.04        -2.7%           38891
24            11/ 13/ 9    SELL           74.96
----------------------------------------------------------------------------
25            1/ 22/ 10    BUY            67.97        -1.3%           37638
25            6/ 16/ 10    SELL           67.14
-----------------------------------------------------------------------------
26            6/ 30/ 10    BUY            61.83         27.1%        $47094
26            4/ 21/ 11    SELL           78.6
------------------------------------------------------------------------
                            N= 26  Avg.Gain= 21.2%   $1000 becomes  $47,094
Peerless Automatic Buys and Sells
Produce Very Big Profits
for A Trader of ILF, the ETF
for Latin American Stocks
2002-2011


ILF (Latin American ETF) 24 Peerless Trades since 2002,
Avg.Gain= 18.4%/trade
$1000 becomes $25,042 in 9 years
2002-2011
Trade Dates Signals ILF Pct. Gain $1000
Becomes
---------------------------------------------------------------------------------------------------------------------------------------------------------
1             7/ 24/ 2     BUY            7.43         -12.1%          859
1             10/ 15/ 2    SELL           6.534
2             11/ 13/ 2    BUY            6.938         12.5%          950
2             1/ 6/ 3      SELL           7.81
3             1/ 22/ 3     BUY            6.98          50.4%          1410
3             10/ 15/ 3    SELL           10.502
4             11/ 3/ 3     BUY            10.7          16.2%          1610
4             2/ 11/ 4     SELL           12.436
5             5/ 18/ 4     BUY            10.57         19%            1884
5             9/ 2/ 4      SELL           12.58
6             10/ 14/ 4    BUY            13.28         20%            2224
6             12/ 28/ 4    SELL           15.944
7             4/ 21/ 5     BUY            16.244        95%            4293
7             5/ 5/ 6      SELL           31.688
8             6/ 15/ 6     BUY            24.956        9.5%           4619
8             6/ 30/ 6     SELL           27.344
9             7/ 18/ 6     BUY            26.088        25.5%          5708
9             1/ 5/ 7      SELL           32.75
10            3/ 2/ 7      BUY            32.28         41.5%          7967
10            7/ 17/ 7     SELL           45.7
11            9/ 25/ 7     BUY            46.442        9.8%           8590
11            10/ 15/ 7    SELL           51
12            11/ 14/ 7    BUY            50.94         4.3%           8794
12            12/ 6/ 7     SELL           53.172
13            3/ 7/ 8      BUY            49.85        -2.2%           8431
13            3/ 24/ 8     SELL           48.79
14            7/ 8/ 8      BUY            50.98        -1.5%           8144
14            7/ 23/ 8     SELL           50.262
15            9/ 15/ 8     BUY            38.89         7.6%           8601
15            9/ 22/ 8     SELL           41.85
16            10/ 8/ 8     BUY            26.55         0%             8435
16            10/ 21/ 8    SELL           26.57
17            11/ 21/ 8    BUY            21.56         34%            11138
17            1/ 6/ 9      SELL           28.9
18            1/ 21/ 9     BUY            24.95         1.2%           11049
18            1/ 29/ 9     SELL           25.25
19            2/ 17/ 9     BUY            25.1         -6.9%           10076
19            2/ 27/ 9     SELL           23.39
20            3/ 12/ 9     BUY            24.94         44.5%          14363
20            6/ 9/ 9      SELL           36.05
21            6/ 23/ 9     BUY            33.08         41.2%          19993
21            10/ 21/ 9    SELL           46.71
22            11/ 9/ 9     BUY            47.78        -1.2%           19368
22            11/ 13/ 9    SELL           47.24
23            1/ 22/ 10    BUY            44.33         2.5%           19478
23            6/ 16/ 10    SELL           45.47
24            6/ 30/ 10    BUY            41.42         30.5%         $25,042
24            4/ 21/ 11    SELL           54.08
------------------------------------------------------------------------
     N= 24     Avg.Gain= 18.4%/Trade     $1000 becomes  $25,042
BRAZIL ETF - EWZ - 2006
Peerless Buys and Sells Superimoposed.

Brazil ETFs
- iShares MSCI Brazil ETF (EWZ). EWZ is the largest non-U.S. single-country ETF with $9 billion in assets under management. The fund covers mostly large-cap stocks and includes some of Brazil’s most prominent name brands.
- Global X Brazil Mid Cap ETF (BRAZ). Recently launched, BRAZ is the first ETF that tracks mid-cap Brazilian companies. Mid-caps are focused on internal consumption, whereas large-caps have more ties with the global economy.
- Market Vectors Brazil Small-Cap ETF (BRF).
Brazil’s small-caps have proved to be steady and substantial performers while the
global markets faltered with recent short-term events. BRF has a 30% weighting in the
consumer sector and less than 1% in energy. The composition of BRF is a stark contrast to
EWZ.
- EGS INDXX Brazil Infrastructure ETF (BRXX). BRXX includes 30 stocks that are involved in the development and maintenance of Brazil’s infrastructure.
- ProShares Ultra MSCI Brazil (UBR). UBR “seeks daily investment results, before fees and expanses, that correspond to 200% of the daily performance of the MSCI Brazil Index.”
- ProShares UltraShort MSCI Brazil (BZQ). BZQ is a 200% inverse ETF. It should be noted that the fund is best used for short-term moves and tracks the daily movements of the underlying index.
Latin American ETF - EWZ - 2003
Peerless Buys and Sells Superimoposed.


Save The Amazon Jungle


