wpe15E.jpg (1914 bytes)  TigerSoft New Service    TigerSoft Blog  - 5/17/2009/Updated 4/25/2011

              PROFITABLY TRADING MEXICAN STOCKS
                                             35 Peerless Trades since 1996,   
                                  Avg.Gain= 17.7%/trade  
                                $1000 becomes  $99947.


                    wpe1B4.jpg (32206 bytes)
                          

    PROFITABLY TRADING MEXICAN STOCKS WITH
  (1) PEERLESS STOCK MARKET TIMINg: 1915-2011
               
35 Trades since 1996, Avg.Gain= 17.7%/trade   
                                              $1000 becomes  $99947.

             (2) TIGERSOFT's MEASURES OF
         INSIDER BUYING & INSIDER SELLING


wpe1969.jpg (33120 bytes)
                                              
                           
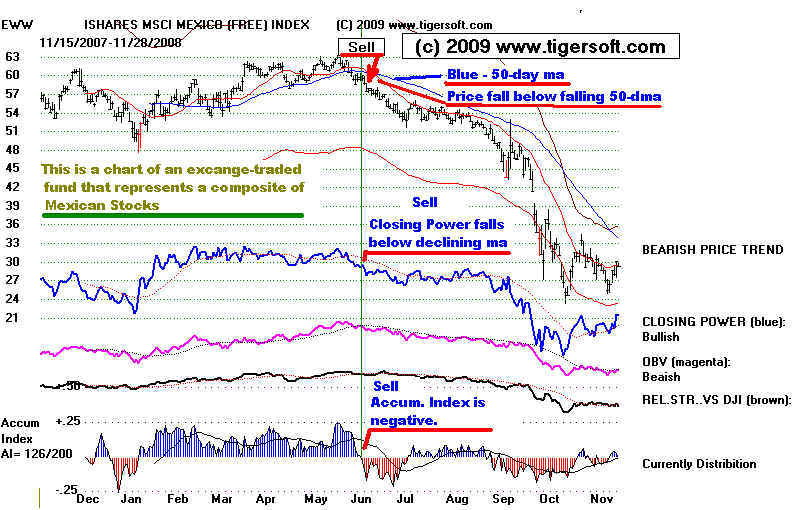
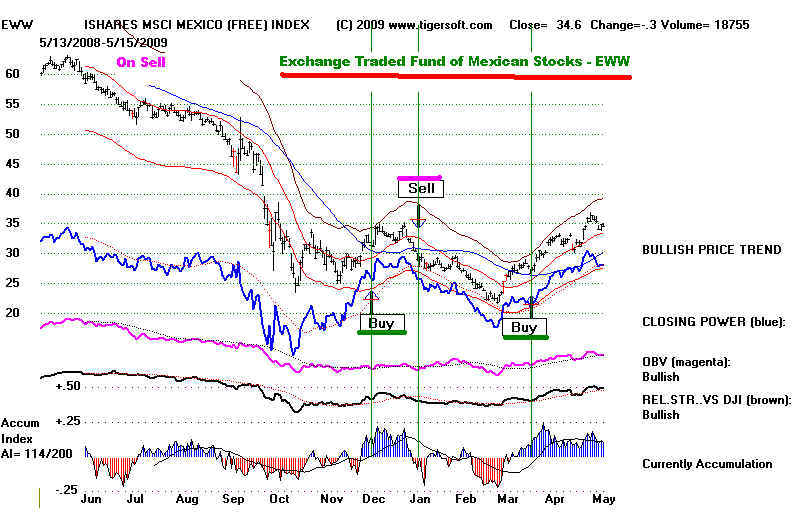
The simplest way to make money in Mexican stocks is to super-impose
                     the Peerless Buys and Sells from the Dow Jones Industrial Average onto
                     a Mexican Exchange Traded Fund, such as EWW, which acts like a mutual
                     fund for Mexican stocks.  Its Buys and Sell work very well because of integrated
                     financial markets are around the world.


wpe15E.jpg (76607 bytes)


             Peerless Automatic Buys and Sells
                   Produce "Mas Grande" Profits
          for A Trader of EWW, the ETF for Mexico

                                           1996-2011

Trade                   Dates                  Signals                      EWW                    Gain                 $1000
                                                                                                                                         Becomes
-----------------------------------------------------------------------------------------------------------------------------------------------------------
1             4/ 10/ 96    BUY            10.75         10.9%          1089 
1             5/ 29/ 96    SELL           11.93
------------------------------------------------------------------------------
2             7/ 11/ 96    BUY            10.62         20.6%          1292 
2             4/ 22/ 97    SELL           12.81
-----------------------------------------------------------------------------
3             5/ 9/ 97     BUY            13            27.3%          1620 
3             9/ 18/ 97    SELL           16.56
-----------------------------------------------------------------------------
4             10/ 28/ 97   BUY            14.75         8%             1718 
4             4/ 21/ 98    SELL           15.93
----------------------------------------------------------------------------
5             10/ 1/ 98    BUY            8.68          72.8%          2934 
5             6/ 18/ 99    SELL           15
----------------------------------------------------------------------------
6             10/ 4/ 99    BUY            12.87         34.9%          3902 
6             12/ 10/ 99   SELL           17.37
----------------------------------------------------------------------------
7             2/ 4/ 0      BUY            18.12        -8.3%           3501 
7             4/ 25/ 0     SELL           16.62
-----------------------------------------------------------------------------
8             5/ 3/ 0      BUY            15.56         7.1%           3683 
8             9/ 6/ 0      SELL           16.68
-----------------------------------------------------------------------------
9             10/ 20/ 0    BUY            14.43         0%             3609 
9             12/ 8/ 0     SELL           14.43
-----------------------------------------------------------------------------
10            3/ 23/ 1     BUY            13.3          22.1%          4337 
10            5/ 17/ 1     SELL           16.25
-----------------------------------------------------------------------------
11            9/ 19/ 1     BUY            12.15         29.8%          5546 
11            2/ 26/ 2     SELL           15.78
-----------------------------------------------------------------------------
12            7/ 24/ 2     BUY            13.61        -3.1%           5268 
12            10/ 15/ 2    SELL           13.2
-----------------------------------------------------------------------------
13            11/ 13/ 2    BUY            12.4          6.4%           5503 
13            1/ 6/ 3      SELL           13.2
-----------------------------------------------------------------------------
14            1/ 22/ 3     BUY            12.29         24.5%          6745 
14            10/ 15/ 3    SELL           15.31
----------------------------------------------------------------------------
15            11/ 3/ 3     BUY            16.41         18%            7827 
15            2/ 11/ 4     SELL           19.37
----------------------------------------------------------------------------
16            5/ 18/ 4     BUY            18.27         6.4%           8176 
16            9/ 2/ 4      SELL           19.45
----------------------------------------------------------------------------
17            10/ 14/ 4    BUY            20.32         22.3%          9844 
17            12/ 28/ 4    SELL           24.87
-----------------------------------------------------------------------------
18            4/ 21/ 5     BUY            23.36         82.5%          17776 
18            5/ 5/ 6      SELL           42.65
-----------------------------------------------------------------------------
19            6/ 15/ 6     BUY            34.23         8.5%           18936 
19            6/ 30/ 6     SELL           37.15
-----------------------------------------------------------------------------
20            7/ 18/ 6     BUY            37.38         33.8%          24976 
20            1/ 5/ 7      SELL           50.05
------------------------------------------------------------------------------
21            3/ 2/ 7      BUY            49.15         28.4%          31581 
21            7/ 17/ 7     SELL           63.13
----------------------------------------------------------------------------
22            9/ 25/ 7     BUY            57.79         8.5%           33655 
22            10/ 15/ 7    SELL           62.74
-----------------------------------------------------------------------------
23            11/ 14/ 7    BUY            56.8          6.6%           35227 
23            12/ 6/ 7     SELL           60.59
-----------------------------------------------------------------------------
24            3/ 7/ 8      BUY            54.11         6.2%           36710 
24            3/ 24/ 8     SELL           57.47
-----------------------------------------------------------------------------
25            7/ 8/ 8      BUY            55.35        -1%             35624 
25            7/ 23/ 8     SELL           54.82
-----------------------------------------------------------------------------
26            9/ 15/ 8     BUY            46.18         3.3%           36092 
26            9/ 22/ 8     SELL           47.71
-----------------------------------------------------------------------------
27            10/ 8/ 8     BUY            33.86        -8.1%           32460 
27            10/ 21/ 8    SELL           31.13
-----------------------------------------------------------------------------
28            11/ 21/ 8    BUY            26.37         31.2%          41954 
28            1/ 6/ 9      SELL           34.61
-----------------------------------------------------------------------------
29            1/ 21/ 9     BUY            28.43        -1.1%           40673 
29            1/ 29/ 9     SELL           28.13
-----------------------------------------------------------------------------
30            2/ 17/ 9     BUY            26.34        -9.4%           36061 
30            2/ 27/ 9     SELL           23.88
-----------------------------------------------------------------------------
31            3/ 12/ 9     BUY            25.25         45.6%          51806 
31            6/ 9/ 9      SELL           36.78
-----------------------------------------------------------------------------
32            6/ 23/ 9     BUY            34.77         37.9%          70408 
32            10/ 21/ 9    SELL           47.95
-----------------------------------------------------------------------------
33            11/ 9/ 9     BUY            46.82         1.9%           70398 
33            11/ 13/ 9    SELL           47.75
-----------------------------------------------------------------------------
34            1/ 22/ 10    BUY            47.28         10.2%          76227 
34            6/ 16/ 10    SELL           52.14
-----------------------------------------------------------------------------
35            6/ 30/ 10    BUY            47.89         33.1%        $99,946 
35            4/ 21/ 11    SELL           63.75
=============================================================================
          N= 35  Avg.Gain= 17.7%/trade   $1000 becomes  $99,947.


A second way to make money investing in Mexican stocks is to use
                  TigerSoft's measures of insider and professional buying and buy and
                   sell what and when they do.

                                               INSIDER BUYING AND SELLING

             TigerSoft specializes in watching and flagging significant insider trading.

           
Insider Buying and Selling in Mexican stocks is as real, ubiquitous and ever-present
             as It is in the United States, or anywhere else in the world.  Someone always knows
             first and acts to profit from what they know.  They invite their friends and business
             partners to take advantage of what they know.  Professionals then manipulate prices
             to meet the needs of these insiders.

             TigerSoft has pioneered ways to track insider trading, so that investors can have an equal
             chance to make money in the stock market.  See some of the Blogs I have written about
             insider buying and insider selling.  Some of the many links are shown below. 

             The stock trading approach here is one we long advocated.  It first appeared in our
             Software's Help Routines in the early 1990s.  We suggest you visit some of the other
             TigerSoft pages shown below and look at the 10 year trading history of some of these
             Mexican stocks, which will appear here in a few days.   We start with EWW, which is
             a heavily traded Exchange Traded Fund representing Mexican Stocks.

        
                          Rallies in EWW: 1997-2009: Buy Signals using rules below.
                          Spotting tops in EWW: 1997-2009: Using TigerSoft.

              William Schmidt, Tiger Software's Creator (C) 2009 William Schmidt, Ph. D.
                                                               All Rights Reserved.  
        

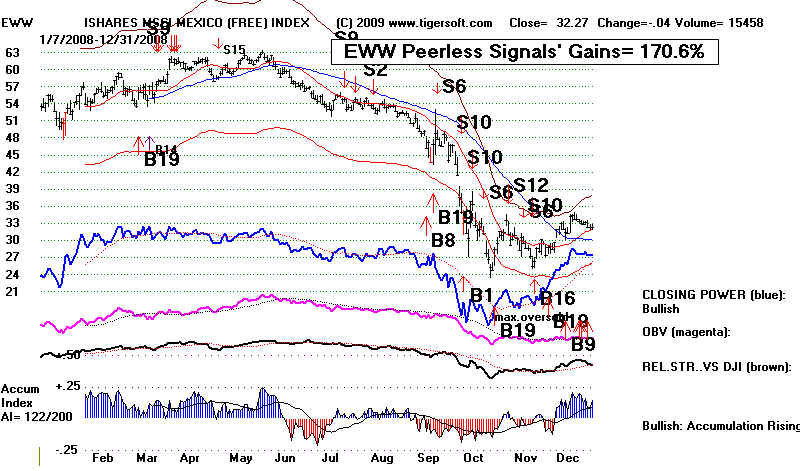
                   Visit www.tigersoft.com where we watch Wall Street Insiders' Buying and Selling because it
               helps predict stock prices and the SEC offers little protection for investors from Insider and
               Professional price manipulations and predations.


                 See other TigerSoft materials on insider trading:
                 Insider Trading as Measured by TigerSoft
               
The Confirmed Trend Is Your Friend
                
Basic TigerSoft's Rules for Profitably Trading Stocks and Limiting Risks.
                
How To Know When To Sell Stocks and When To Buy Safely and ...


                                PROFITABLE TRADING OF
         MEXICAN STOCKS WITH TIGERSOFT


              Stock markets are much the same everywhere in the world.  Insiders buy and sell
         stock shares before important news is divulged to the general public.  At the same time,
         professionals rig markets to their own advantage.  The working people on the outside
         are typically the last to know the news that dramatically affects the prices of their stocks. 

             Interstingly, iIn Spanish, there seems to be no word for "insider trading".  We will
         have to invent one.

             TigerSoft advises clients to approach the market very simply.  First. look at a yearly
         price chart to see if the current price is above or below a 50-day moving average.   We like
         to use 50 days, because it tests well in most markets.  If prices are above a rising 50-day
         ma, many traders consider the trend to be rising or bullish.  If prices are below a falling
         50-day ma, then the trend is consider down and bearish.  Unfortunately, this is too simple.
         There  are times when prices are whipped above and below the 50-day ma and a series of
         small losses then may follow. 

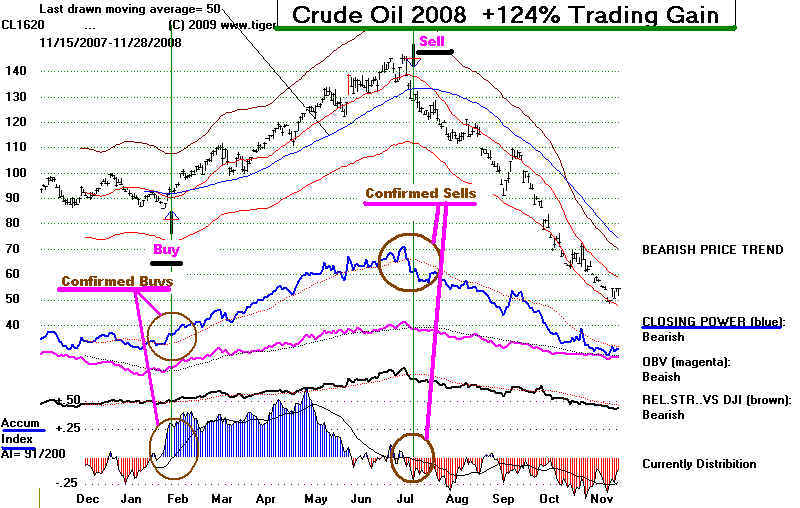
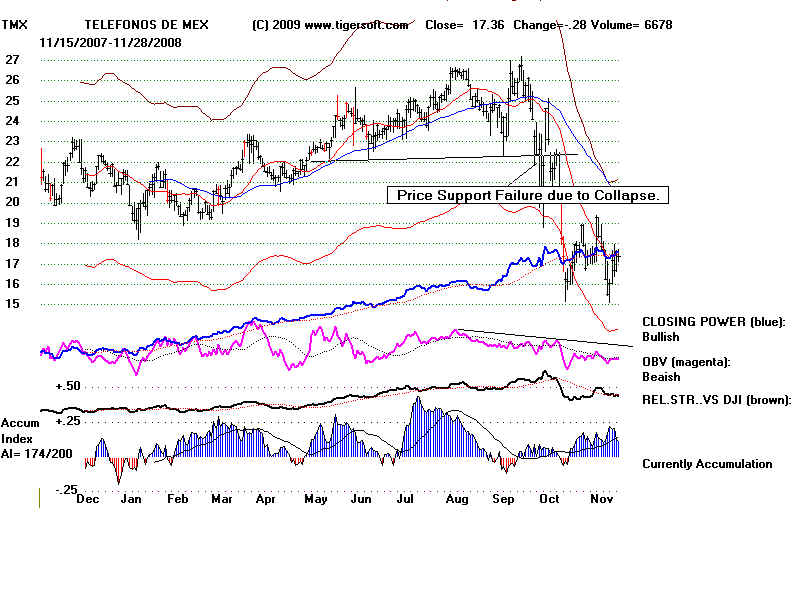
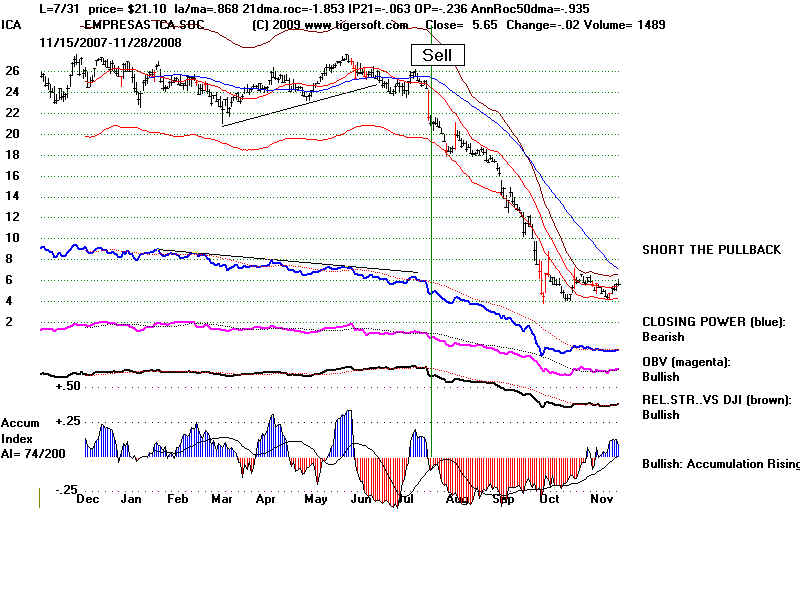
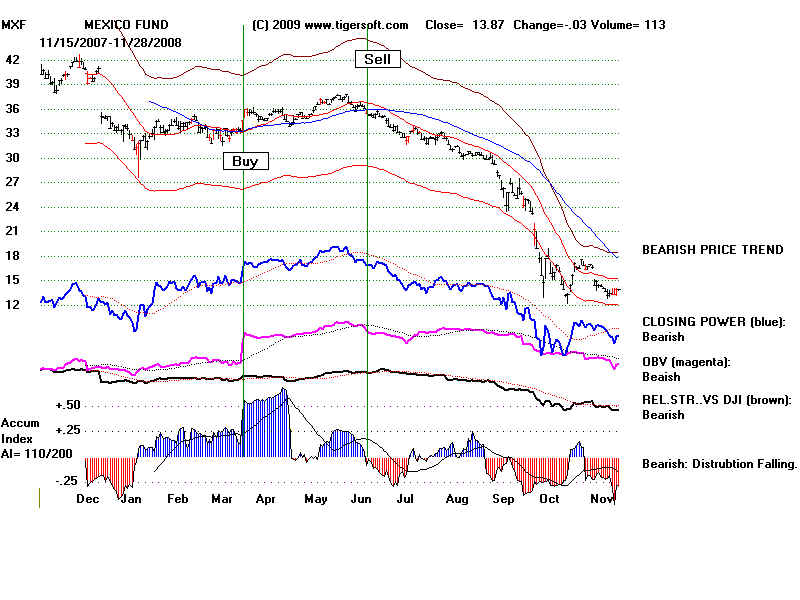
             To prevent such whipsaws, TigerSoft has created two new measures of insider buying or
         selling, to confirm price moves above or below the 50-day ma.  These are TigerSoft's
         proprietary Closing Power and Accumulation Index,  Both indicators are normally required to
         confirm a price move above or below its 50-day ma.

              TigerSoft's Closing Power is our way of measuring Professional and Institutional Buying and Selling.  
         When this indicator is rising and above its own moving average, the Closing Power can confirm
         a move by prices above its 50-day ma.   When Closing Power is falling and is below its own
         moving average, a move by the stock below its falling 50-day ma  is considered confirmed and
         much more bearish.

               TigerSoft's Accumulation Index is our way of measuring Professional and Institutional Buying
        and Selling.  When this indicator is rising and above its own moving average, the Accumulation
        Index can confirm a move by prices above its 50-day ma.  When the Accumulation Index is falling
        and is below its own moving average, a move by the stock below its falling 50-day ma is considered
        confirmed and much more bearish.

             You can readily see this in work in 2008 and 2009.  Look first at Crude Oil. (Commodity Contract)

wpe162.jpg (82190 bytes)                    
          .
                                                  Crude Oil 2008-2009
          chart to be shown here.
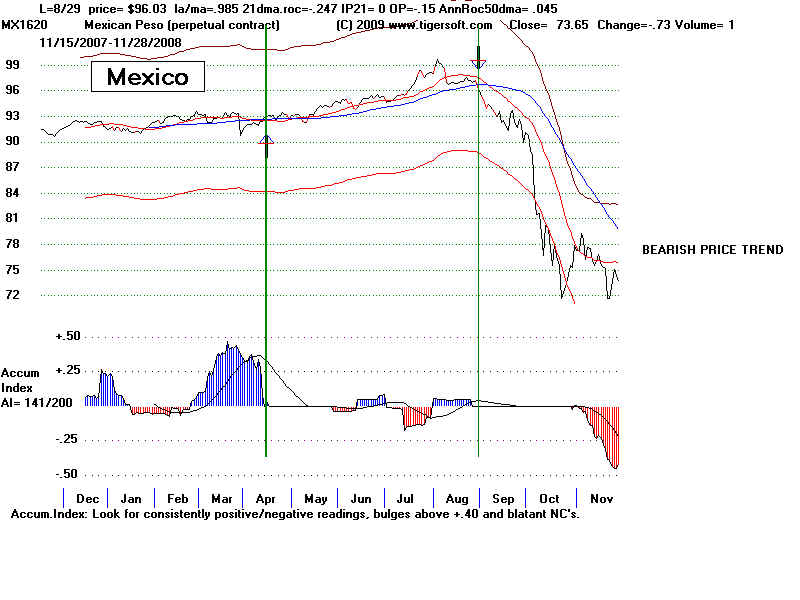
                                 Funds of Mexican Stocks

wpe163.jpg (84886 bytes)


wpe164.jpg (73412 bytes)
    More examples
                                                                              Mexican Peso
PESO2008.BMP (960054 bytes)


TMX08.BMP (960054 bytes)

ICA.BMP (960054 bytes)

MXF08.BMP (960054 bytes)
wpe1BB.jpg (59452 bytes)
wpe1B6.jpg (57320 bytes)
wpe1B5.jpg (42676 bytes)
wpe1B7.jpg (28781 bytes)
wpe1B8.jpg (47946 bytes)
wpe1BC.jpg (37730 bytes)
 

wpe1BD.jpg (4731 bytes)wpe1BE.jpg (10816 bytes)wpe1BF.jpg (9981 bytes) wpe1C2.jpg (3344 bytes)wpe1C0.jpg (48928 bytes)