with TigerSoft's Peerless System since 1993.
www.tigersoft.com (C) 2010 William Schmidt, Ph.D.
Updated through 4/14/2010

www.tigersoft.com "Where Everyone Gets Personal Service."
PO Box 9491 San Diego, CA 92169 858-273-5900 william_schmidt@hotmail.com Testimonials About Us
Is market still safe? Peerless Stock Market Timing: DJIA-1915-2010
Peerless Buys/Sells +30% Annualized Return on SPY since 1993.
+42.4% Gain since May 2009 (long only)
Real-Time Track Record since Start of Peerless in 1981
What stocks are best? ETFs Blue Chips. Explosive Super Stocks Killer Short Sales.
Are Buy and Sell Signals Automatic? YES - and Extensively Back-Tested.
How Do You Track Unofficial Insider Buying/Selling? TigerSoft's Accumulation Index and Closing Power
-----------------------------------------------------------------------------------------------------------------------------
Tiger's Peerless Results Trading SPY:
1993-2010
62 positive gain quarters
5 losing quarters, biggest loss was 4.5% in First Quarter of 2002.
Every year showed a gain. 4 years showed gains greater than 60%
Yearly Gain Biggest Monthly Biggest
Quarterly
Loss
Loss
1993 +4.9%
-2.6%
- .3%
1994 +28.1%
-2.9%
-1.8%
1995 +34.9%
-0.3%
none
1996 +26.1%
-5.4%
none
1997 +18.1%
-5.2%
none
1998 +60.6%
-6.0%
none
1999 +24.0%
-3.2%
none
2000 +21.0%
-7.5%
-1.7%
2001 +62.1%
-4.4%
none
2002 +35.1%
-6.1%
-4.5%
2003 +34.7%
-1.5%
none
2004 +17.9%
-3.2%
-2.4%
2005 +11.9%
-2.4%
none
2006 +32.4%
none
none
2007 +44.7%
-2.8%
none
2008 +82.1%
-4.8%
none
2009 +60.3%
-3.1%
none
2010
+5.0% to date
See
more details below
=====================================================================================
We contstantly compare earlier markets
with the presents. Compare the bullish
take-off in August 1982 with the market's boom after March 2009.
1982-1983
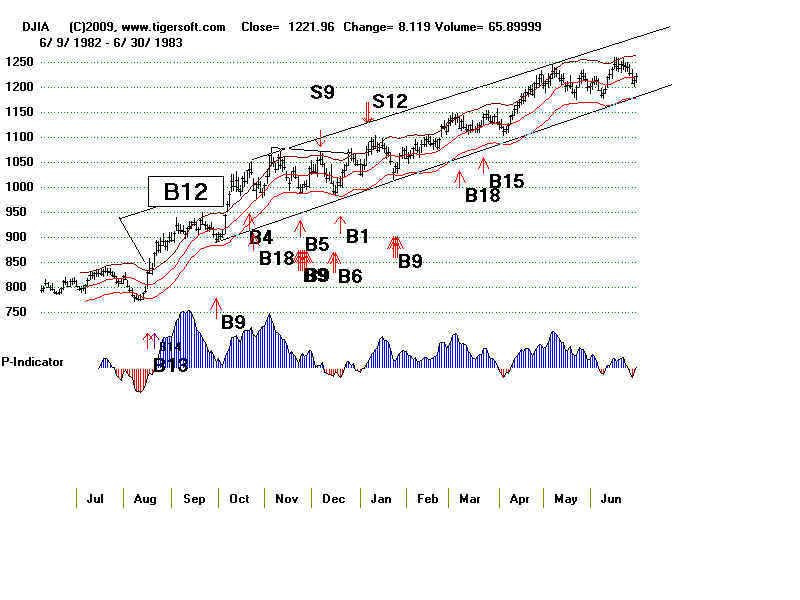
2009-2010
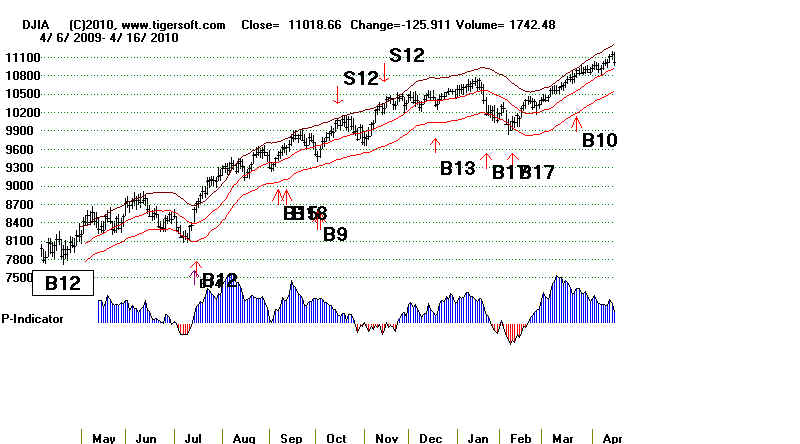
====================================================================================
DETAILS OF PEERLESS ON SPY: 1993-2010
Results:
62 positive gain quarters
5 losing quarters, biggest loss was 4.5% in First Quarter of 2002.
Every year showed a gain. 4 years showed gains greater than 60%
Yearly Gain Biggest Monthly Biggest
Quarterly
Loss
Loss
1993 +4.9%
-2.6%
- .3%
1994 +28.1%
-2.9%
-1.8%
1995 +34.9%
-0.3%
none
1996 +26.1%
-5.4%
none
1997 +18.1%
-5.2%
none
1998 +60.6%
-6.0%
none
1999 +24.0%
-3.2%
none
2000 +21.0%
-7.5%
-1.7%
2001 +62.1%
-4.4%
none
2002 +35.1%
-6.1%
-4.5%
2003 +34.7%
-1.5%
none
2004 +17.9%
-3.2%
-2.4%
2005 +11.9%
-2.4%
none
2006 +32.4%
none
none
2007 +44.7%
-2.8%
none
2008 +82.1%
-4.8%
none
2009 +60.3%
-3.1%
none
2010
+5.0% to date
:
Rules:
>The Peerless signals are based on the DJIA, not the SP-500.
>Occasionally, DIA, QQQQ or IWM are better used than SPY.
>Most but not all of these are trades from real-time signals.
>Some of the reversals were called more accurately on our
Nightly Hotline where TIgerSoft's Closing Power was also used
for purposes of trading shorter-term.
>Next Day's Openings after a reversing Peerless signal
were used for calculating Trades' Prices.
>.2% Commission and Slippage used per Trade
> SPY Dividends ranging from 1.5% to 3%/year are not included.
Including them usually would have helped our trading results,
though in some cases, we were short the SPY when the
dividends were paid. Usually they were paid out between
the 17th and 21st of the month.
> Money Management Fees that might
be charged by a professional adviser are not included.
fPeerless Stock Market Timing:
1915-2010
These
are returns from current Peerless System, as optimized for
period 1928-2010. The basics of the Peerless system have
been used
since 1981, which grew out of a published and nationally
advertised
study of market data from 1972-1981. In 1991, Tiger's
Windows-Peerless
was offered for the first time using back data to 1965.
Peerless was
optimized in 2008 after close examination of data back to 1928.
This was
just in time for us to deal near perfectly with the Crash of
2008. the
bottom of March 2009 and then the subsequent recovery.
That was
because the 2008-2009 bear market behaved more like the extreme
bear markets of 1929-1933 and 1937-1938 than any period since
then.
Studying past history has made all the difference.
A few other retrospective changes to Peerless have been made
since 2008.
These were made because such changes were discovered to to be
more consistent with all the back data. The most
important such
discovery was made for 1937, 1967 and 1999, by taking into
account
the 4-year Presidential cycle. Only by studying data back
to 1915, did
we have the confidence statistically to reach such
conclusions. The
Peerless manual for 1915-2010 details these revisions.
See also "The
History of Peerless Stock Market Timing: 1981-2010"
              Monthly/Quarterly/Year Gains Trading SPY
                                     with Peerless System since 1993.

              Example of gains: A Gain of .062 = 6.2% Gain
     Dates      Quarterly    SPY          Account       Monthly    Yearly
                Gain                                    Gain       Gain
---------------------------------------------------------------------------------
1993
     2/1/1993 (long)         44.40         10000 after commissions.
     end of Feb              44.41         10002         .0
     end of Mar              45.19         10178         .018
                 .018
     end of Apr              44.03         9917         -.026
     end of May              45.22         10185         .027
     end of Jun              46.06         10374         .019
                 .019
     end of Jul              44.84         10099        -.026
     end of Aug              46.56         10486         .038
     end of Sep              45.94         10347        -.013
                -.003
     end of Oct              46.84         10550         .02
     end of Nov              46.34         10437        -.011
     end of Dec              46.59         10493         .005
                 .014                                           +.049
--------------------------------------------------------------------------------------
1994
     end of Jan              48.22         10860         .035
     end of Feb              46.81         11084         .021
     end of Mar              44.59         11609         .047
                 .106
     end of Apr              45.09         11564        -.004
     end of May              45.81         11749         .016
     end of Jun              44.47         11405        -.029
                -.018
     end of Jul              45.91         11775         .032
     end of Aug              47.66         12220         .038
     end of Sep              46.17         12602         .031
                 .105
     end of Oct              47.48         12881         .022
     end of Nov              45.59         13447         .044
     end of Dec              45.56         13438        -.001
                 .066                                          +.281
----------------------------------------------------------------------------------
1995
     end of Jan              47.09         13889         .034
     end of Feb              49.02         14459         .041
     end of Mar              50.11         14780         .022
                 .100
     end of Apr              51.59         15217         .03
     end of May              53.64         15821         .04
     end of Jun              54.41         16048         .014
                 .086
     end of Jul              56.16         16565         .032
     end of Aug              56.41         16638         .004
     end of Sep              58.48         17249         .037
                 .075
     end of Oct              58.31         17199        -.003
     end of Nov              60.91         17966         .045
     end of Dec              61.48         18134         .009
                 .051                                          +.349
----------------------------------------------------------------------------------
1996
     end of Jan              63.67         18780         .036
     end of Feb              63.88         19647         .046
     end of Mar              64.69         19398        -.013
                 .070
     end of Apr              65.39         20517         .058
     end of May              66.87         20985         .023
     end of Jun              67.11         20909        -.004
                 .078
     end of Jul              64.09         21466         .027
     end of Aug              65.33         22454         .046
     end of Sep              68.62         21252        -.054
                 .016
     end of Oct              70.84         21940         .032
     end of Nov              76.02         23544         .073
     end of Dec              73.84         22869        -.029
                 .076                                         +.261
--------------------------------------------------------------------------------------
1997
     end of Jan              78.41         24284         .062
     end of Feb              79.16         24516         .01
     end of Mar              75.37         23343        -.048
                 .021
     end of Apr              80.09         23254        -.004
     end of May              85.16         22979        -.012
     end of Jun              88.31         23829         .037
                 .021
     end of Jul              95.31         25718         .079
     end of Aug              90.37         24385        -.052
     end of Sep              94.37         25572         .049
                 .073
     end of Oct              92.06         25904         .013
     end of Nov              95.62         27416         .058
     end of Dec              97.06         27016        -.015
                 .056                                         +.181
-------------------------------------------------------------------------------------
1998
     end of Jan              98.31         27364         .013
     end of Feb             105.12        29259         .069
     end of Mar             109.94        30601         .046
                 .133
     end of Apr             111.34        31780         .039
     end of May             109.03        32440         .021
     end of Jun             113.31        31166        -.039
                 .018
     end of Jul             111.78        31587         .014
     end of Aug              96.00        36046         .141
     end of Sep             101.75        33887        -.06
                 .087
     end of Oct             110           38694         .142
     end of Nov             116.12        40846         .056
     end of Dec             123.31        43376         .062
                 .280                                        +.606
--------------------------------------------------------------------------------------
1999
     end of Jan             127.66        44906         .035
     end of Feb             123.56        43463        -.032
     end of Mar             128.38        45159         .039
                 .041
     end of Apr             133.25        46872         .038
     end of May             130.2         45799        -.023
     end of Jun             137           46321         .011
                 .026
     end of Jul             132.75        47758         .031
     end of Aug             132.06        49238         .005
     end of Sep             128.75        49197         .025
                 .062
     end of Oct             137           50669         .03
     end of Nov             139.28        51512         .017
     end of Dec             146.88        53799         .044
                 .094                                       +.24
-----------------------------------------------------------------------------------
2000
     end of Jan             139.56        56480         .05
     end of Feb             137.44        53172        -.059
     end of Mar             150.38        58178         .094
                 .081
     end of Apr             145.09        64667         .112
     end of May             142.81        63651        -.016
     end of Jun             145.28        64752         .017
                 .113
     end of Jul             143           70401         .087
     end of Aug             152.34        65803        -.065
     end of Sep             143.63        69565         .057
                 .074
     end of Oct             142.95        68236        -.019
     end of Nov             132.28        63143        -.075
     end of Dec             131.19        68400         .083
                 -.017                                      +.271
-----------------------------------------------------------------------------------
2001
     end of Jan             137.02        65360        -.044
     end of Feb             123.95        71595         .095
     end of Mar             116.69        76869         .074
                 .124
     end of Apr             126.66        75782        -.014
     end of May             125.95        78959         .042
     end of Jun             122.6         81059         .027
                 .055
     end of Jul             121.35        81886         .01
     end of Aug             114.15        86744         .059
     end of Sep             104.44        100924        .163
                 .245
     end of Oct             105.8         108118        .071
     end of Nov             114.05        110646        .023
     end of Dec             114.3         110889        .002
                 .099                                        +.621
------------------------------------------------------------------------------------
2002
     end of Jan             113.18        109802       -.01
     end of Feb             111.15        109183       -.006
     end of Mar             114.52        105873       -.03 |
                -.045
     end of Apr             107.86        112030        .058
     end of May             107.22        112695        .006
     end of Jun              98.96         121377        .077
                 .146
     end of Jul              91.16         150529        .24
     end of Aug              91.78         145709       -.032
     end of Sep              81.79         138871       -.047
                 .144
     end of Oct              88.52         150297        .082
     end of Nov              93.98         159568        .062
     end of Dec              88.23         149805       -.061
                 .079                                         +.351
-----------------------------------------------------------------------------------
2003
     end of Jan              86.06         159177        .063
     end of Feb              84.09         155533       -.023
     end of Mar              84.74         156736        .008
                 .046
     end of Apr              91.91         169997        .085
     end of May              96.95         179319        .055
     end of Jun              97.63         180577        .007
                 .152
     end of Jul              99.03         183166        .014
     end of Aug             101.44        187624        .024
     end of Sep              99.95         184868       -.015
                 .024
     end of Oct             105.3         192102        .039
     end of Nov             106.45        191286       -.004
     end of Dec             112.28        201762        .055
                 .091                                        +.347
-----------------------------------------------------------------------------------
2004
     end of Jan             113.48        203919        .011
     end of Feb             115.02        209689        .028
     end of Mar             108.85        220937        .054
                 .095
     end of Apr             110.96        216655       -.019
     end of May             112.86        221757        .024
     end of Jun             114.53        225038        .015
                 .019
     end of Jul             110.84        217787       -.032
     end of Aug             111.11        218318        .002
     end of Sep             111.76        219595        .006
                -.024
     end of Oct             113.2         222425        .013
     end of Nov             117.89        231640        .041
     end of Dec             120.87        237856        .027
                 +.083                                       +.179
-----------------------------------------------------------------------------------
2005
     end of Jan             118.16        243189        .022
     end of Feb             120.63        238106       -.021
     end of Mar             117.96        243376        .022
                 +.023
     end of Apr             115.75        247491        .017
     end of May             119.46        255423        .032
     end of Jun             119.18        254825       -.002
                 +.047
     end of Jul             123.74        264575        .038
     end of Aug             122.58        262094       -.009
     end of Sep             123.04        263078        .004
                 +.032
     end of Oct             120.13        256856       -.024
     end of Nov             125.41        268145        .044
     end of Dec             124.51        266221       -.007
                 +.012                                       +.119
------------------------------------------------------------------------------------
2006
     end of Jan             127.5         272614        .024
     end of Feb             128.23        274175        .006
     end of Mar             129.83        277465        .012
     end of Apr             131.47        281072        .013
     end of May             127.51        293049        .042
     end of Jun             127.28        302408        .032
                 +.103
     end of Jul             127.85        318306        .053
     end of Aug             130.64        325252        .022
     end of Sep             133.58        332572        .023
                 +.10
     end of Oct             137.79        343053        .032
     end of Nov             140.53        349875        .02
     end of Dec             141.62        352589        .008
                 +.06                                        +.324
------------------------------------------------------------------------------------
2007
     end of Jan             143.75        342612       -.028
     end of Feb             140.93        349333        .02
     end of Mar             142           366577        .049
                 +.04
     end of Apr             148.29        382815        .044
     end of May             153.32        395800        .034
     end of Jun             150.43        388340       -.019
                 +.059
     end of Jul             145.72        419299        .08
     end of Aug             145.79        420217        .002
     end of Sep             152.58        439788        .047
                 +.132
     end of Oct             154.65        449137        .021
     end of Nov             148.66        478431        .065
     end of Dec             143.96        510318        .067
                 +.160                                      +.447
------------------------------------------------------------------------------------
2008
     end of Jan             137.37        533678        .046
     end of Feb             133.82        547470        .026
     end of Mar             131.97        595786        .088
                 +.167
     end of Apr             138.26        567389       -.048
     end of May             140.35        558812       -.015
     end of Jun             127.98        608064        .088
                 +.021
     end of Jul             128.63        604976       -.005
     end of Aug             128.79        604223       -.001
     end of Sep             115.79        704875        .167
                 +.159
     end of Oct              96.83         766233        .087
     end of Nov              90.09         927605        .211
     end of Dec              90.24         929149        .002
                 +.318                                       +.821
------------------------------------------------------------------------------------
2009
     end of Jan              82.83         895222       -.037
     end of Feb              73.93         991412        .107
     end of Mar              79.52         1097061       .107
                 +.181
     end of Apr              87.42         1093186      -.004
     end of May              92.53         1157087       .058
     end of Jun              91.95         1280606       .107
                 +.167
     end of Jul              98.81         1376147       .075
     end of Aug             102.46        1426981       .037
     end of Sep             105.59        1470573       .031
                 +.148
     end of Oct             103.56        1442301      -.019
     end of Nov             109.94        1479574       .026
     end of Dec             111.44        1489691       .007
                 +.013                                        +.603
------------------------------------------------------------------------------------
2010
     end of Jan             107.39        1435552      -.036
     end of Feb             104.52        1397187      -.027
     end of Mar             117           1564015       .119
                 +.05