
TigerSoft News Service 4/3/2008 www.tigersoft.com
SPOT BLATANT NON-CONFIRMATIONS
AT THE UPPER and LOWER BANDS
TO MAKE MONEY IN THE STOCK MARKET
Watch what the Insiders Are Doing,
Don't Listen To What They Are Saying,
by William Schmidt, Ph.D. (Columbia University)
(C) 2008 All rights reserved. Reproducing any part of this page without
giving full acknowledgement is a copyright infringement.
Research on Individual Stocks upon Request:
Composite Seasonality Graph of Any Stock for $125.
Example of historical research NEM - Newmont Mining. Order Here.
 |
Tiger
Software Helping Investors since 1981
|
SPOT BLATANT NON-CONFIRMATIONS
AND MAKE MONEY IN THE STOCK MARKET
Watch what the Insiders Are Doing,
Don't Listen To What They Are Saying
by William Schmidt, Ph.D
For 25 years I have been sharing a simple but effective way to see what insiders are doing
with their own money and discount heavily what they say, because it is always self-serving and
too often false or misleading. It's simple. But you have to have TigerSoft to make use of it.
It simply uuses bands which our programs automatically set and the Tiger Accumulation Index,
which I invented in 1981. I mentioned the related TigerSoft S9 Sell concept on 7/9/2007 here in
connection with making profitable short sales two weeks before the market made a major top
last year. Distrusting CEOs and being wary of insider trading are never-ceasing themes
on these pages.
Here we take up two basic principles to good trading that TigerSoft originated in 1981..
NEGATIVE NON-CONFIRMATION (Sell)
When the stock reaches the upper band and the Accumulation Index is negative, SELL.
POSITIVE NON-CONFIRMATION (Buy)
When the stock reaches the lower band and the Accumulation Index is positive, BUY.
This does not always work. But it usually does. The main problem is that we don't
always see these blantant non-confirmations, positive and negative. Our TigerSoft Power-Ranking
programs flags these opportunity trades from all stocks automatically.
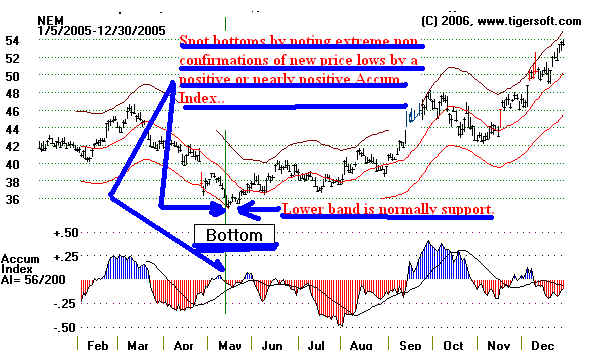
Take a sample stock. Newmont Mines - a major gold stock. In May 2005, NEM fell
to the lower band at 35 witht he Tiger Accumulation Index very nearly positive. That was a major
BUY. In Novermber, it hit 50 with the Accumulation Index only slightly positive. That would
have been a reasonable place to sell, but the move past 50 was historic. So the stock did continue
to advance. But perfection is not needed in the stock market. Buying it at 35 and selling it at 50,
was a 40% gain in .7 months. Not shabby.
BUY AT BOTTOM
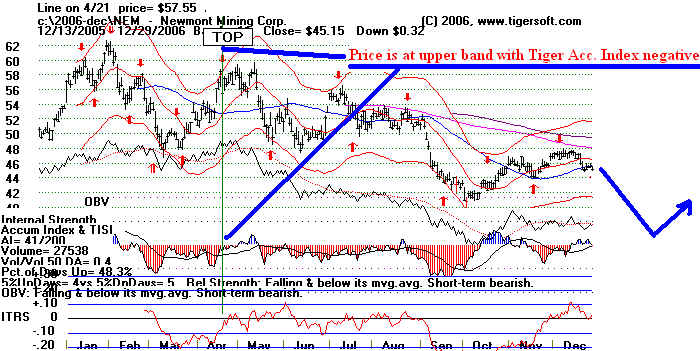
Look at the chart below. You can see the excellent sell given at the top in April 2006. NEM
hit the upper band and the Accumulation Index was negative. Reinforcing this, was the bearish head
and shoulders top in early 2006. The stock subsequently fell to 38.
SELL AT TOP
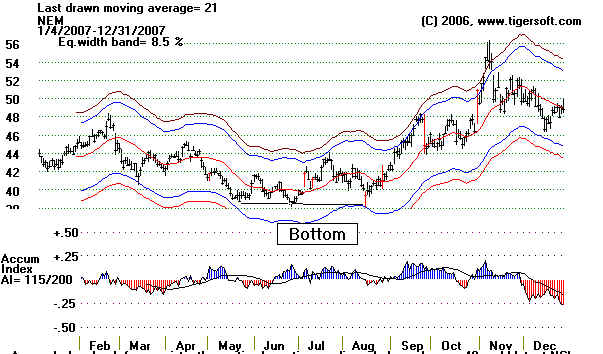
In August 2007 at 39 NEM tagged the blue (optimized lower band) with the Accum. Index
positive. That proved to be the bottom. Certainly one would have been happy taking profits
on the second run to the upper band at 52 only 4 months later. Using Tiger bands give you that
delightful option.
BUY AT BOTTOM
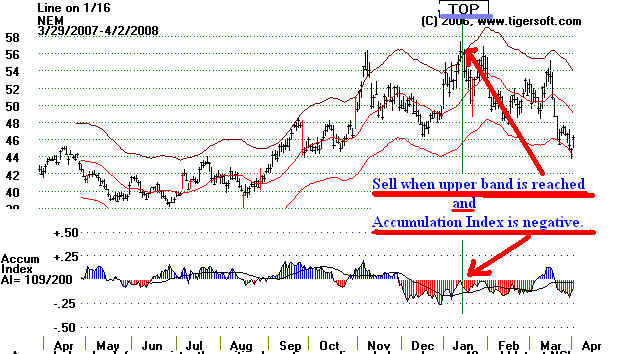
See how NEM hit the Tiger uppe rand with the Tiger Accumulation Index negative in
January 2008. This was a perfect place to sell or sell short.
SELL AT TOP
TIGERSOFT Flags Bearish Divergences like Those above as TigerSoft S9s
The stock does not have to reach the full upper band for an automatic TigerSoft S9.
However, it is much more bearish when they do.
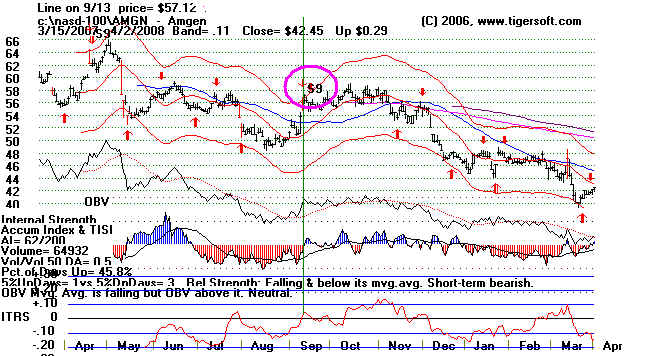
AMGEN - Sept. 2007
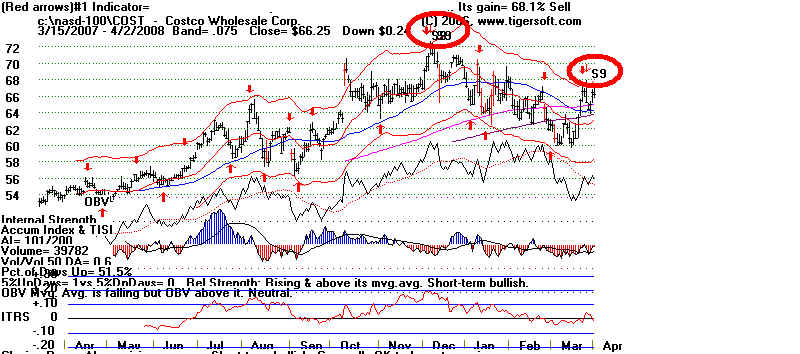
COST - COSTCO
|
DISH 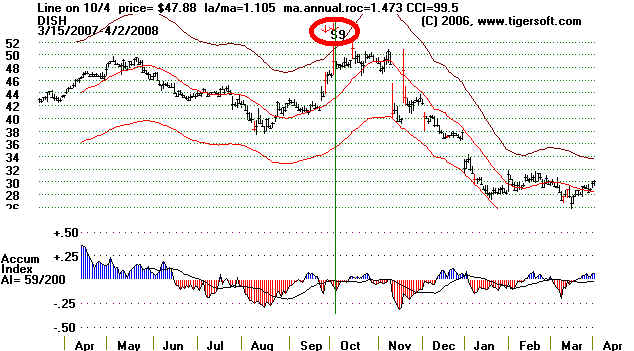 IACI High (red) volume reversals from the upper band in a down trend make good short sales. 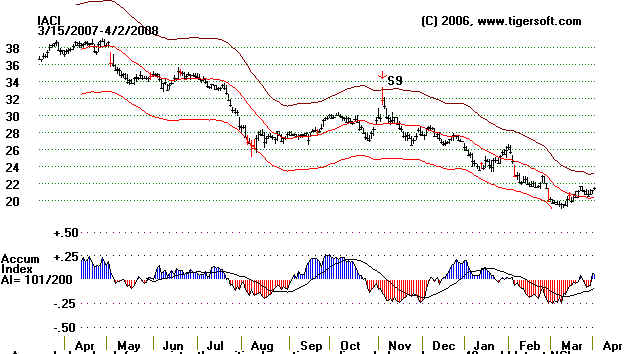 XRAY No signal is perfect. The first S9 below was premature. Second or third S9s are that much more bearish. 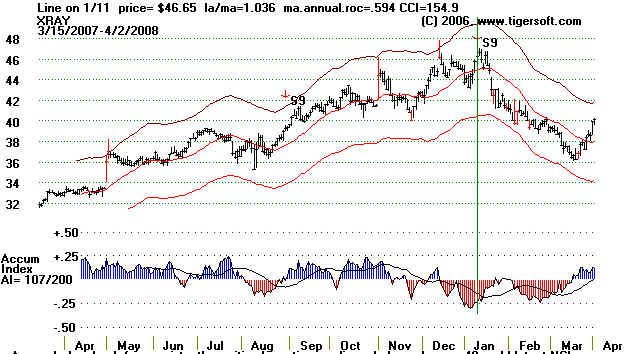 |