 TigerSoft
News Service 3/5/2009
www.tigersoft.com
TigerSoft
News Service 3/5/2009
www.tigersoft.com VOLUME CLUES TO CALLING
BEAR MARKET BOTTOMS
by William Schmidt, Ph.D. (Columbia University)
(C) 2009 All rights reserved. Reproducing any part of this page without
giving full acknowledgement is a copyright infringement.
Buying and Holding Is Dangerous. See All The Peerless Real-Time Signals: 1981-2008
==========================================================================================
Research on Individual Stocks upon Request:
Composite Seasonality Graph of Any Stock for $125.
Example of historical research NEM - Newmont Mining. Order Here.
Bear Market Bottoms
8 (40%) of 22 bottoms occur on Mondays, Tuesday - 5, Wednesday - 3, Thursday -3, Friday - 3
(Any date's day of the week.)
7 (or 8 if you count 1962) of the bottoms took place in Octobers. 6 took place between February and April.
Pct Drop in DIA Number of Pct Decline Day of Week
Legs Down on Last Leg of Bottom
1929-1932 89.2% 8 53.6% Monday
first and last declines were biggest: 47.9% and 53.6%
first and last two bear market rallies were the biggest 48.2%, 35.2% and 25.2%
2007-2009 ? 54% 6 so far... 26.9% so far.
1938-1942 49.0% 3 31.0% Friday
1937-1938 49.0% 3 26.4% Thursday
1919-1921 46.6% 7 8.3% Thursday
1973- 1974 45.1% 6 14.0% Friday
2000-2002 37.8% 4 19.5% Wednesday
1932-1933 37.2% 3 22.0% Monday
1987 36.1% 1 or 2 Monday
1968-1970 36.0% 3 20.1% Tuesday
1917 33.2% 4 11.2% Wednesday
1946-1947 28.8% 1 Monday
1962 27.1% 1 or 2 Tuesday
1976-1978 26.9% 2 12.3% Tuesday
1966 25.2% 4 8.6% Friday
1981-1982 23.6% 4 6.8% Thursday
1990 21.2% 1 Wednesday
--------------------------------------------------------------------------------------------------------
1957 19.7% 1 Tuesday
1998 12.3% 1 or 2 Monday
1960 16.4% 3 11.8% Tuesday
2000 16.3% 1 Tuesday
1997 12.9% 1 Monday
1953 12..6% 2 7.0% Monday
1994 9.6% 1 Monday
| Bear Market Bottoms: 1917-2009 (1) Bear Market 6/18/1917 (98.60) to 12/19/1917 (65.90) Wednesday Decline of 33.2% first breakdown leg down .... 6/18/1917 (98.60) to 9/4/1917 (81.20) bear market rally 9/4/1917 (81.20) 9/25/1917 (86.00) rallied on reduced volume, second leg down 9/25/1917 (86.00) to 10/15/1917 (75.10) bear market rally 10/15/1917 (75.10) to 10/22/1917 (79.10) third leg down 10/22/1917 (79.10) to 11/8/1917 (68.60) bear market rally 11/8/1917 (68.60) to 11/23/1917 (74.20) fourth leg down 11/23/1917 (74.20) to 12/19/1917 (65.90) Wednesday decline of 11.2% OPct low was -,552 on 9/4/1917 ...Subsequent lows were at higher levels, while ONBV confirmed ech low. . There was a buy B7 on 12/28/1917 at 72.10. The 10-day ma was surpassed. In January 1918, there was a pullback to 72 in January and then DJI rose to 89 in Octpber 1918, 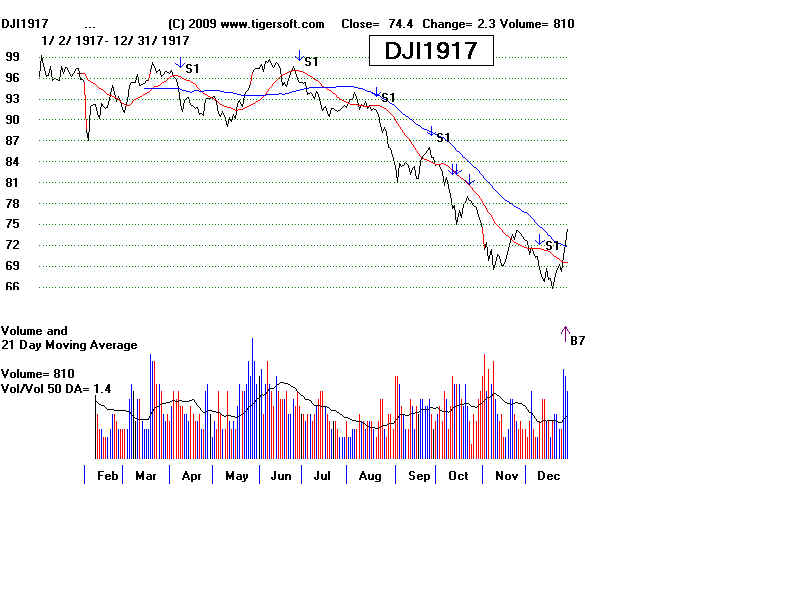 (2) Bear Market 11/3/1919 (119.60) to 8/25/1921 (63.90) Thursday Decline of 46.6% first breakdown leg down ....11/3/1919 (119.60) to 2/25/1920 (90.00) bear market rally 2/25/1920 (90.00) to 4/5/1920 (105.40). This was a rally back up to the resistance from the breakdown at 103.39. second leg down 4/5/1920 (105.40) to 5/19.1920 (87.40) bear market rally 5/19.1920 (87.40) to 7/9/1920 (94.40) third leg down 7/9/1920 (94.40) to 8/10/1920 (83.20) bear market rally 8/10/1920 (83.20) to 9/20/1920 (88.90) fourth leg down and breakdown 9/20/1920 (88.90) to 11/22/1920 (73.10) bear market rally 11/22/1920 (73.10) to 12/3/1920 (77.30) fifth leg down 12/3/1920 (77.30) to 12/1/1920 (66.80) bear market rally 12/1/1920 (66.80) to 5/6/1921 (79.70) sixth leg down 5/6/1921 (79.70) to 6/20/1921 (64.90) bear market rally 6/20/1921 (64.90) to 8/1/1921 (69.70) seventh leg down 8/1/1921 (69.70) - 8/25/1921 63.90 Thursday Bottom. 8.3% decline OBVPct bullish divergence, -.70 to -.45 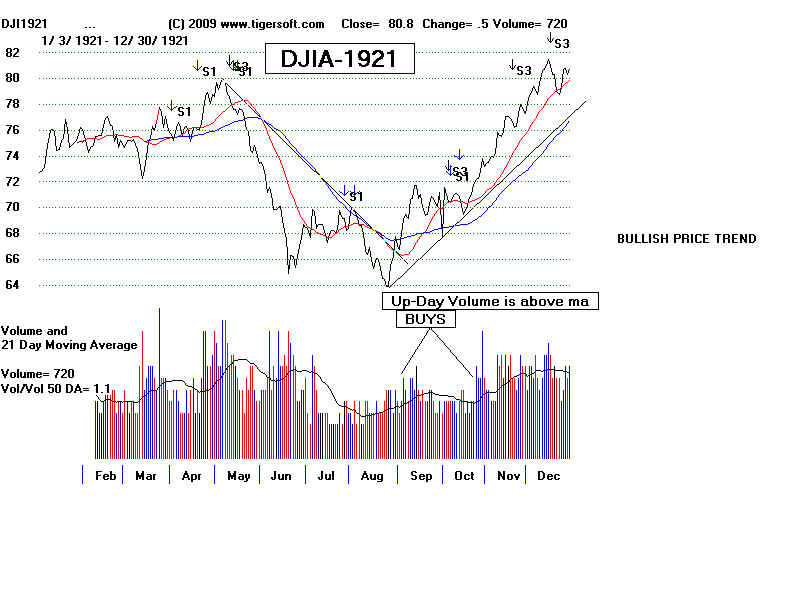 (3) Bear Market 9/3/1929 (381.20) to 7/8/1932 (41.20) Monday Decline of 89.2% first breakdown leg down 9/3/1929 (381.20) to 11/13/1929 (198.70) 47.9% decline bear market rally 11/13/1929 (198.70) to 4/17/1930 (294.10) 48.0% rally second leg down and breakdown 4/17/1930 (294.10) to 6/23/1930 (219.60) 47.9% decline bear market rally 6/23/1930 (219.60) to 9/10/1930 (245.10) 11.6% rally third leg down 9/10/1930 (245.10) to 11/10/1939 (171.60) 30.0% decline bear market rally 11/10/1939 (171.60) to 11/21/1930 (190.30) 10.9% rally fourth leg down 11/21/1930 (190.30) to 12/16/1930 (157.50) 17.2% decline bear market rally 12/16/1930 (157.50) to 2/24/1931 (194.40) 23.4% rally fifth leg down and breakdown 2/24/1931 (194.40) to 6/2/1931 (121.70) 37.4% decline bear market rally 6/2/1931 (121.70) to 7/3/1931 (155.30) 23.4% rally sixth leg down and breakdown 7/3/1931 (155.30) to 10/5/1931 ( 86.50 ) 44.3% decline bear market rally 10/5/1931 86.50 to 11/9/1931 (116.80) 35.2% rally seventh leg down 11/9/1931 (116.80) to 12/17/1931 (73.80) 36.8% decline bear market rally 12/17/1931 (73.80) to 3/8/1932 (88.80) 35.2% rally eighth leg down 3/8/1932 (88.80) 7/8/1932 (41.20) bottom. Monday None of the rallies in this last leg down 53.6% decline rose above their 30-day ma. Very big OBVPct divergence at BOTTOM. Volume rose and rose above its ma on rally, 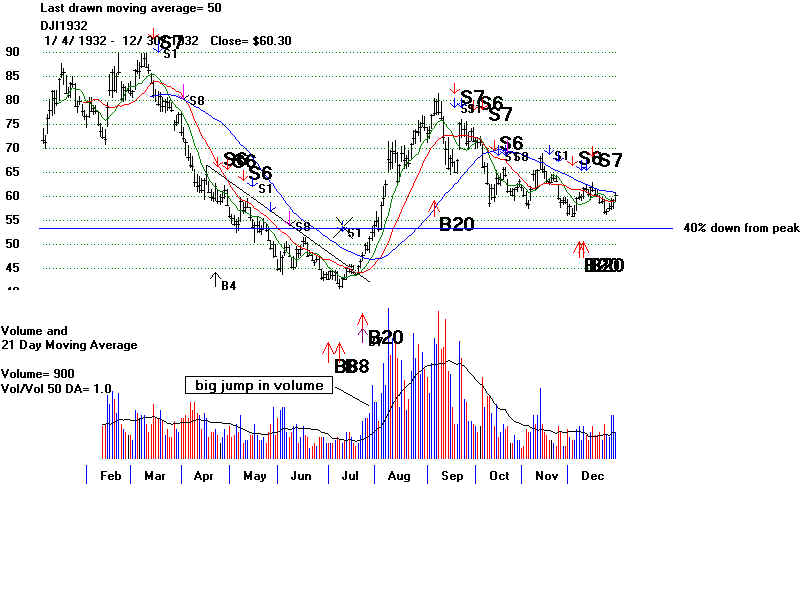 (4) Bear Market 9/7/1932 (79.90) to 2/27/1933 (50.20) Decline of 37.2% first breakdown leg down 9/7/1932 (79.90) to 10/10/1933 (58.50) bear market rally 10/10/1933 (58.50) to 11/11/1933 (68.00) second leg down 11/11/1933 (68.00) to 12/2/1933 (55.90) bear market rally 12/2/1933 (55.90) to 1/10/1933 (64.40) third leg down 1/10/1933 (64.40) to 2/27/1933 (50.20) BOTTOM. Monday 22.0% decline OBV failed to make a new low at bottom. OBVPCT had improved slightly. Volume rose and rose above its ma on rally, 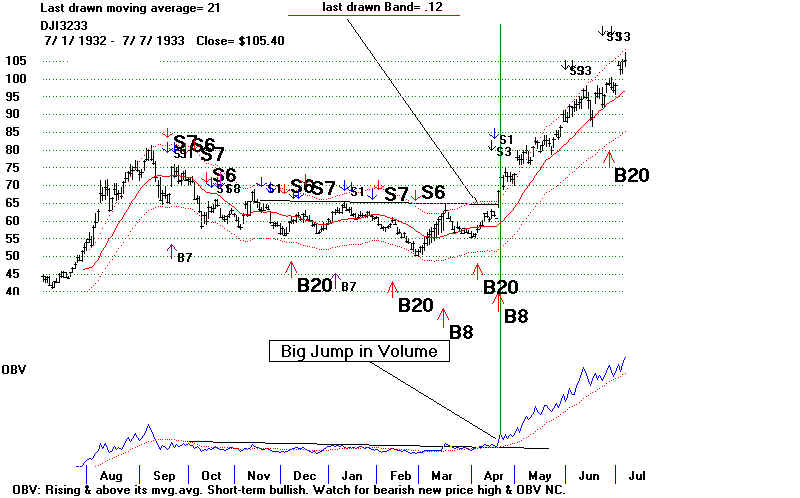 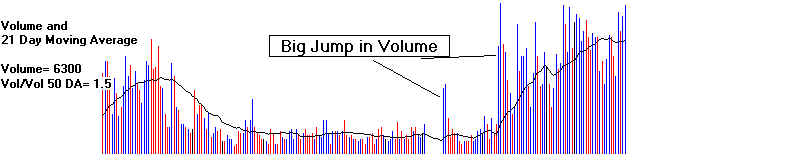 (5) Bear Market 3/9/1937 (193.30) to 3/31/1938 (98.90) Decline of 49.0% The top followed a 8 month rally from 155. At the top the DJI was 2.2% above its ma with an Accum Index of only .026 and OBVPct of only .076. On 4/26/1937, it broke neckline of head and shoulders pattern showing heavy distribution on right shoulder. first breakdown leg down 3/9/1937 (193.90) to 6/14/1937 (165.50) bear market rally 6/14/1937 (165.50) to 8/16/1937 (189.30) second breakdown leg down 8/16/1937 (189.30) 12/31/1937 (113.6) bear market rally 12/31/1937 (113.6) to 1/11/1938 (134.40) third breakdown leg down 1/11/1938 (134.40) to 3/31/1938 (98.90) Thursday BOTTOM Decline of 26.4% OBVPCT fell to new low of -.595. AI reached low of -.339 These are useful marjers of being oversold Volume rose and rose above its ma on rally, 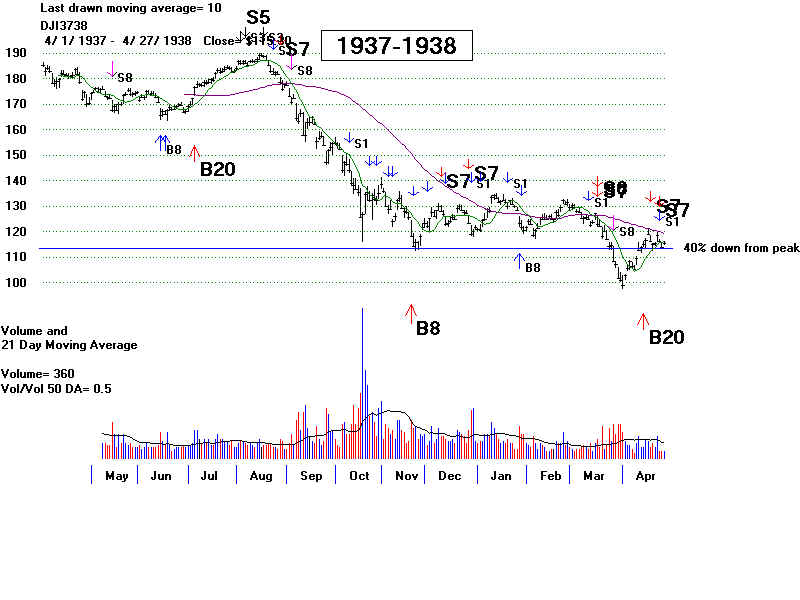 (6) Bear Market 11/9/1938 (158.10) <or 9/13/1939 (154.10)> to 4/24/1942 (94.10) Decline of 49.0% 11/9/1938 top occurred with DJI close 3.9% over 21-dma with AI =.05. The 39-day ma of OBV did not turn down until January first break 11/9.1930 (158.10) to 4/11/1939 (123.80) A month after the 9/13/1939 top, the DJI moved up close to the high with negative Accumulation (-.024) 2.3% over the 21-day ma. An Sell S7 followed and the 39-week ma of OBV turned after a six month advance. . second breakdown leg down 9/13/1939 (154.19) to 5/21/1940 (114.10) Breakdown was at 145. bear market rally 5/21/1940 (114.10) to 11/7/1949 (137.80) third leg down 11/7/1941 (137.80) to 4/24/1942 (94.10) Friday Decline of 31.0% 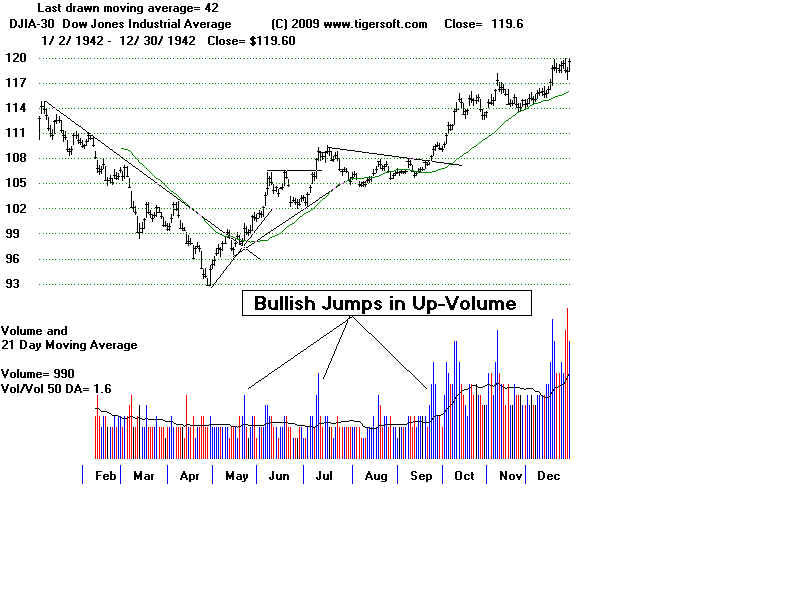 (7) Bear Market 5/29/1946 (212.50) to 10/20/1947 (153.10) Monday ... one leg.... Decline of 28.8% (8) Bear Market 1/6/1953 (292.20) to 9/14/1953 (255.50) Monday Decline of 12.6% first breakdown leg down 1/6/1953 (292.20) to 6/16/1953 (262.90) bear market rally 6/16/1953 (262.90) to 8/13/1953 (276.70) second leg down 8/13/1953 (276.70) to 9/14/1953 (255.50) Monday . Decline of 7.7% 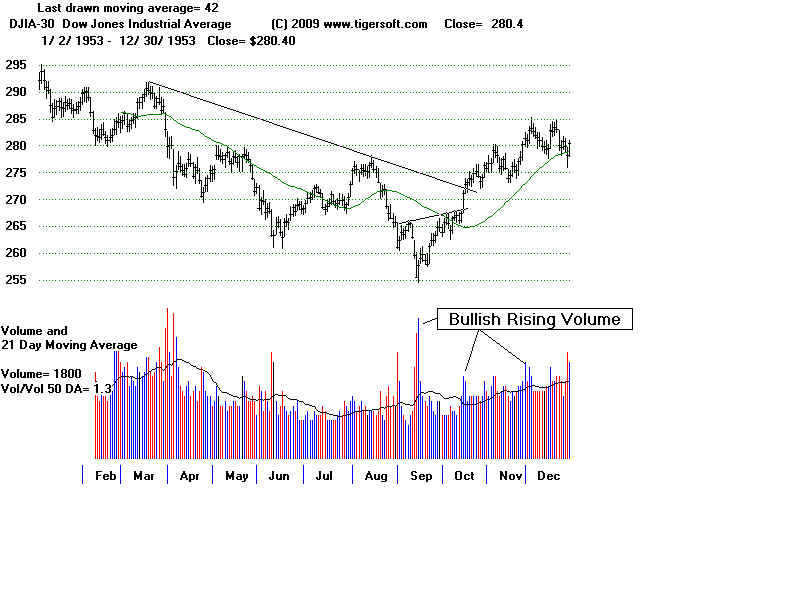 (9) Bear Market 7/12/1957 (520.80) to 10/22/1957 (419.80) - Tuesday 1 leg down. Decline of 19.7% 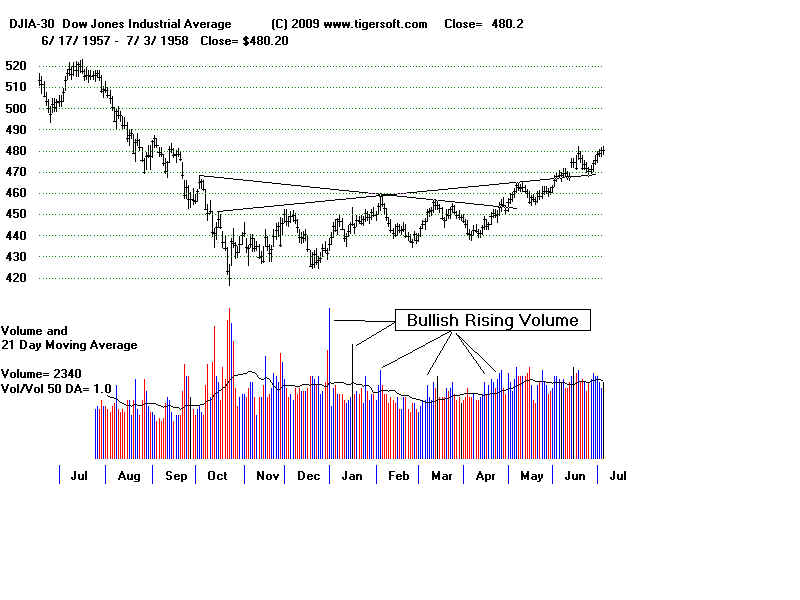 (10) Bear Market 1/5/1960 (685.50) to (10/25/1960) (566.00) Tuesday Decline of 17.4% first breakdown leg down 1/5/1960 (685.50) to 5/2/1960 (599.60) bear market rally 5/2/1960 (599.60) to 6/9/1960 (656.40) second leg down 6/9/1960 (656.40) to 7/25/1960 (601.70) bear market rally 7/25/1960 (601.70) to 8/24/1960 (641.50) third leg down 8/24/1960 (641.50) to 566.00 (10/25/1960) Tuesday BOTTOM Decline of 11.8% 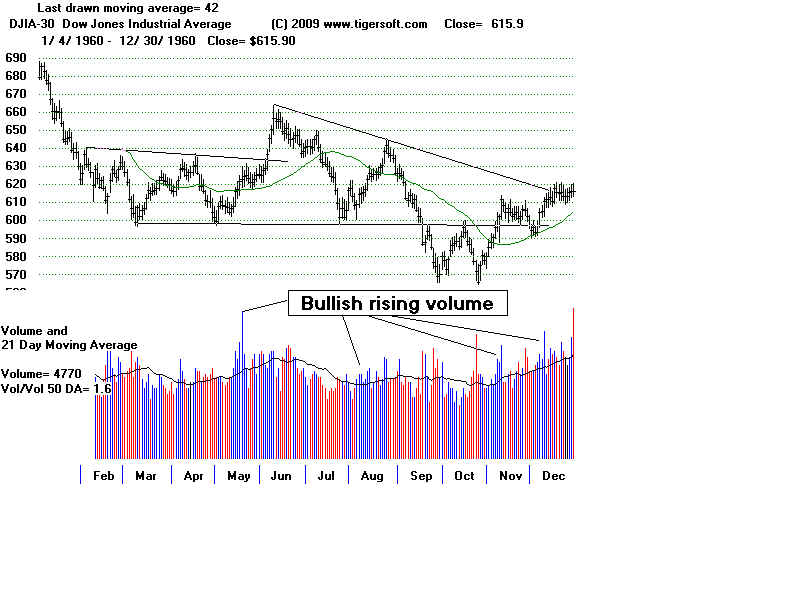 (11) Bear Market 12/13/1962 (734.90) to 6/26/1962 (535.70) Tuesday One leg down Decline of 27.1% Inverted head and shoulders pattern had to form with final bottom in October. 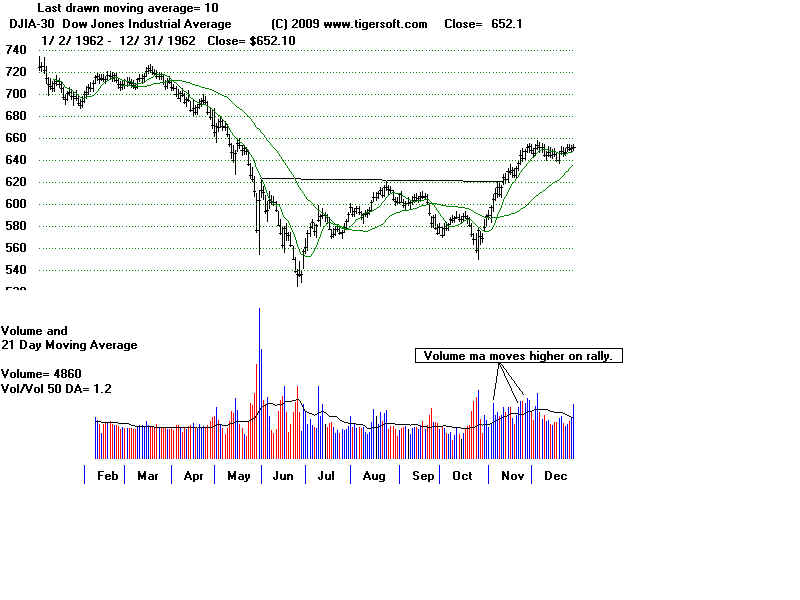 (12) Bear Market 2/9/1966 (995.10) to 10/7/1966 (744.32) Friday Decline of 25.2% first breakdown leg down 2/9/1966 (995.10) to 5/13/1966 (876.11) bear market rally 5/13/1966 (876.11) to 4/21/1966 (954.73) second leg down 4/21/1966 (954.73) to 5/17/1966 (864.14) bear market rally 5/17/1966 (864.14) to 6/14/1966 (903.17) third leg down 6/14/1966 (903.17) to 8/29/1966 (767.03) bear market rally 8/29/1966 (767.03) to 9/15/1966 (814.30) fourth leg down 9/15/1966 (814.30) to 10/7/1966 (744.32) Friday BOTTOM Decline of 8.6% (13) Bear Market 12/2/1968 (985.21) to 5/26/1970 (631.16)) Tuesday Decline of 36.0% first breakdown leg down 12/2/1968 (985.21) to 7/30/1969 (803.58) bear market rally 7/30/1969 (803.58) to 11/10/1969 (863.05) second leg down 11/10/1969 (863.05) to 1/30/1970 (744.06) bear market rally 1/30/1970 (744.06) to 3/25/1970 (790.13) third leg down 3/25/1970 (790.13) to 5/26/1970 (631.16) Tuesday Decline of 20.1% (14) Bear Market 1/11/1973 (1051.70) to 12/6/1974 (577.60) Friday Decline of 45.1% first breakdown leg down 1/11/1973 (1051.70) to 6/25/1973 (869.13) bear market rally 6/25/1973 (869.13) to 7/27/1973 (936.71) second leg down 7/27/1973 (936.71) to 8/22/1973 (851.90) strong market rally 8/22/1973 (851.90) to 12/5/1973 (788.31) - third leg down 12/5/1973 (788.31) to 2/11/1973 (803.90) bear market rally to recovery high, 2/11/1973 (803.90) to 3/13/1974 (891.66) fourth leg down 3/13/1974 (891.66) to 5/29/1974 (795.37) bear market rally 5/29/1974 (795.37) to 6/10/1974 (859.67) fifth breakdown leg down 6/10/1974 (859.67) to 10/3/1974 (584.56) bear market rally 10/3/1974 (584.56) to 11.7/1974 (671.93) sixth leg down 11.7/1974 (671.93) to 12/6/1974 (577.60) Bottom Friday Decline of 14.0% (15) Bear Market 9/21/1976 (1014.79) to 2/28/1978 (742.12) Tuesday Decline of 26.9% first breakdown leg down 9/21/1976 (1014.79) and 12/31/1977 (1004.65) to 5/27/1977 (898.83) bear market rally 5/27/1977 (898.83) to 11/11/1977 (845.89) second beakdown leg down 11/11/1977 (845.89) to 2/28/1978 (742.12) Tuesday BOTTOM Decline of 12.3% (16) Bear Market 4/28/1981 (1016.93) to 8/12/82 (776.92 ) Thursday Decline of 23.6% first breakdown leg down 4/28/1981 (1016.93) to 12/4/1981 (892.69) bear market rally 12/4/1981 (892.69) to 12/4/1981 (892.69) second leg down 12/4/1981 (892.69) to 3/8/1982 (795.47) bear market rally 3/8/1982 (795.47) to 5/7/1982 (869.20) third leg down 5/7/1982 (869.20) to 6/17/1982 (791.48) bear market rally 6/17/1982 (791.48) to 7/20/1982 (833.43) fourth leg down 7/20/1982 (833.43) to 8/12/82 (776.92 ) Thursday BOTTOM Decline of 6.8% (17-21) Brief Bear Markets: From 1982 to 2000 there were no sustained bear markets, only quick sell-offs. October 1987 Plunge 8/25/1987 (2722.42) to 10/19/1987 (1738.74) Monday Decline of 36.1% 1990 7/16/1990 (2999.75) to 10/31/1990 (2365.10) Wednesday Decline of 21.2% 1994 2/2/1994 (3975.54) to 4/4/1994 (3593.36) Monday Decline of 9.6% 1997 7/31/1997 (8222.61) to 10/27/1997 (7161.15) Monday Decline of 12.9% 1998 7/17/1998 (9337.97) to 8/31/1998 (7539.07) Monday Decline of 19.3% 2000 1/14/2000 (11722.98) to 3/14/2000 (9811.24) Tuesday Decline of 16.3% (22) Bear Market 1/14/2000 (11722.98) to 10/9/2002 (7286.27) Wednesday Decline of 37.8% first breakdown leg down 1/14/2000 (11722.98) to 3/22/2001 (9389.48) bear market rally 3/22/2001 (9389.48) to 5/22/2001 (11257.24) second leg down 5/22/2001 (11257.24) to 9/21/2001 (8235.81) bear market rally 9/21/2001 (8235.81) to 3/19/2002 (10635.25) third leg down 3/19/2002 (10635.25) to 7/23/2002 (7702.34) bear market rally 7/23/2002 (7702.34) to 8/22/2002 (9052.64) fourth leg down 8/22/2002 (9052.64) to 10/9/2002 (7286.27) Wednesday BOTTOM Decline of 19.5% (23) Bear Market 10/9/2007 (14164.53) to first breakdown leg down 10/9/2007 (14164.53) to 11971.19 (1/22/2007) bear market rally 11971.19 (1/22/2007) to 2/1/2007 (2/1/2008) second leg down 2/1/2007 (2/1/2008) to 3/10/2008 (11740.15) bear market rally 2/1/2007 (2/1/2008) to 5/2/2008 (13058.20) third leg down 5/2/2008 (13058.20) to 7/15/2008 (10962.58) bear market rally 7/15/2008 (10962.58) to 8/11/2008 (11782.35) fourth breakdown leg down 8/11/2008 (11782.35) to 10/27/2008 (8175.77) bear market rally 10/27/2008 (8175.77) to 11/4/2008 (8624.28) fifth leg down 11/4/2008 (8624.28) to 11/20/2008 (7552.29) bear market rally 11/20/2008 (7552.29) to 9015.10 (1/6/2009) sixth leg down 9015.10 (1/6/2009) to 6594.44 (3/5/1009) Decline of 26.9% |
Volume
Usually Rises On First Up Day
Compared To Volume on Down Day of A Major Bottom.
12/28/1917 bottom first up day volume rose 20% over previous day.
10/20/1921 bottom first up day volume was same as volume on previous day and rise
over next 7 days,
3/8/1932 bottom first up day volume fell 20% over previous day.
7 days later it rose steadily above its rising ma
3/31/1938 bottom first up day volume fell over 30% from previous day
4/28/1942 bottom first up day volume rose 30% over previous day. Data looks
suspicious,
10/22/1957 bottom first up day volume fell 10 from previous very, very high
volume (2x 21-day ma of volume)
10/25/1960 bottom first up day volume equalled previous down day volume.
10/23/1962 bottom first up day volume was 10% over previous down day volume.
10/6/1966 bottom first up day volume was 13% over previous down day volume.
5/26/1970 bottom first up day volume was slightly over previous down day
volume.
10/4/1974 bottom first up day volume was 5% below previous down day volume but
quickly rose above ma.
2/27/1974 bottom first up day volume was 5% over previous down day
volume but quickly rose above ma.
4/21/1980 bottom first up day volume was 75% over previous down day volume but
quickly rose above ma.
8/12/1982 bottom first up day volume was 5% below previous down
day volume but quickly rose above ma.
7/24/1984 bottom first up day was 15% over
previous down day volume but quickly rose above ma.
10/19/1987 bottom first up day was 2%
over previous down day volume but quickly rose above ma.
11/11/1990 bottom first up day was 3% over previous
down day volume but quickly rose above ma.
10/27/1997 bottom first up day was 80% over previous down day
volume but quickly rose above ma.
8/31/1999 bottom first up day was 20% over previous down day
volume but quickly rose above ma.
9/21/2001 bottom first up day was 30% below previous down
day volume but quickly rose above ma.
10/8/2002 bottom first up day was 3% over previous down day volume
but quickly rose above ma.
3/12/2003 bottom first up day was 30% over previous down day volume but
quickly rose above ma.