TRADING
GOLD STOCKS
WITH TIGERSOFT STOCHASTICS
by William Schmidt,
Ph.D.
There are times when stocks are up-trending, times when they are down-trending
and times when they are mostly backing and filling, in other words, pausing before they
make up their minds which way they want to go. The direction of a key moving average (ma)
helps tell us a stocks' status. Intermediate-term (2-4 month traders) can use a
50-day ma for this. 50-day is commonly used by technicicans. We actually
prefer
a 65-day ma, So, if the stock is ABOVE its key RISING moving average, the trend
is up and vice verse, namely, if it is BELOW its FALLING moving avergae,
the trend is down. Otherwise, the stock's trend is in doubt.
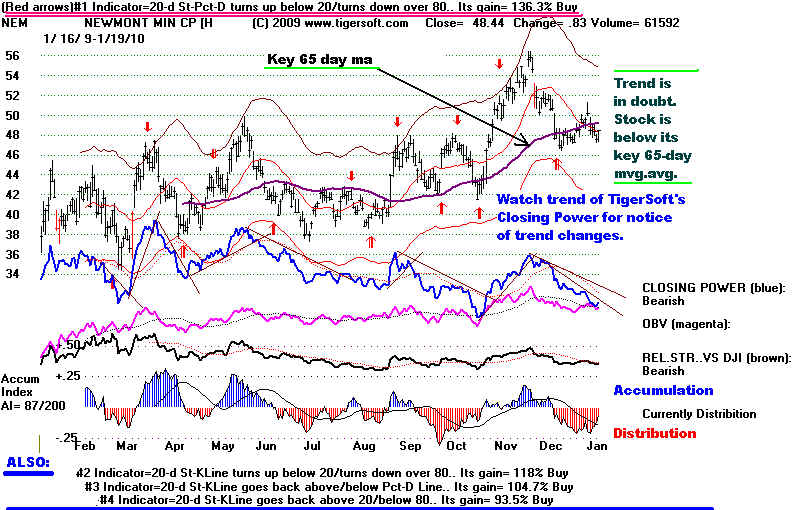
Look at NEM, Newmont, the world's biggest gold mining stock. The stock is clearly
below its rising 65-day ma. So, the uptrend is in doubt until it gets back above the
65-day ma or the 65-day ma turns down. In practice we also use internal strength
indicators
to determine trend. With the Tiger Accumulation Index in negative RED territory
and the BLUE Closing Power in a down-trend, NEM's uptrend is in more doubt.
So, what can a trader do in such situations, when the stock is not in a confirmed trend?
The answer is learn about Stochastics and how Tiger produces very profitable trading
results
using Stochastics.
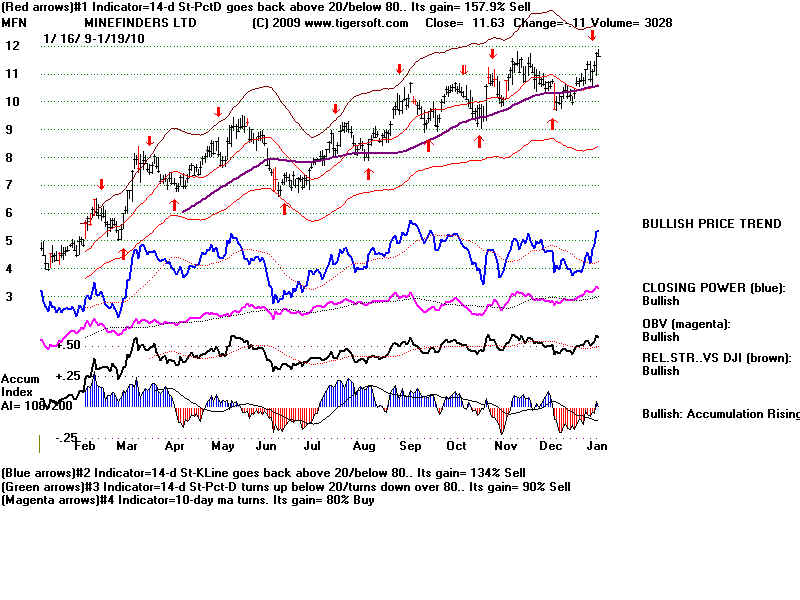
NEM - Trading Gain = +136.3% Using 20-day Stochastic PctD.
AFTER A RED STOCHASTIC BUY OR SELL,
ACT
ON A BREAK IN THE
TIGER CLOSING-POWER TREND
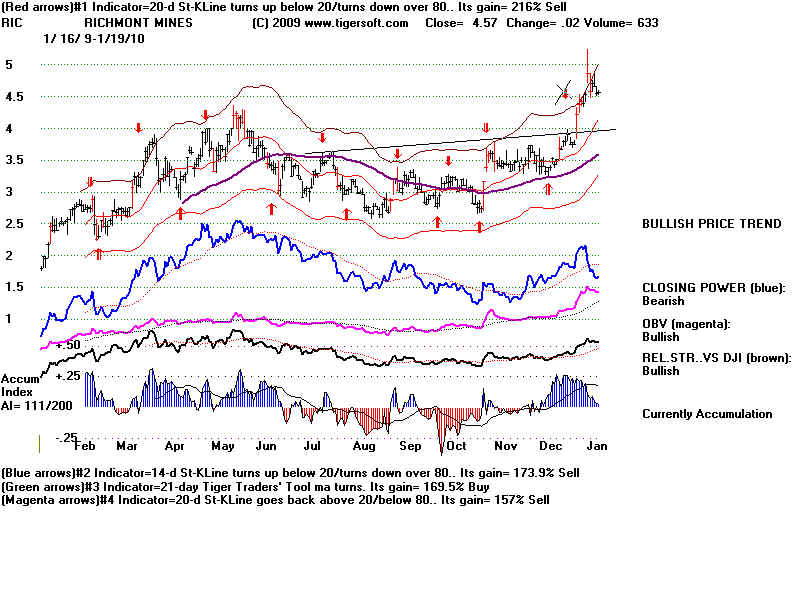
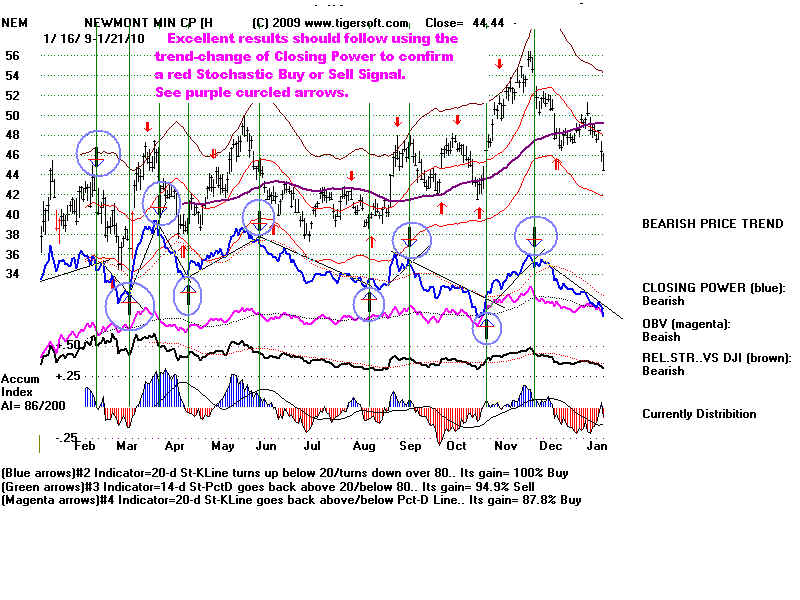
To be safer when volatility increases, wait for the trend of the Tiger
Closing Power
to
confirm the red Buy or Sell. I have circled in violet where these trend breaks
occurred
in the Blue CLosing Power. Presently, we have a Red Buy, but
the
CLosing Power down-trend has not ended. When it does, we would Buy.
There
are lots of sample charts below to apply this rule to. Buyin and Selling
when
the CLosing Power trend changes in the direction of the red Buy should
achieve
gains regularly and very safely..
 STOCHASTICS
Stochastics are statistics. Applied to the stock market, they
have come to mean an
oscillator developed by George Lane.
The Lane K-Stochastic indicator is an oscillator that shows where
the stock is in a specified
period of time. If the stock's range for the last
20 days is 15 to 20, and the
stock is at 19, then the K-Stochastic's
value is 80. At 16, the K-Stochastic value here would be 20.
-

A 3-day moving average of the K-Stochastic
is commonly used.
This is called the Pct-D.
It is used to smooth the K-lines greater
fluctuations. Traders use the the K-Line and Pct-D in a number
of ways:
1. A new price low that is not confirmed by the Stochastics Pct-D
indicator (blue line below) making its own new
low simultaneously is bullish.
2. Similarly, a new price high that is not
confirmed by the Stochastics
Pct-D indicator (blue line below) making
its own new high is bearish.
The chart below has green "X"s marked where there are
non-confirmations.
They can be be judged to give reliable Buys and Sells. A newer version
of Tiger will soon put these "X"s and Trading Range Buys and Sells
- on the screen automatically. The magenta
Arrows below show a different
system. They show the best trading system using the next five rules.
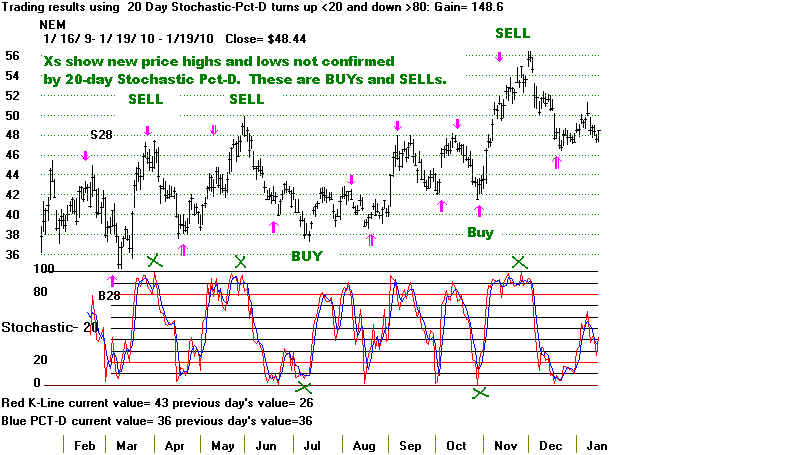
The red arrows in the price area above (NEM) are based on a
20-Day Pct-D dropping back below 80 (SELL) and rising above 20 (BUY).
Presently, when you pull up a chart with Tiger, it automatically tells you
which of the following systems is best, giving you the optimum length
stochastic and telling you which of the next 5 systems is best.
3. The Stochastic-K dropping below 20 and turning
up is often
a good buy. Similarly, the K-Line rising above 80 and turning down is often a
good sell.
4. The Stochastic-K dropping below 20 and moves back above 20
is often a good buy. Similarly, the K-Line rising above 80 and dropping
below 80 is often a good sell.
5. The Stochastic-Pct-D dropping below 20 and turning up is often
a good buy. Similarly, the Pct-D rising above 80 and turning down is often a
good sell.
6. The Stochastic-Pct-D dropping below 20 and surpassing 20 is often
a good buy. Similarly, the Pct-D rising above 80 and dropping below 80
is often a good sell.
7. The Stochastic-K-Line surpasses the Pct-D after both decline below
40 is a good buy. Similarly, the K-Line falling below the Pct-D above 60
is often a good sell.
STOCHASTICS
ARE THE BEST TRADING
SYSTEM NOW FOR MOST GOLD STOCKS
They Have Been Very Profitable
Gold Bullion may be very strong and not be very far off all-time highs,
but most Gold and
Silver stocks are in trading ranges, as defined above. And the best trading system
for
them now is in almost every case a Stochastic. This we know because TigerSoft
automatiucally calculates what the best trading system has been for the last
year
with each stock from among 60 different systems, some trending and some
trading.
The
great gains psted are historical. They show what would have happened if
one
had traded every Buy or Sell, both long and short. A commission of $40 is
allowed for each closed out trade. This also allows for slippage, between the
signal at the end of the day and the actual trade taken the next day.
Will
the next 12 months' trades be as profitable. Probably not. Market conditions
will
change, of course. However, the "personalities" of individual stocks and
the
behavior of most of their traders are more likely to remain much the same, for now.
So,
my judgement, barring dramatic international crises, these stocks will remain
mostly in trading ranges and trade very well with the TigerSoft Optimized Stochastics
Buys
and Sells, especially when the Non-Confirmation Buys and Sells are show.
We
should mention that TigerSoft users presently are shown specifically how to recognize
when
such automatic and optimized signals are apt to fail.
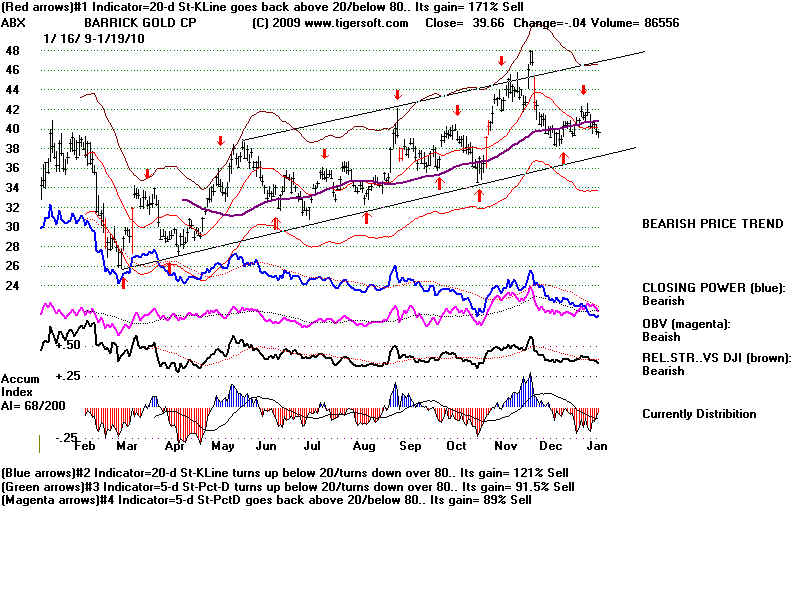
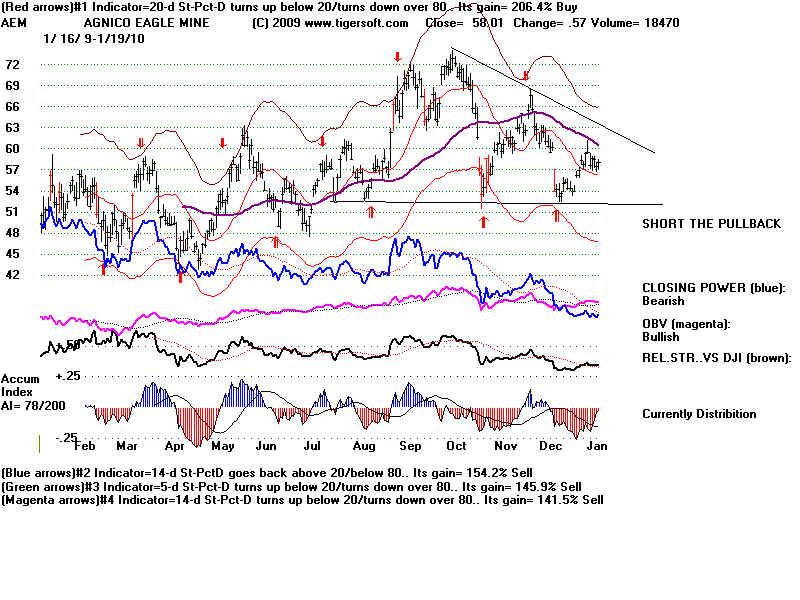
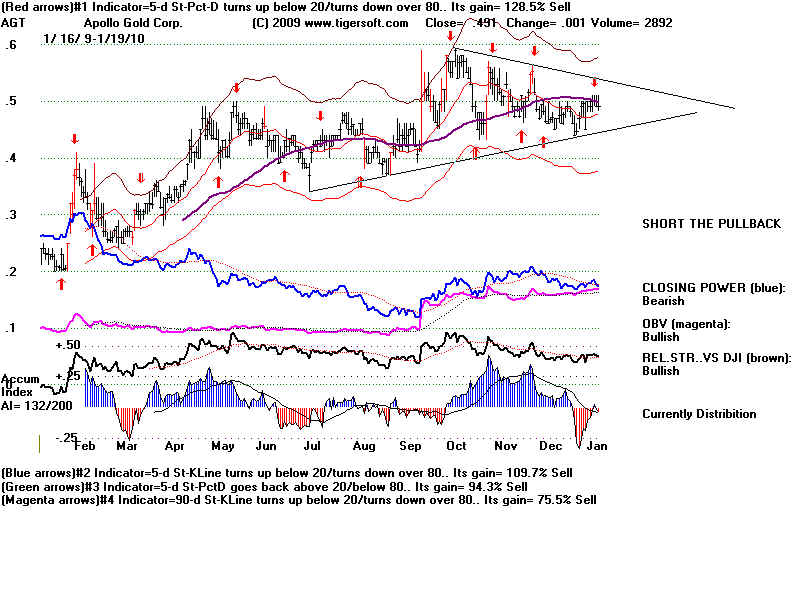
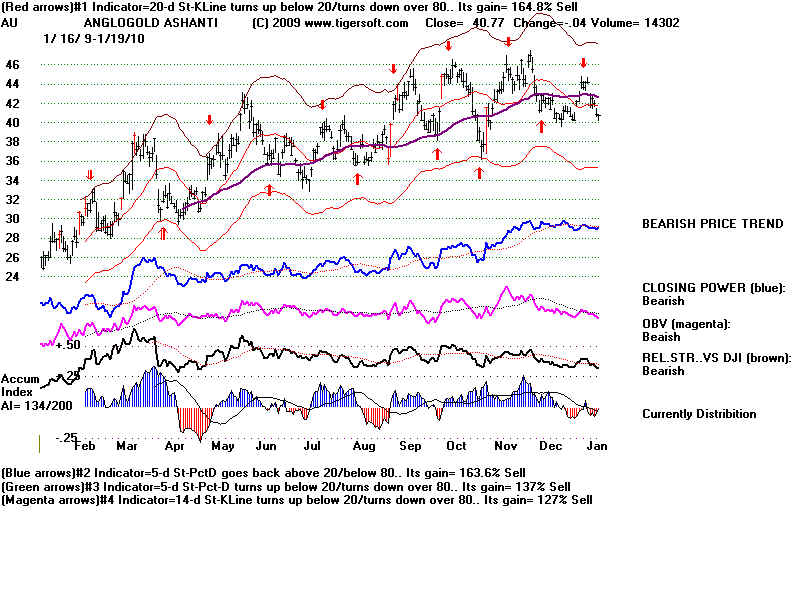
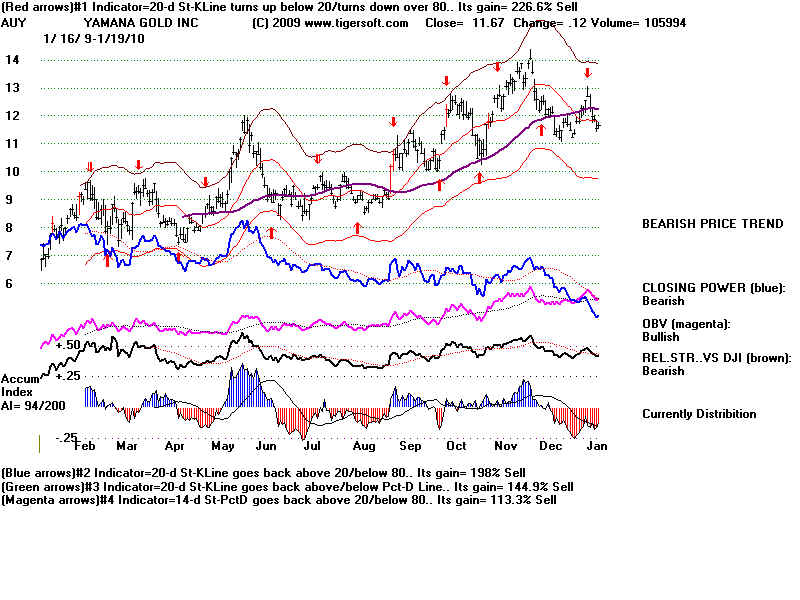
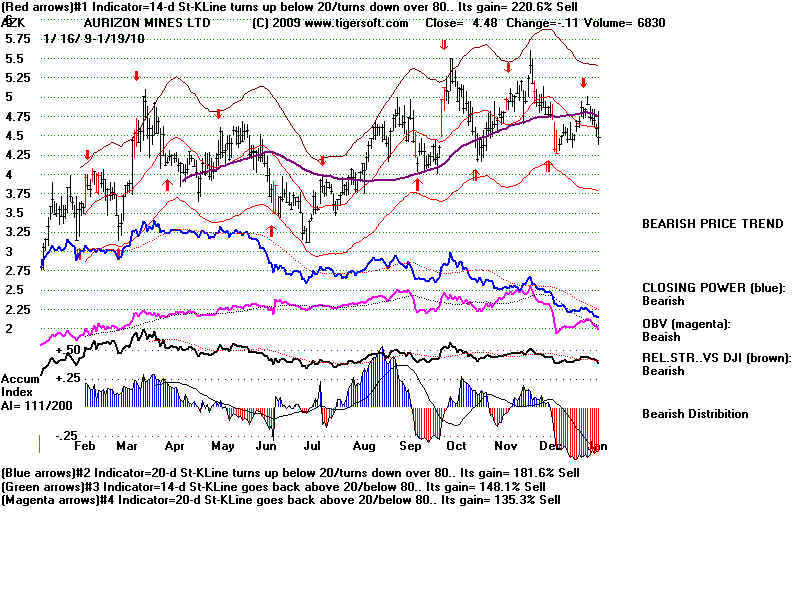
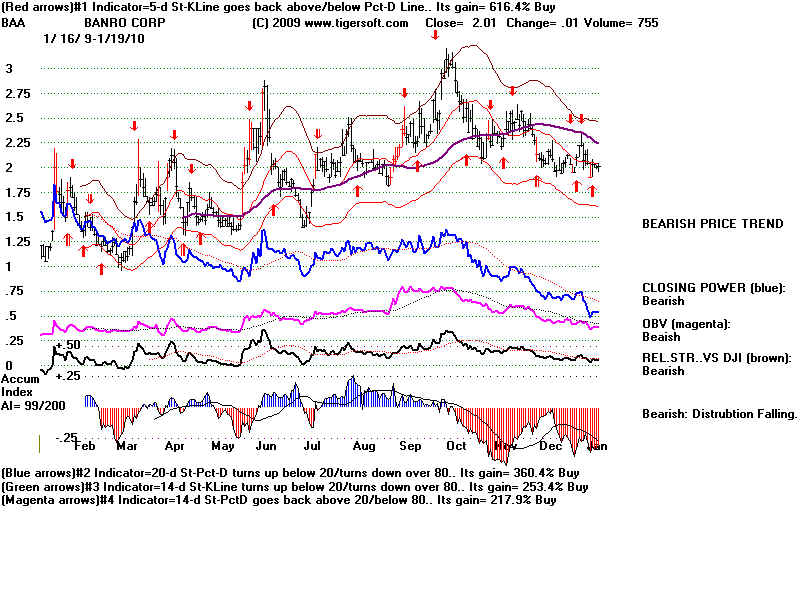
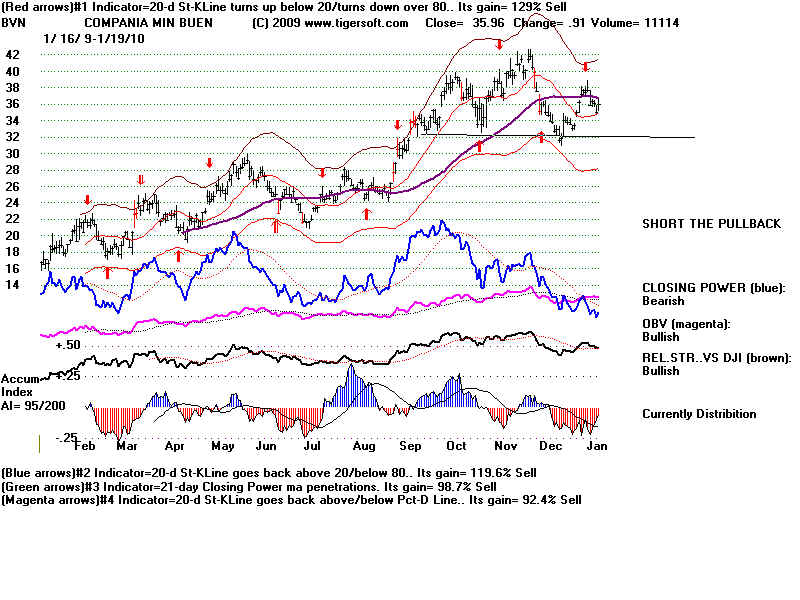
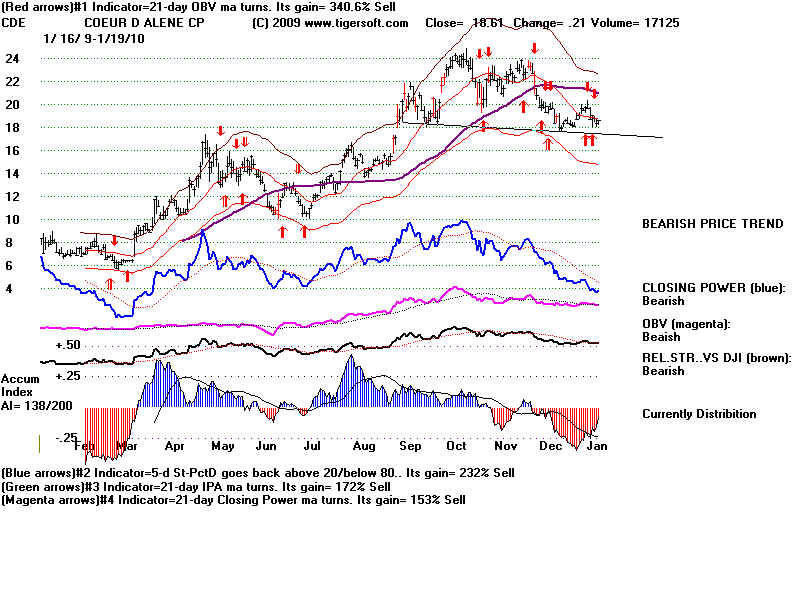
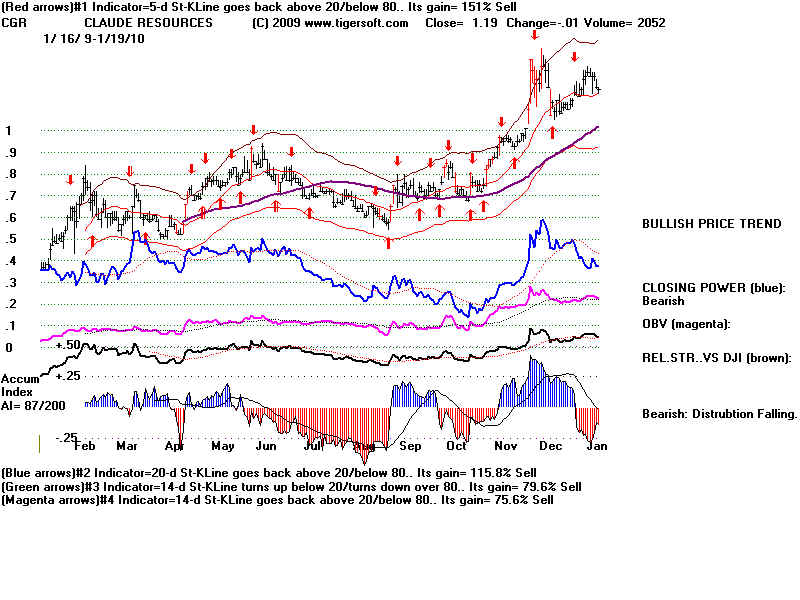
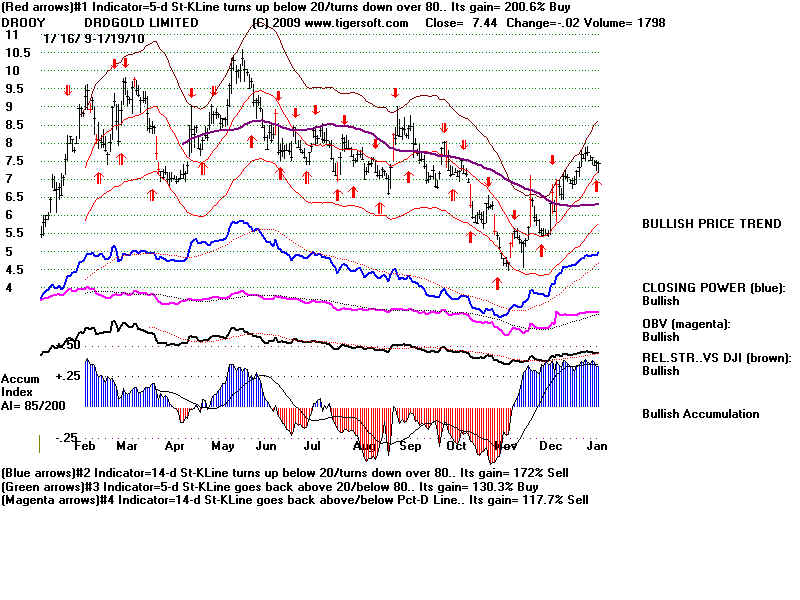
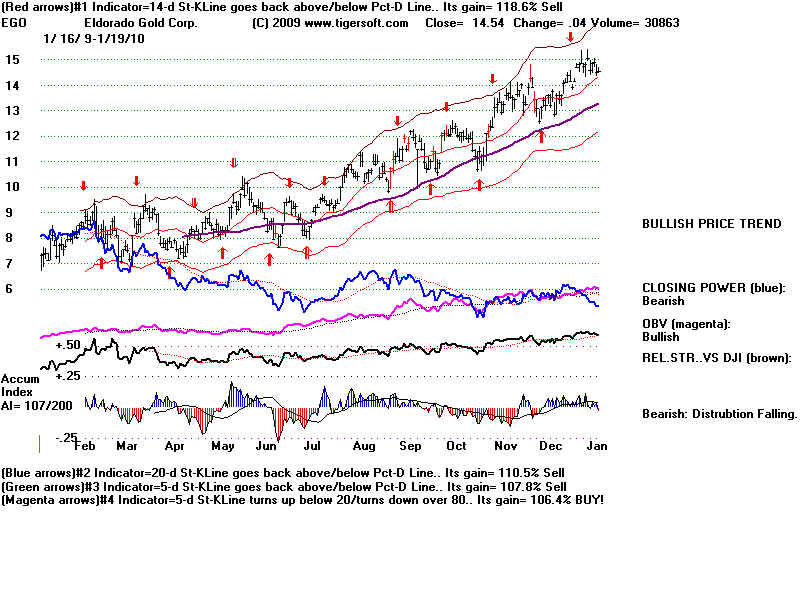
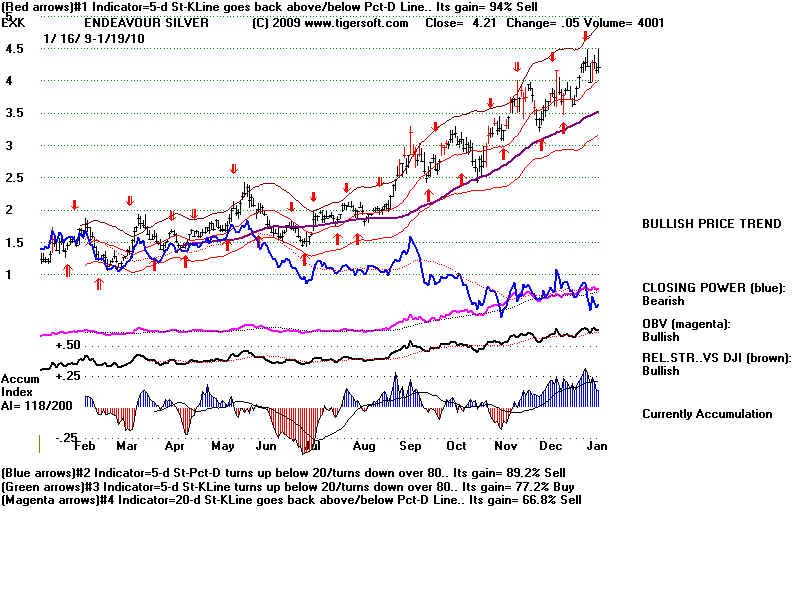
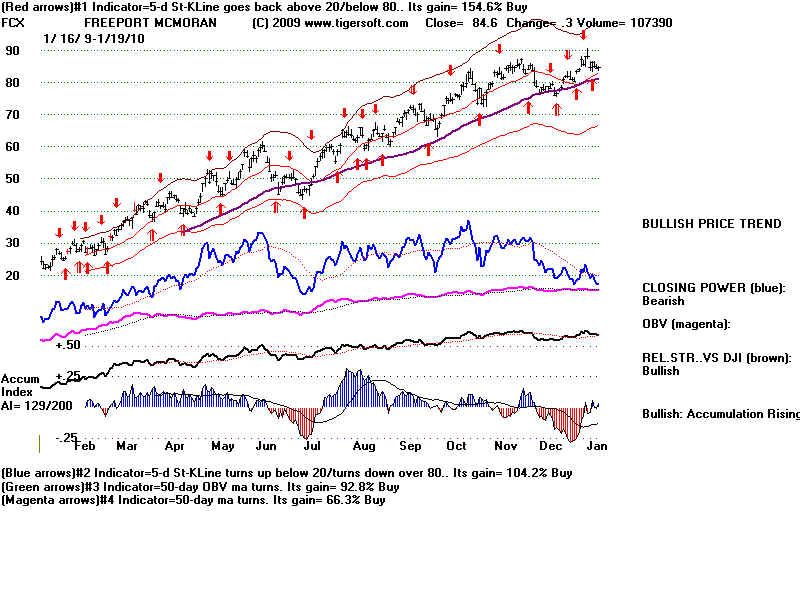
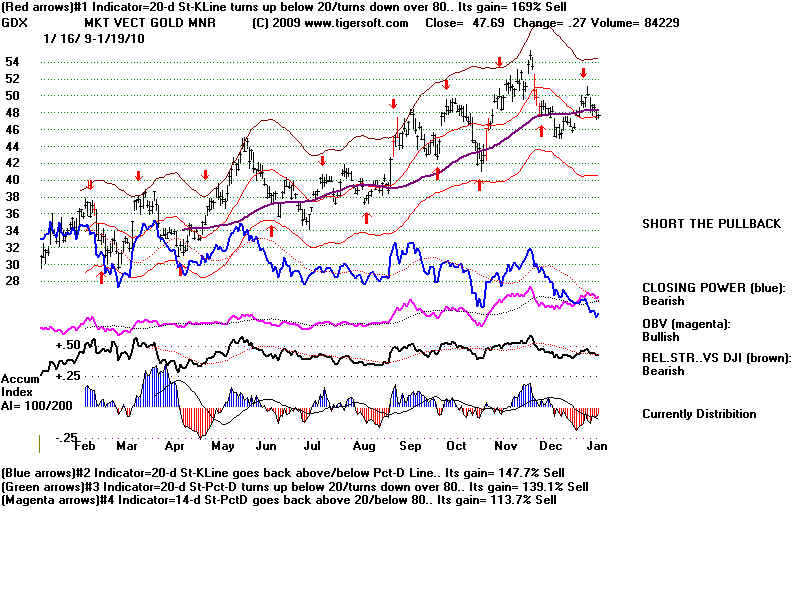
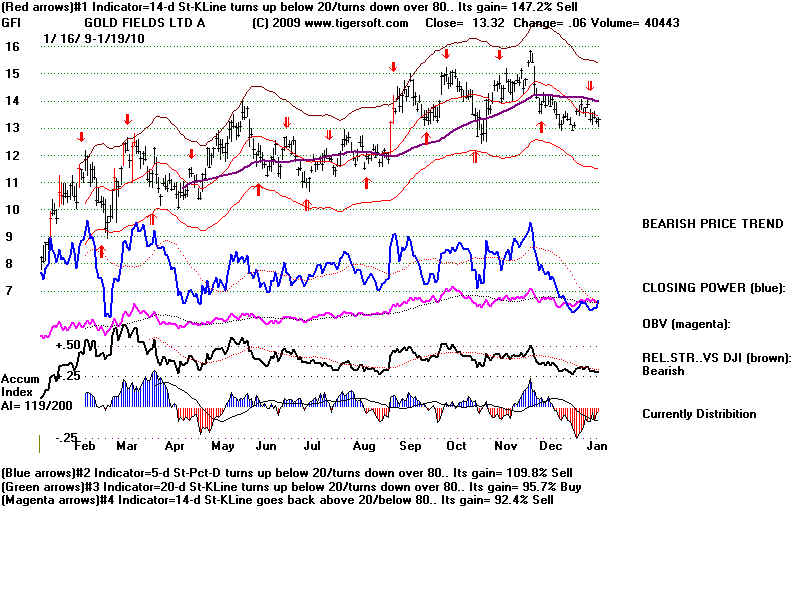
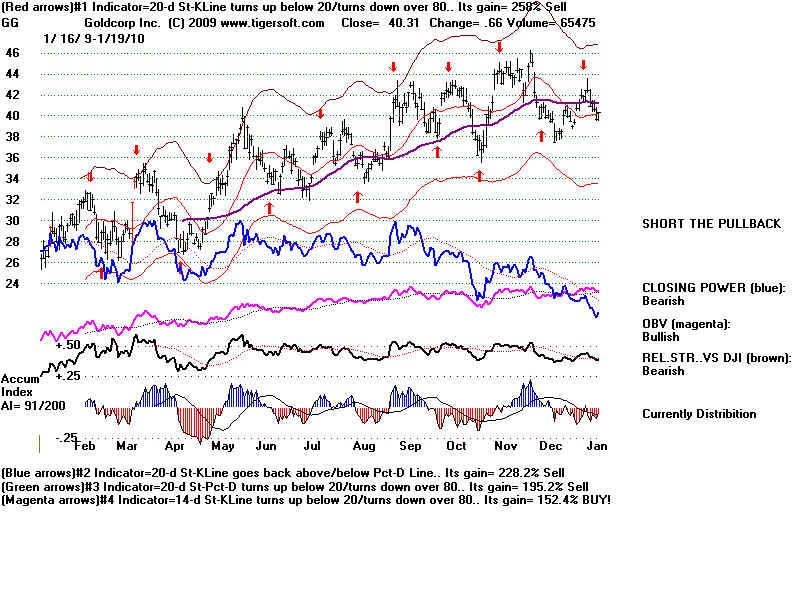
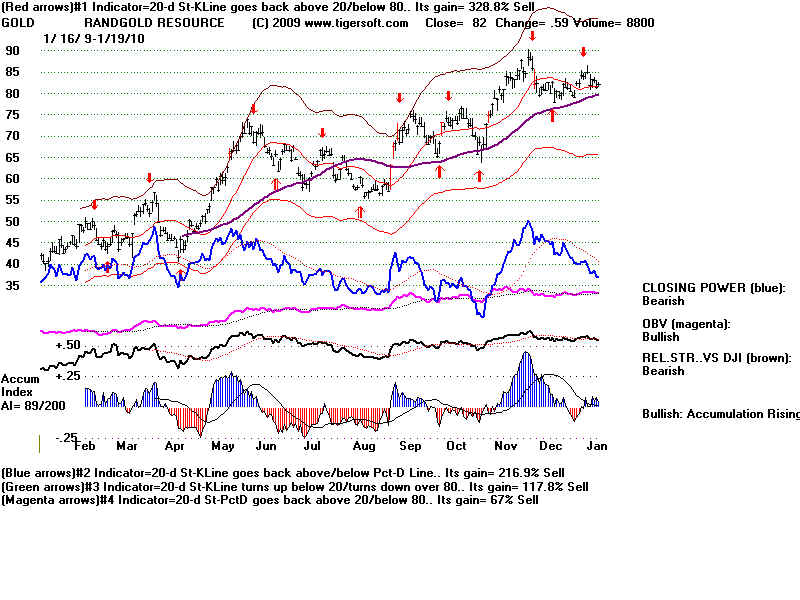
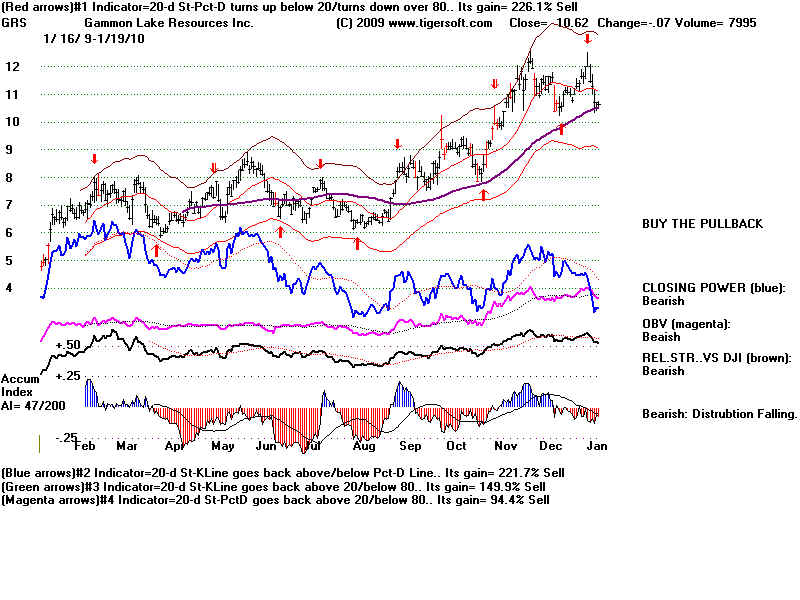
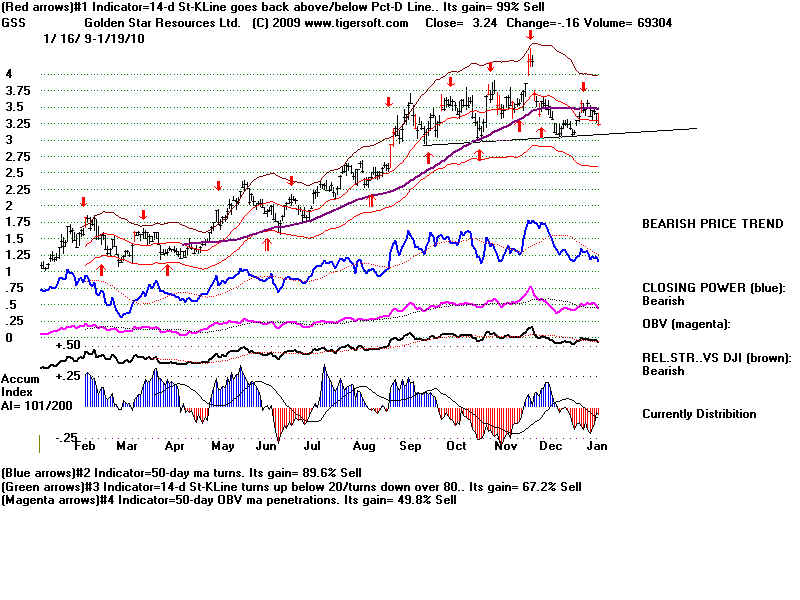
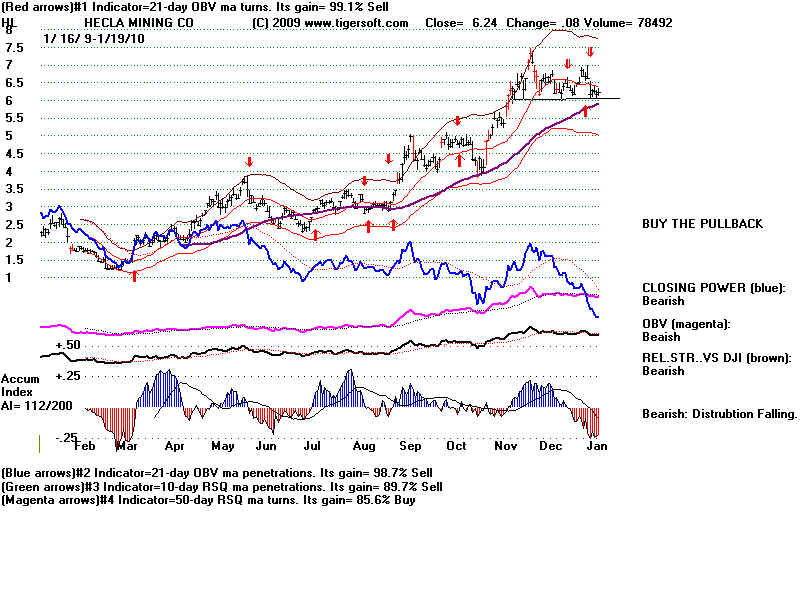
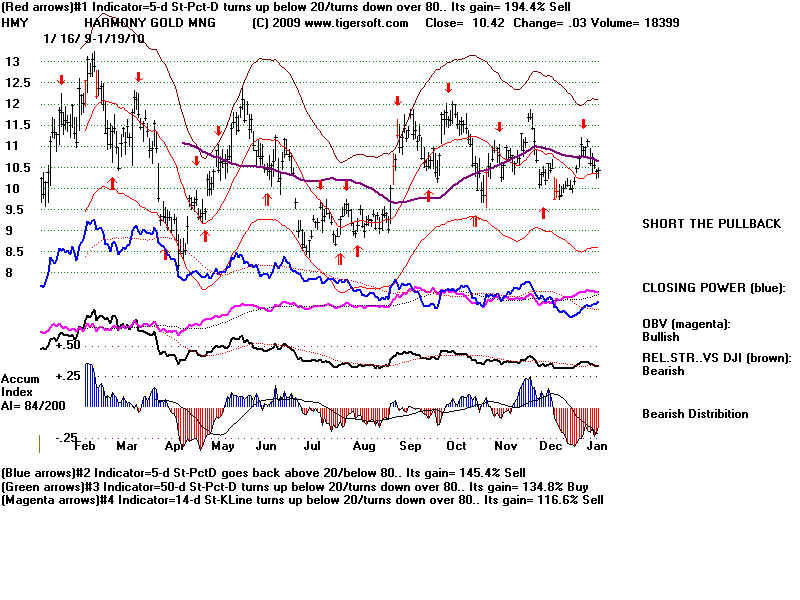
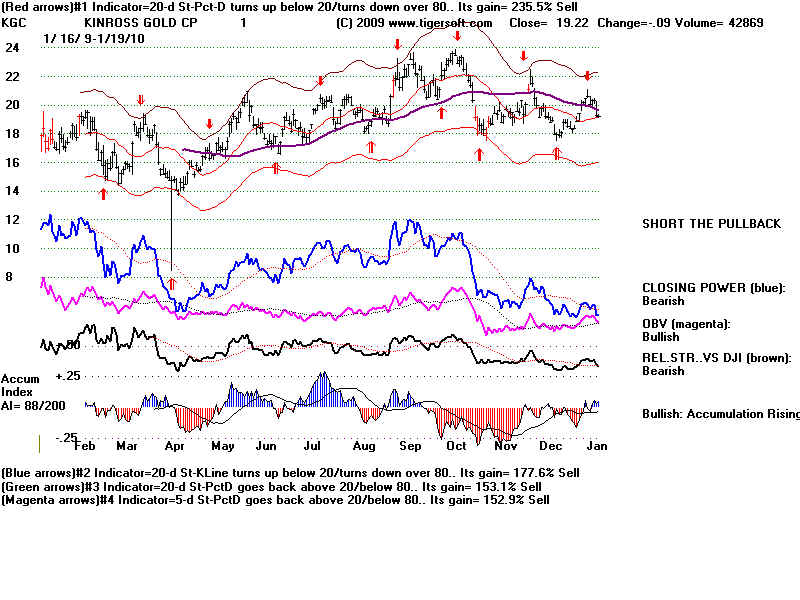
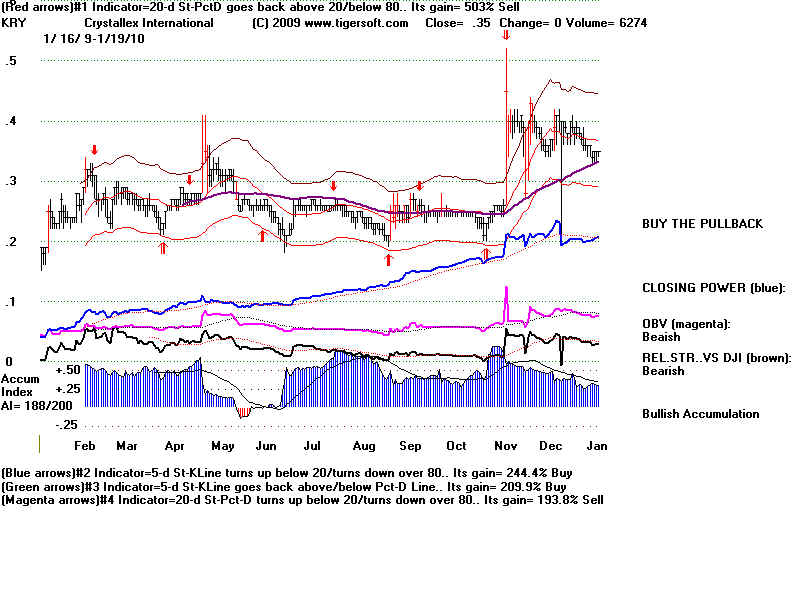
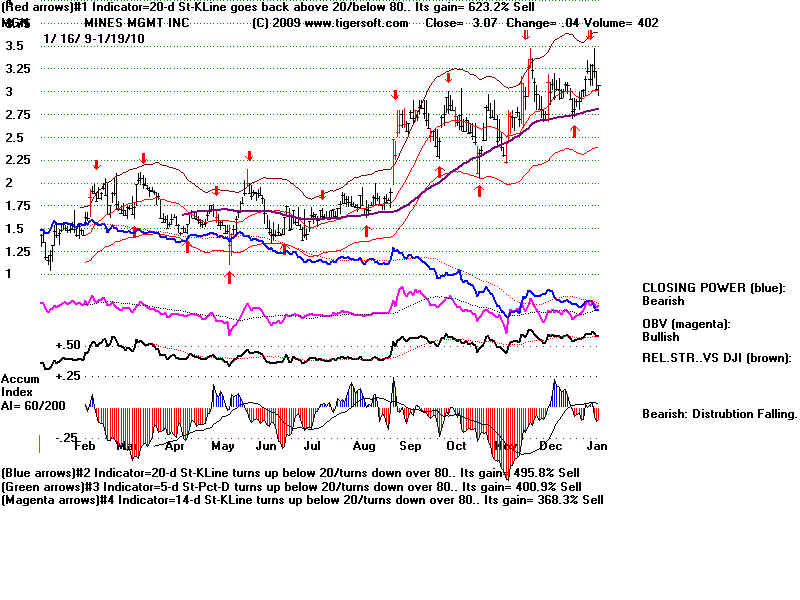
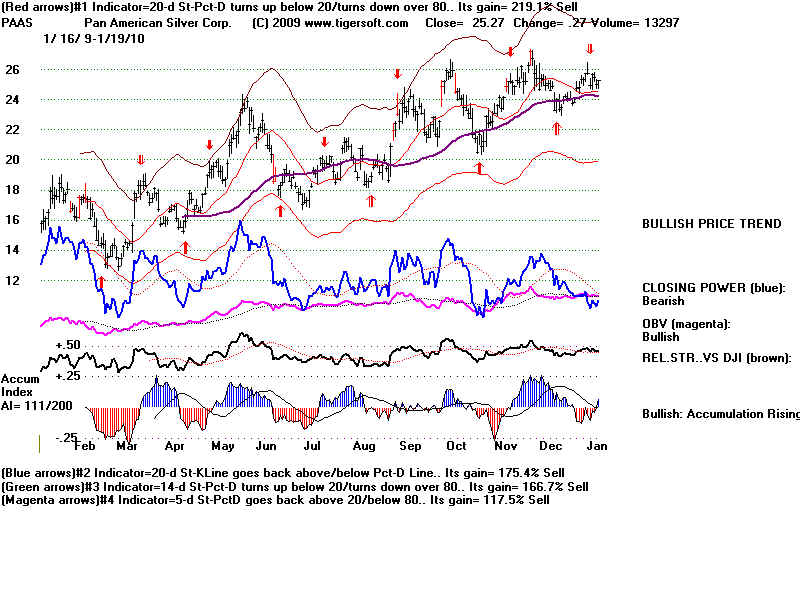
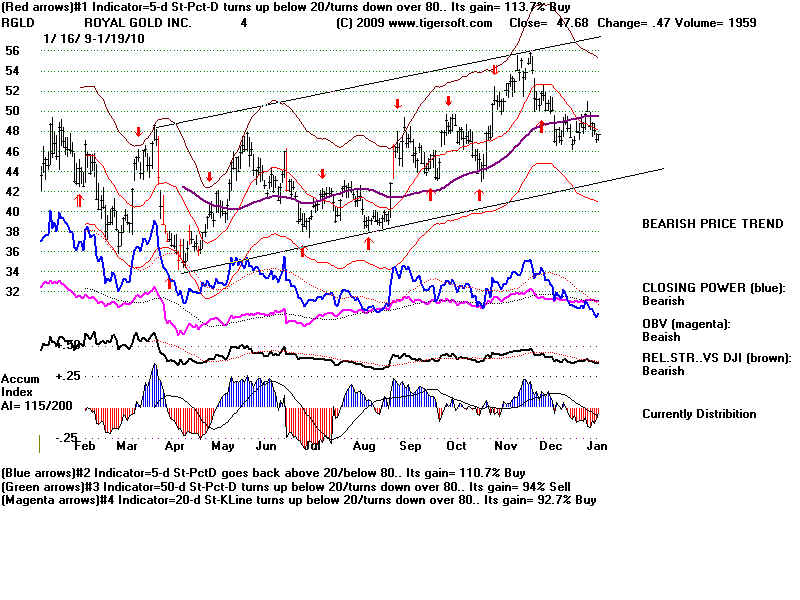
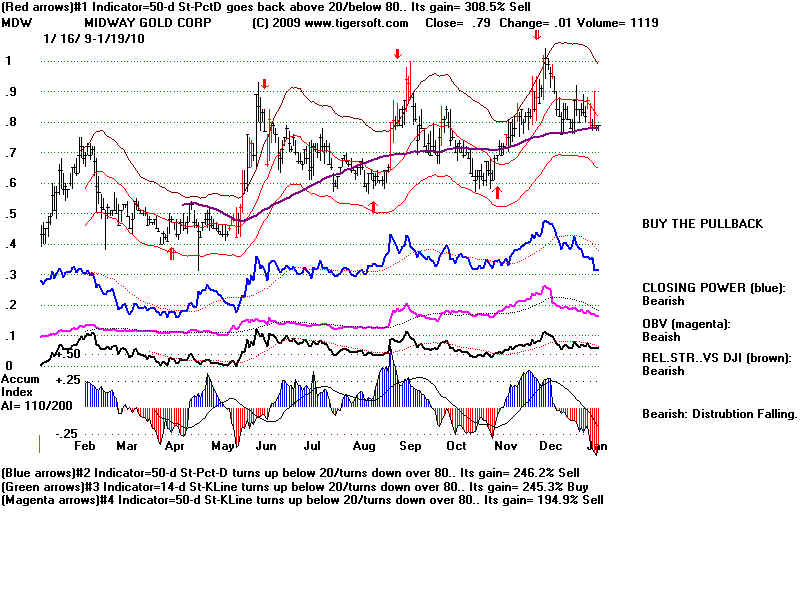
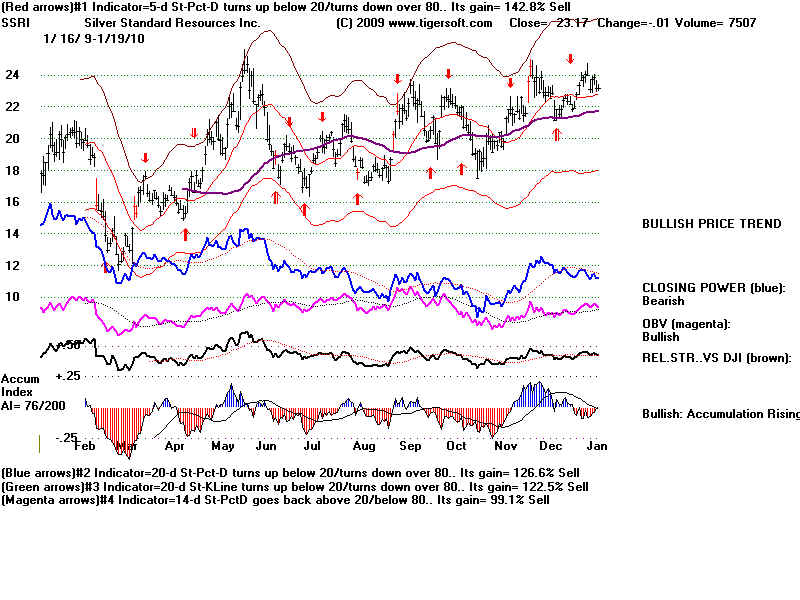
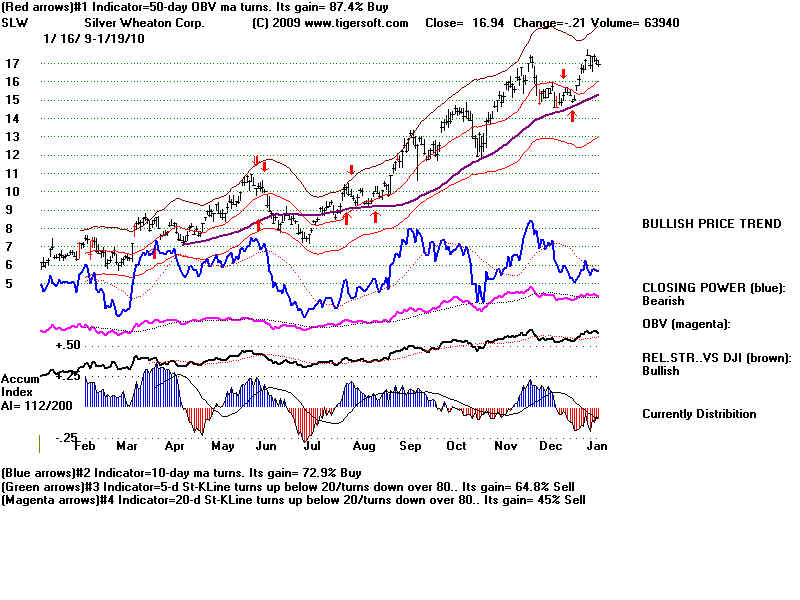
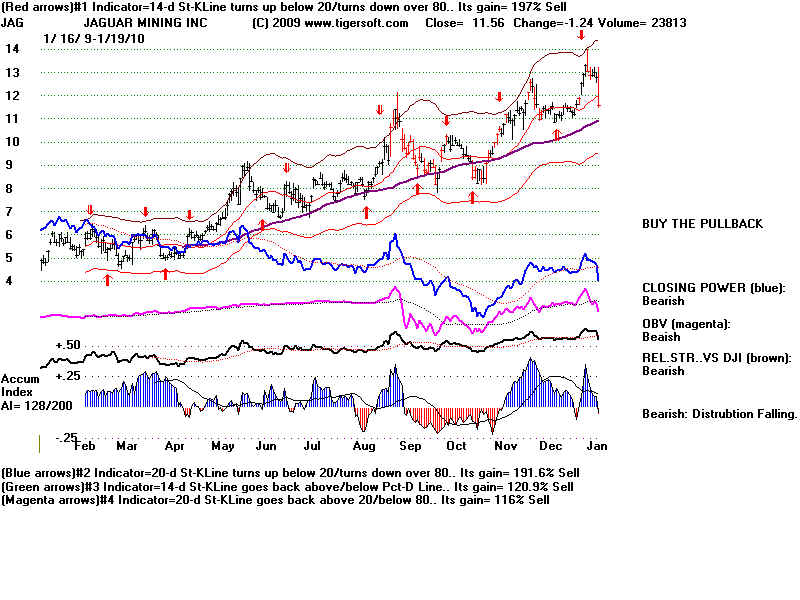
The
first line of each Gold stock chart below shows the best system's trading
gains, optimum Stochastics trading system and the current Buy or Sell status of each
stock. The Power-Ranker lists these for easier study.
|
 TigerSoft
News Service 1/20/2010 www.tigersoft.com
TigerSoft
News Service 1/20/2010 www.tigersoft.com