TigerSoft's Elite Stock Professional Report
2/29/2008 -
(C) 2008 Wm. Schmidt, Ph.D.


Abbreviations:
price versus 50 day ma
AR = Above rising  (Bullish)
BF = Below Falling
H = 12 month high
L= 12 month low.
Current Accum. Index = IP21
TISI = 21-day ma of IP21
A = above
U = Under (Bearish)
SS = Sell Short
BO = Breakout
-------------------------------------------------------------------------
---- BUYS:----
AI/200 Symbol Close IP21 High/OBV Confirm ITRS
------------------------------------------------------------------
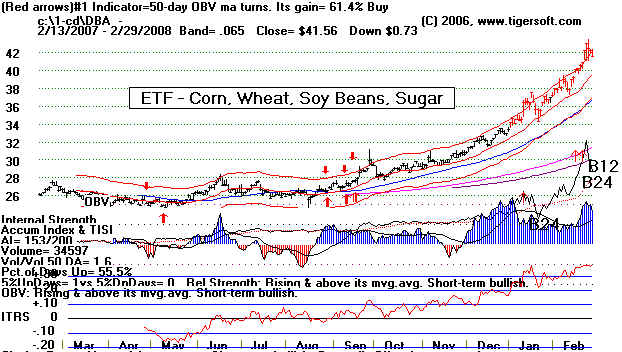
153 DBA - Corn, Wheat, Soybeans, Sugar ETFs
 183 DBC - Commodities-ETF 37.15 -.55 IP21=.45 OBV near NH. ITRS=.26
D-fund will pursue its investment objective by investing in a
portfolio of exchange-traded futures on the commodities comprising
the index, or the index commodities. The index commodities are light,
sweet crude oil, heating oil, aluminum, gold, corn and wheat.
179 SID 37.39 -.88 IP21=.20 ITRS=.41 OBV at NH running.
Companhia Sider?rgica Nacional (CSN) primarily operates as an integrated
steel producer in Brazi ... No long term chart available.
Buy on pullback below 34.
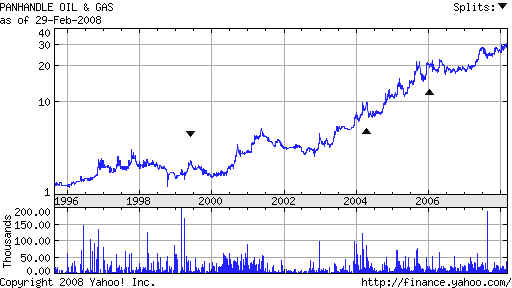
165 PHX Panhandle Oil and Gas 30.49 +.49 .35 at 12 mo high OBV-NC ITRS=.20
183 DBC - Commodities-ETF 37.15 -.55 IP21=.45 OBV near NH. ITRS=.26
D-fund will pursue its investment objective by investing in a
portfolio of exchange-traded futures on the commodities comprising
the index, or the index commodities. The index commodities are light,
sweet crude oil, heating oil, aluminum, gold, corn and wheat.
179 SID 37.39 -.88 IP21=.20 ITRS=.41 OBV at NH running.
Companhia Sider?rgica Nacional (CSN) primarily operates as an integrated
steel producer in Brazi ... No long term chart available.
Buy on pullback below 34.
165 PHX Panhandle Oil and Gas 30.49 +.49 .35 at 12 mo high OBV-NC ITRS=.20
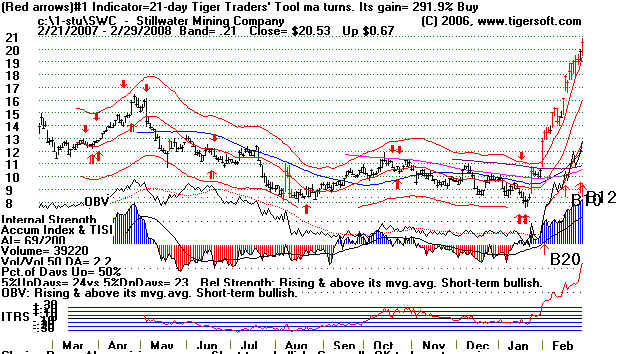
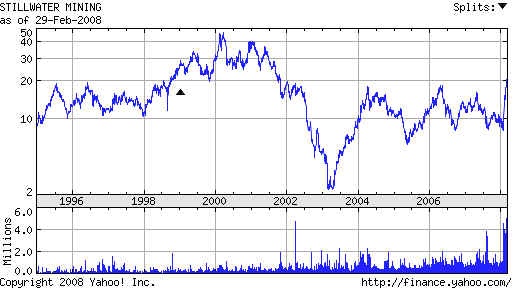
 69 SWC Stillwater 20.53 +.67
at NH and OBV confirms. B12 B20
Stillwater Mining Company engages in the development,
extraction, processing, refining, and marketing of palladium,
platinum, and associated metals in Montana, the United States.
Please see my Blog about platinum.
http://www.tigersoftware.com/TigerBlogs/02-24-08/
69 SWC Stillwater 20.53 +.67
at NH and OBV confirms. B12 B20
Stillwater Mining Company engages in the development,
extraction, processing, refining, and marketing of palladium,
platinum, and associated metals in Montana, the United States.
Please see my Blog about platinum.
http://www.tigersoftware.com/TigerBlogs/02-24-08/
 16.5 had been high.
---- SHORT SALES: ----
Stock Close AI/200 IP21 OBV Confirming --------------------- ------- ----- ---------------- ACMR 8.57 +.02 93 -.30 yes at NL confirmed by OBVCACB 10.16 -.23 60 -.35 yes at NL
CBEY 16.39 0.43 93 OBV at NL
LNET 9.31 -.30 91 IP21= -.40 yes at low.
See Blog to be done 3/2/2008 --
Mostly stocks above their rising 50-day ma are listed here. BF= below falling 50-day ma
Positive Accumulation Consistency for the last year.
199 DUC 11.02 -.20 ITRS=.14 IP21=.07 H=11.02
198 KTEC Key Techn 35.31 -.58 ITRS=.10 IP21=.25 H=38.8
198 TRNS 7.43 +.50 ITRS=.12 IP21=.35 H=8.03
191 KEQU 17.78 -.22 ITRS=.10 H=20.74
194 BCF Burlingtom Coat Fact 17.20 -.51 Fll back from 12-month high.
193 BBL 64.30 -2.13 just above flat/decl 200-day ma Very Strong OBV H=78.36
192 PBR 117.75 -7.52 OBV strong...IP21=.14 ITRS=.21
This has flat resistance at a set of 4 tops at 119-120. At rising 21-dma
186 IGE Natl Resources 131.75 -5.07 IP21=.50 OBV very strong... H=138.63 Red Sell.
184 SVT Servotronics 19.35 -.05 IP21= .25 OBV is very strong ITRS=.65 H=20 thin
183 RIG 140.51 IP21=.15 ITRS=.14 H=150. OBV is lagging.
183 DBC - Commodities-ETF 37.15 -.55 IP21=.45 OBV near NH. ITRS=.26
179 SID 37.39 -.88 IP21=.20 ITRS=.40 OBV at NH running.
178 ADRE Emerg.Mkt 52.25 IP21=.25 ITRS=.08 H=60.1 just above at falling 50dma
177 ISYS
24.34 -.06 H=28 Recent bulge of Accum, Strong OBV ITRS=.17
177 JLN
8.00 -.15 at falling 200-day ma.
177 BBNK
21.35 -.09 recent bulge of Accum. Very weak OBV at 50-dma
***177 HCH
165.52 -3.98 Thursday's high at 170 was confirmed by strong OBV and
IP21>.70
***177 GSG
58.41 -.75 near NH PBV confirmed. IP21=.25 ITRES=.22
175 MOS
111.30 -1.70 Reached upper band. Falling back. IP21=.10 Hot group.
173 FCX
100.86
-5.71 H=120 OBV NH
.. looks like right shoulder.
***173 NGT
28.47 +.19 H=29 Recent bulge of Accum. IP21=.35 OBV very
strong. Thin
173 EBIX
76.00 +1.00 Weak OBV IP21=.60
ITRS=.20 Testing H=77.62
172 DNR
31.89 -.78 IP21=.20 OBV at NH ITRS=.28 Back to the old
highs.
170 DBE Power Shares Energy 38.57
-.18 OBV at NH... IP21=.37
ITRS=.20
170 AZS Ariz Star Res
18.28 -.12
previous bulges of accumulation and IP21>.50 . Very thin.H=19.5
167 GGB
32.77 -1.04 34.5=H Strong OBV IP21=.15
167 CF *fertilizer
122.08 -4.14 131=H OBV confirmed high. IP21=.19 ITRS=.30
166 ATW
93.09 -5.26 105=H OBV is strong. IP21=.13
164 EWZ Brazil
83.53 -4.67 H=88.77 OBV is strong IP21=.15. False breakout.
==================================================================================
===================================================================================
======= At New High or Close ========-
Necessary conditions
AI/200>140
IP21 (Current Accum.)>.25
AI/200=>140
confirming OBV
Itrs>.05
There are very few stocks that
meet this conditions.
Bearish = NNC - S9 - IP21 on new Stock
high closing.
IP21 bulge - over 45
AI/200
Symbol
Close IP21
NH High/OBV ITRS
-------
-------- -----
------
---------------- -----------
141 AGT
Apollo Gold 0.68
CPS
Buy out
165
PHX
Photoectron Corp 30.49 +.49 .35 at 12 mo high
OBV-NC ITRS=.20
new issue SD
37.64
69
SWC
Stillwater 20.53 +.67
at
NH and OBV confirms. B12 B20
16.5
had been high.
VLNC VLNC
3.67
+.16
=======================================================================
Table 4  =======  BUY B12 at 12 mo highs  ========
          AI/200 should be at least 100.

DBA   ETF=Commodity  41.56 -.73 IP21=.48   NH yes
SWC   Stillwater     20.53 +.67  at NH and OBV confirms.  B12 B20
                                                      16.5 had been high.
Best - short Only Stocks also with an IP21<-.09 and over $5.
       AI/200

     With the market down already 8% from its highs and a new red
   Buy signal from the NASDAQ, I post only the stocks here that
   a considered "bearish" among the stocks that have recently made
   a new lows.  We would also want to look at high volume new lows,
   because these might be special situations.
     There is good evidence that the stocks when an AI/200 score less
   than 62 are weaker.  Tax loss selling is now a bearish factor for
   them.
=======================   Bearish and New Lows ============================
AI/200 should be below 62 here.  Stoch should be below 21-day ma.

Stock    Close           AI/200   IP21   OBV Confirming
---------------------   -------  -----  ----------------
BONT 5.72 15 -.14 yes
ETM 11.17 17 -.25 yes
CSGS 11.35 34 -.12 yes
AGYS 12.67 11 -.22 yes
NSM 16.47 26 -.21 yes
BYD 21.09 37 -.25 yes
XING 6.62 27 -.04 yes
C 23.71 12 -.04 yes
See bearish charts shown on Blog for March 2,2008