------------------------------------------------------------------------------------------------------------------------------
Materials
for April 4, 2015 Tiger Software Meeting
(C) 2015 William Schmidt, Ph.D. www.tigersoft.com
Free San Diego Tiger Users'
Group Meeting
Saturday, April 412:45 - 3:45 La Jolla Coco's

4280 Nobel Dr San Diego,
CA 92122
Across SW corner of University Town Center. In Costa Verde Shopping Center.
-------------------------------------------------------------------------------------------------------------------------------
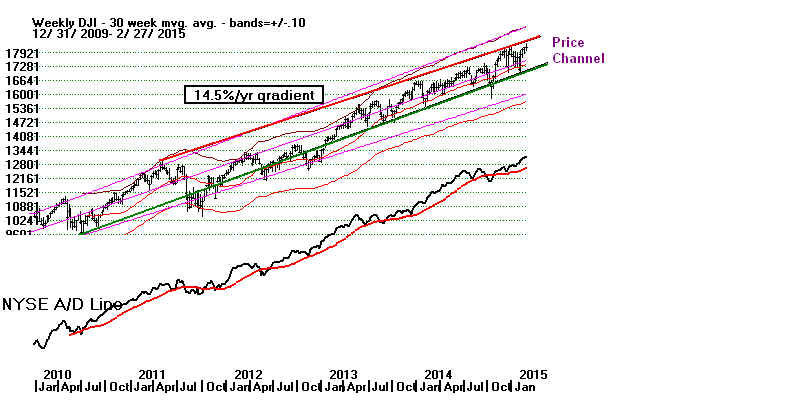
Hi, Tigers! Let's get together and celebrate
more than 6 years of bull market. Peerless is still
on a Buy. Believe it or not, seasonality is
now quite bullish!
But how might we get a new Peerless Sell signal?
Is the Fed really going to raise interest rates
and jeopardize the limited economic recovery?
What do you think?
Peerless is still bullish. But not be much. Are you?
April brings rallies 75% of the time. But how can the
market go up with the economy slowing down and
interest rates going up. That was a recipe for disaster
in 1929 and 1937!
We've talked about the importance of Accumulation/Distribution,
NYSE breadth, volume, 5-day ma monetum and price chart patterns.
Now let's add to that a discussion of Tiger Candle-Sticks.
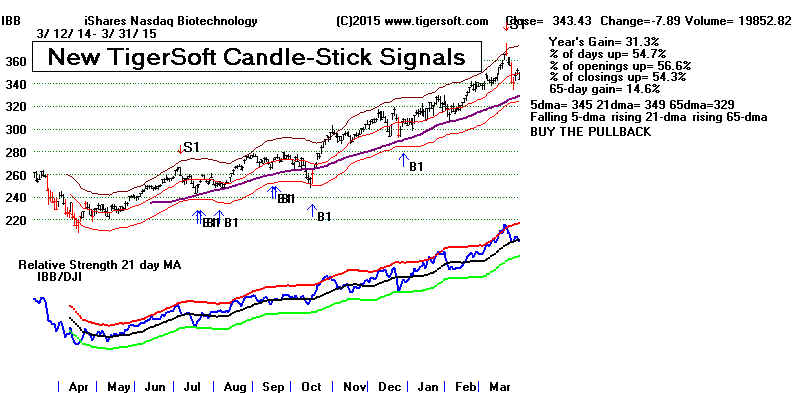
Tiger's charts feature signals based on Candle Stick. Its CS charts
show red and blue "popcicles", "meat cleavers",
"all-embracings",
"ants on a stick", "dynamite sticks", and "3 men
marching". These
are our terms, not the standard Japanese terms.
Classic candle-sticks have lots of strange names. But I'm not sure
that most have as much intermediate-term importance as the ones
I have named and caused to produce signals.
In any case, as the market becomes more and more ripe for
the "big one", i have gone back over a lot of candle-stick charts
to build some reliable rules we can use. Many times they tell us
what our Closing Power already says. But every so often, they
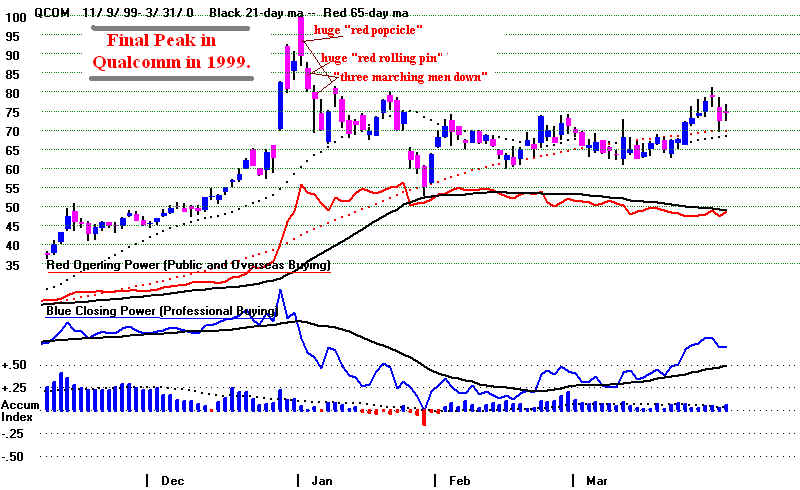
appear independently at critical junctures. When the red candle-sticks
are blatant and clear-cut as Qualcomm's final huge "red popcicle",
SELL.
It may be as Groucho said in 1929: "The jig is up."
Click here to see how red Tiger candle-sticks called many an
important top: Bearish Candle-Sticks.
And called many bottoms: Bullish Candle Sticks.
Certain patterns repeat over and over again, quite flagrantly.
I will be working on providing a list of these each night on
the Data page: BULLCAN.exe and BEARCAN.exe
....................................................................................................
All in all, there'll be plenty to talk about. I hope you can
come.
It should be real fun to bring all our experience and knowledge
together to figure out what Wall Street has in store for us.
Join us this Saturday. We'll make it worth your while.
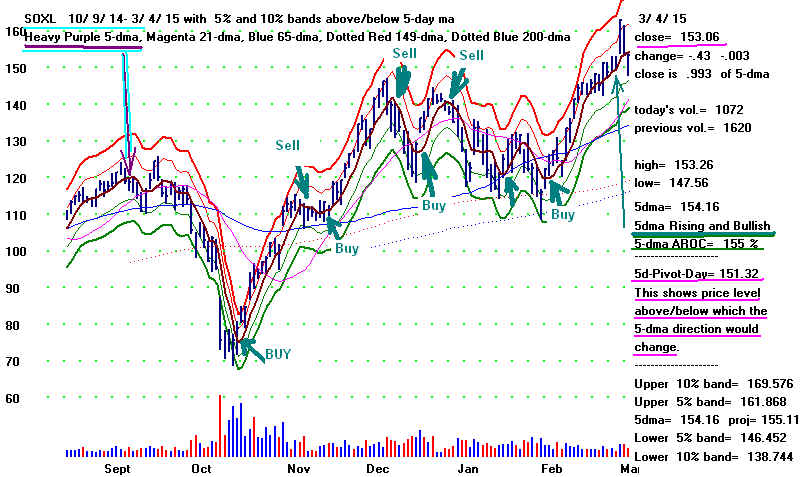
Review from Last Month:
We have some
exciting new short-tools for getting in and
out of fast-moving stocks, commodities, currencies and ETFs.
The new trading tools can really help in this weakening
They show clearly where to sell and when to buy the
strongest and weakest stocks, when a reversal takes
place.
Suggestion: Screen all stocks and
find those best
traded with 5-day ma penetrations
and trade
then using the "key
pivot-points" showing when
the 5-day ma has changed direction.
A reversal has started. How serious is the threat of
rising interest rates? What are the Bank stocks and bonds
telling us. Down Volume suddenly has picked up.
The NASDAQ seems to have stalled at 5000-5250, the old high
from 2000. The number of new lows has not expanded
much.
But could this be the beginning of the end of the 6-year's bull
market? What would it take to get a Peerless Sell and for
Peerless to tell us a major top has been made?
There have only been 3 longer DJI bull markets
since 1928. How did they end?
OVER-EXTENDED?
But there's hope. We could be getting another good buying
opposrtunity. March is usually a very bullish month.
Just how bullish? What about in rising markets?
What about in the third year of the Presidential 4-year cycle?
What about
when a Democrat is President and Republicans
control
Congress in 1947-1948? Or 1996-2000? Forbes
analysis?
How about the NASDAQ's challenge of 5000? Biotechs
rose today (Wednesday) even as the DJI fell more than 100.
Along with oil stocks, biotechs are often among the last
groups to top out ar the end. What at about the the highest
UP% stocks, those that rise the more days than any others?
What stocks could carry the NASDAQ up more?
Is AAPL capable of any more heavy lifting?
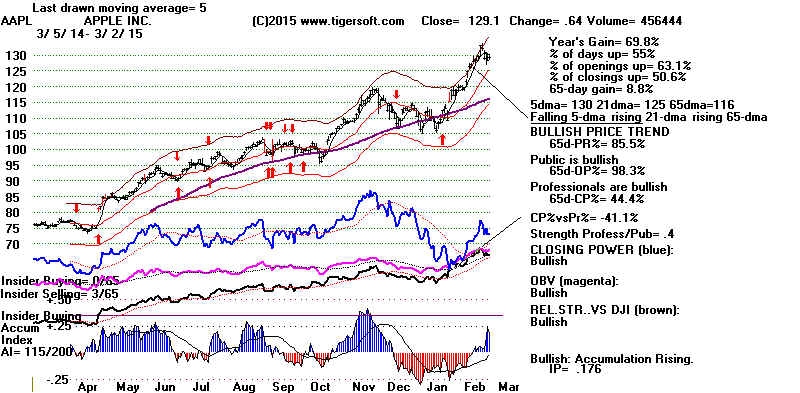
What is the short-term trend of AAPL? When can we get
back aboard this fast moving train?
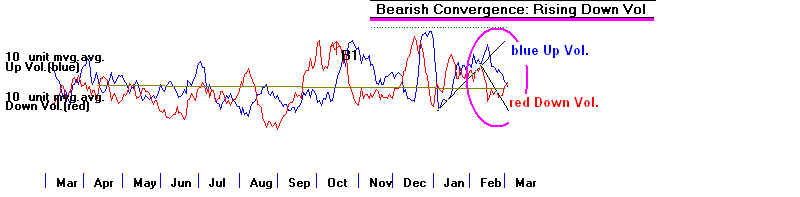
What about the rising Down Volume on the NYSE?
Is that a sign of simple profit-taking? A sign that
dividend stocks are being sold as rates go higher?
Highest UPO% Stocks: There are only a handful of stocks
and ETFs that have risen more than 57% of the time on any
given day for the last year. Fewer of these have a CLOSEUP%,
that reliably close higher than their opening. How safe
are these HIUPPCT stocks to buy. These stocks can now
be screened for and are also now downloadable
as a group from the Tiger Data page. Run HIUPPCT.exe.
Do you trade short-term. Michael M. suggested a report
showing how stocks do after the opening to the close
given various sized openings away from the previous
close. Now we have a new report that shows that.
FAST-MOVING
TRAINS
Lots of folks want to know how to get aboard a fast-moving
stock. This can be dangerous. One can pay too much
and not know when to sell. WE CAN HELP HERE.
Getting aboard a fast-moving train is dangerous.
But Tiger has new tools to help you. Our Closing
Power has a companion indicator now for this.
And the new tools may get us out before Closing
Power does.
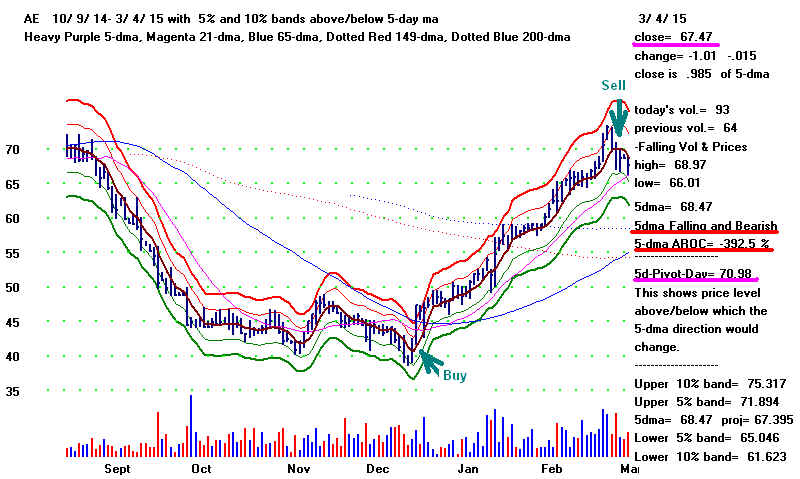
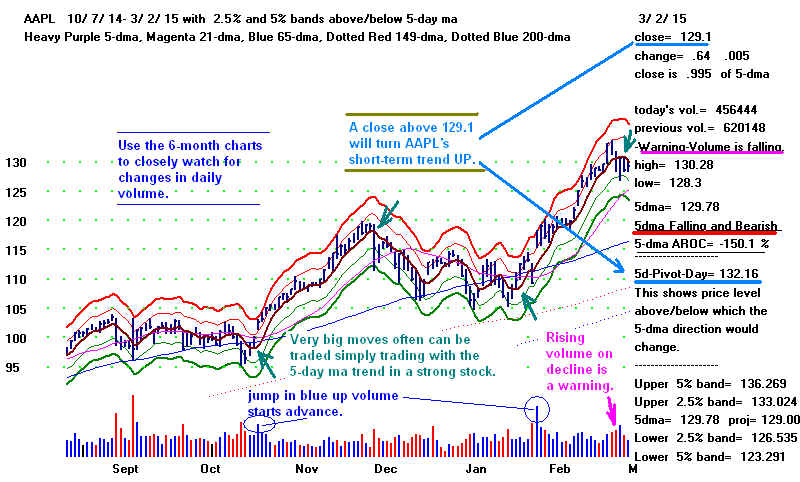
Our new six month chart shows a 5-day ma, bands around it,
the velocity of the 5-day ma and the "pivot point". This
is the point beyond which the 5-dma would reverse |
direction. A lot of stocks' best moves can be timed
using the 5-day ma. We'll study this closely at the meeting.
Late in a Bull Market, how do we find the last ETFS
standing, the ones that are still the leaders. We
have a new ranker, the Pct Up%, the Opening Up%
and the Closing Up%. We can easily find the highest
stocks in each category and the lowest, too, for
short selling.