TIGER B16s in 2014
14-S's Are Sampled Alphabetically.
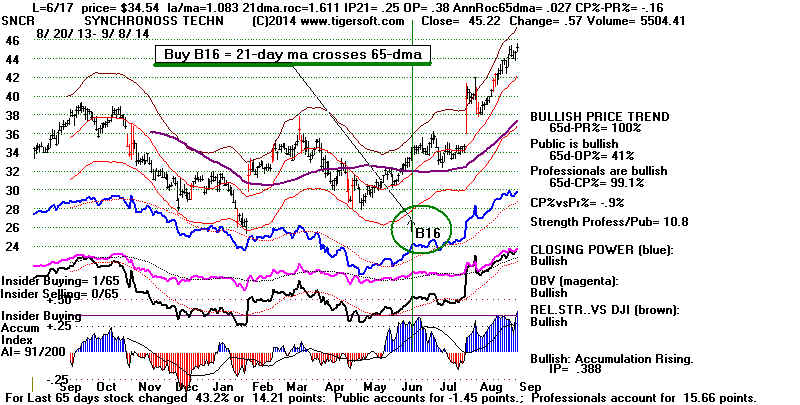
The B16 is the 21-day ma crossing the 30-wk ma.
Findings:
If
LA/MA under 1.05, 81% of Buy B16s were profitable.
Here we will first test and qualify the signal first by simply seeing
how well the first 30 Buy signals did making 10% before they make
10%. We then look at the results of these 30 Buy B16s to see
what best qualifies them as likely to be successful. Following
that, we see how well trading the first Closing Power trends in the
aftermath of the B16 does.
If the B16s has not achieved or lost 10% and it occurred within
three weeks of the end of the period, the case is left out here
as not having enough time to play out. But if it falls or rises in
less than three months, it is counted.
I leave out low-volatility dividend stocks and bond funds.
B16s: 10% Success or 10% Failure?
In the randomly chosen
sample of 30 Buy B16s, there were 18 successes
9 failures, and 3 that did not achieve either
gain or loss. The success rate
was 60%.
date
la/ma
21 IP21 OPct Ann
CP%- Consequence
dma
Roc
PR%
ROC
---------------------------------------------------------------------------------------------------------------------------------
SA 6/24/2014 1.133 2.558 .128 .135
.522 -.15 Fell from 9.06 to 8, rose to 11.5 Failure.
SAAS 9/8/2014 1.071 1.536 .31 .285
-.041 -.09 Fell from 9.27 to 7.6 then 9.5. Failure.
SABA 7/18/2014 1.068 2.281 .404 .720 .462
.01 Rallied from 12.65 to 14.5 in six weekes Success.
SAD 4/28/14 1.045 1.181
.078 .262 .248 .37
Fell from 24.33 to 23.5 and rose to 27.5 in five weeks.
Success.
SALM 7/1/2014 1.058
1.485 .347 .493 -.177
.26 Fell from 9.56 to 7.90. Failure.
SAP 4/9/2014 1.032 .594
.027 .242 -.145 -.28 Fell from 81.44 to
74.2. Failure.
SATS 5/20/2014 1.057
1.556 .515 .333 .095
.01 Rose from 51.20 to 54 and then fell to 48. Trading Range.
SB 6/30/2014 1.061 2.177 .238 .027
.313 .01 Fell from 9.77 to 7. Failure.
SBBI 6/16/2014 1.032 1.348 .336 .351
.758 .02 Rose from 31.32 to 36 in two weeks.
Success.
SBLK 6/24/2014 1.098
2.266 .150 .292 -.363 -.25 Fell
from 13.33 to 10.5 and then rose to 15.39 Failure.
SBR 9/8/2014 1.012 .511 .170
.132 .115 -.49 Rose from 51.44 to 63.5.
Success.
SBS 6/2/2014 .982 .121
-.027 -.063 .012 .11 Rose from 9.68 to 11
on three weeks. Success
SBSI 7/28/2014 1.037 1.003 .518 .577
-.434 -.07 Rose from 29.29 to 34.5 in two months. Success.
SCHL 7/1/2014 1.034 .783 .204
.193 -.024 -.040 Still
in trading range.
SCLN 5/22/2014 1.057
.996 .023 .116 .164
.010 Rose from 5.07 to 7.20 in three months. Success
SCON 5/28/2014 1.158
3/237 -.111 .577 .411 -.200
Rose from 2.89 to 3.20. Success
SCS 4/11/2014 1.056 1.854 -.028 .290 .263
-.130 Rose from 16.47 to 17.90 and then fell to 15. Failure.
SCSS 5/16/2014 1.011 .670 -.044 .047
.393 -.310 Rose from 18.91 to 22.5 in three months.
Success.
SCX 6/9/2014 .979 .885
.140 .137 -.830 .480 Rose
from 15.06 to 18.7 in three months. Success.
SDLP 6/4/2014 1.080 1.057 .177 .532 .346
0 Rose from 33.70 to 36.00 in two
months. Trading Range.
SFEG 7/4/2014 1.016 5.621 .347 .285
2.045 .240 Rose from 0.06 to 0.29 Success.
SGC 6/10/2014 1.135 1.269 -.068 .258 .344
0 Rose from 17.87 to 23.0.
Success
SGNT 6/12/2014 1.036 1.164 .312 .272 .175
-.410 Rose from 23.11 to 29 in 10 months. Success
SHG 3/28/2014 1.046 .567 .195
.236 -.048 -.580 Rose from 43.59 to 52 in 5
months. Success
SHI 7/10/2014 1.041 1.112 .199 .512
.588 -.550 Rose from 28.87 to 34.70 in two months.
Success.
SID 7/21/2014 1.135 2.789 .114 .446 1.017 -.270
Fell from 5.24 to 4.19 in five weeks. Failure.
SIFY 6/9/2014 1.076 1.902 -.375 .289 .152
-.66 Rose from 2.17 to 2.60 in a week. Success.
SIGI 6/24/2014 1.014 .480 .155
.139 .216 -.05 Fell from 24.70 to
22.2 in five weeks. Failure.
SIGM 7/10/2014 1.004 1.907 .157 .457
0 .03 Rose from 4.55 to
5.09 om six weeks. Success
SIM 5/7/2014 1.052 .556 .198 .145
.379 .31 Rose from 12.20 to 15 in ten weeks. Success.
SKM 5/14/2014 1.046 .989 .352
.400 .495 -.04 Rose from 24.03 to 21.2 in 10
weeks. Success.
------------------------------------------------------------------------------------------------------------------------------------------
Where LA/MA>1.1 there are 2 successes and 2 failures.
Where LA/MA >1.05 and LA/MA <1.10, the success rate was only 30%.
3
successes
5
failures
2
trading ranges
Where LA/MA >1.00 to 1.05, the success rate was 78.6%
11
successes
2
failures
1
trading range
Where LA/MA <1 there were 2 successes and no failures.