TRADING QUESTIONS TIGER CAN ANSWER FOR YOU

             (C) 2015   William Schmidt, Ph.D.    www.tigersoft.com
             ===========================================

                #1    What Is the Short-Term Significance of
                        A Strong or A Weak Opening
                          in A Given Stock, ETF, etc?


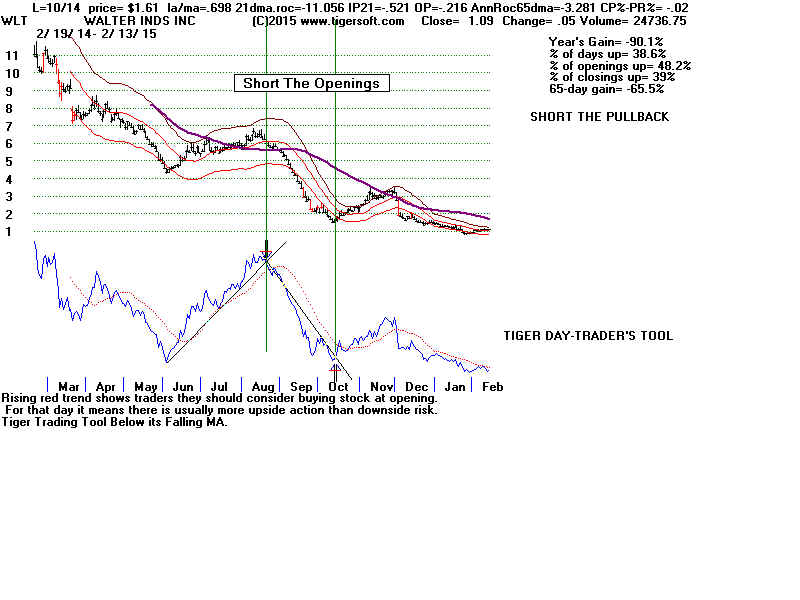
                         Don't be fooled by a strong or a weak opening.
                    With many stocks, the openings are traps for
                    the more emotional and for the broader Public.
                    But not always.  Read more...
           
                 
PEERCOMM + 2015 Graph + Daily Stocks + Symbol
              + INDIC 3 + STATISTICS: Trading Opening Strength


  A table like the one below is generated for your stock based
  upon the last year's data on file.

 
Amount the Opening           Number       Closing's              Avg. Pct. Change
 
is Up or Down from                  of              Pct Change          from Opening
 
the Previous Close               Cases         from Opening
--------------------------------------------------------------------------------------------------------------
>.02 (2%)                                     16              .438   (43.8%)        -.0021 (-0.21%)
                                                                        Typically a decline
                                                                        follows such a strong
                                                                        opening.
.015 to .02                                    19              .536                          -.0055 (-0.55%)
                                                                        Though there a rally more
                                                                         frequently occurs, the avg. decline
                                                                         from the opening to the close
                                                                         is relatively large, more than -1/2%.
.01 to  .015                                   25               .52                            -.0007
.005 to .01                                    43               .58                             .0011
0 to .005                                       53               .585                           .0027
                                                                        very high probability
                                                                        of prices continuing moderatly higher.                   
---------------------------------------------------------------------------------------------------------------------
0 to -.005                                      53              .60                             -.0023
-.005 to -.01                                 35               .476                          -.0033
                                                                        Odds favor a continuation in lower
                                                                        prices.
-.01 to -.015                                 20               .70                             +.0031
                                                                        Rebound must be expected.
-.015 to -.02                                   5               .40                             -.0136
                                                                        Continuation much lower is probable.
<-.02                                              12              .583                           +.0093
                                                                        Rebound is likely.


              #2      Where Should Your Stock Open Tomorrow
                    if It Is Typical for the last 21 days of trading?
                    (You might want to sell it to advantage.  Or
                    buy iot cheaply.)
                        
PEERCOMM + 2015 Graph + Daily Stocks + Symbol
                         + INDIC 3 + STATISTICS: Trading Openings/Closings

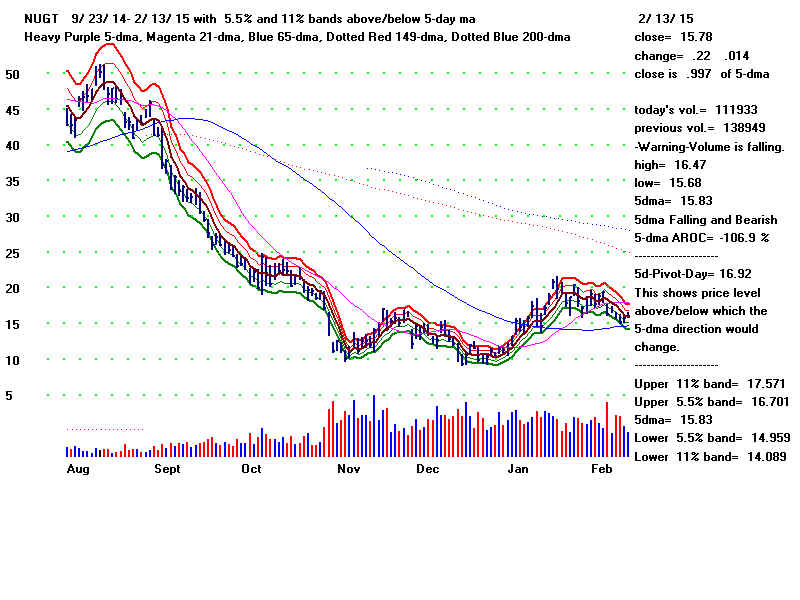
                   Also look at the new 6 month Tiger charts that show
                   bands around a 5-dma and let you study volume more
                   closely.   Short-term traders should probably abide by
                   the direction of the 5-day ma using bands and volume, too.

NUGT.BMP (1920054 bytes)

                #3  Where Should Your Stocks Open and Close
                    Tomorrow based on the Day of The Week?
                    What Is the Best Day of the Week To
                    Day Trade Your Stock?
                     
  PEERCOMM + 2015 Graph + Daily Stocks + Symbol
                         + INDIC 3 + Day of The Week


#4   If Your Stock Has Risen, say, 4 days in A
                    Row, What Are the Odds of One
                    More Day of Gain?  What Is The
                    Avg. Percent Gain for The Last Year
                    in This Situation?
                      
PEERCOMM + 2015 Graph + Daily Stocks + Symbol
                       + Operations + Streakiug Probability


#5  Is Your Stock Most Likely To Be Strong
                    or Weak at the Opening or The Closing?
                    Is Your Stock's Opening Power Rising?
                    Is your Stock's Closing Power Falling?
                    or vice verse.  The pattern here will help
                    you determine when during the day to buy
                    or sell your stock.  Are you tired of having
                    the stock go down right after you buy it?
 
                      
PEERCOMM + 2015 Graph + Daily Stocks + Symbol
                   
        Inspect your's stock's chart.  At the upper right,
                         you see how often the stock has opened higher
                         in the past year and often it closed up or down
                         from the opening.   Below this, you will see a notation
                         that the Public is buying when the Openings have
                         been consistently positive for the last month.  And
                         you will see a note showing that closings have been
|                         above the openings regularly for the last month
                         when you see the chart say that Professionals
                        are net buyers and the Closing Power is above
                        its 21-day ma.


HD.BMP (1440054 bytes)


#6   You want to day trade a stock.  Should you
                   buy or sell it short early in the day?  Is there
                   more risk or reward, based upon subsequent
                   highs and lows?  Inspect a Tiger's charts
                   Day Traders' Tool.  Is the DTT  falling
                   and below its 21-dma, Sell short.  See the example
                   below.  

WLT.BMP (1920054 bytes)