TigerSoft
News Service 9/2/2010 www.tigersoftware.com (C) 2010 William Schmidt, Ph.D.
TigerSoft
News Service 9/2/2010 www.tigersoftware.com (C) 2010 William Schmidt, Ph.D.HOG TRADING WITH TIGERSOFT
USING PERPETUAL CONTRACTS
Charts for 2002-2010
By William Schmidt, Ph.D. (Columbia University)
Author of TigerSoft's Insider Trading Charts
See also
October 7, 2007 Rules for Trading Food Commodities with TigerSoft.
Corn, Cotton, Cocoa, Live Cattle, Orange Juice, Pork Bellies, Soybeans, Sugar and Wheat.
February 22, 2008 Food Commodities Are Going Hyperbolic

USING PERPETUAL CONTRACTS
Charts for 2002-2010
We offer only perpetual contracts' charts. These use the prices
of the month's contract to expire as close as possible to 16 trading days
ahead, but not closer than that. The sum of the volume for all contracts
is used. This allows us to see a year's graph or longer. You will
often see a small price discontinuity where the month used for prices
shifts. We would work with whatever trend that jump or decline that
produces. It seldom interferes with our analysis. We believe a Sell
signal on these Perpetual charts usually translates into a good sell
signal on a commodities' contract that will not expire for one to two
months. The same thing is true with the Buy signals. Trading contracts
about to expire in less than a month is inherently riskier. Normally
we would suggest avoiding that.
The next thing to realize is that normally one need not trade
only one stock or commodity or currency. We think one should
search for the best opportunity among stocks or commodities at
any one time. That means there are times when no position is
advisable. Still, we can see from historical charts what trading
stance would have been advisable for much of the time.
We use some simple rules.
Trading Rules
1) Trade with the Trend of 65-dma (day moving average) unless prices
become extremely overbought or oversold. We want to buy when
the 65-day ma is rising and sell when it is falling. Since that ma acts
as resistance when it is falling we want to sell short on weak rallies
to it and go long on weak dips back to it. Strength and weakness
are a function of:
1) how fast the ma is rising or falling,
2) price patterns, price support/resistance, price breakdowns
and breakouts
3) intenral strength as measured by Tiger's CLosing Power
trend and whether the Tiger Accumulation Index is positive
or negative.
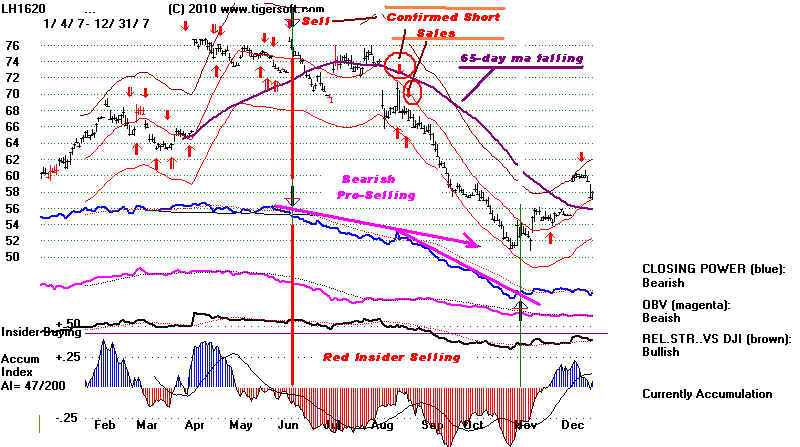
2) Buy when the purple 65-dma has been penetrated to the upside
and the CLosing Power is rising and and Accumulation Index is
positive. Oppositely, sell short when the 65-dma is violated to
the downside and the Accumulation Index is negative and the
Closing Power is weak.
3) Watch for Classic Price Patterns and note where well-tested price
support and resistance holds or is broken. The charts below will show
many examples of this.
4) Use the Automatic Tiger Buys/Sells when they are confirmed by
Tiger's internal strength indicators. If the signal is not confirmed
we would usually wait and act on the confirmation.
A Buy Signal works best when the CLosing Power has just
broken a downtrend and the Accumulation Index is rising and/or
positive.
A Sell Signal works best when the CLosing Power has just
broken an uptrend and the Accumulation Index is falling and/or
negative.
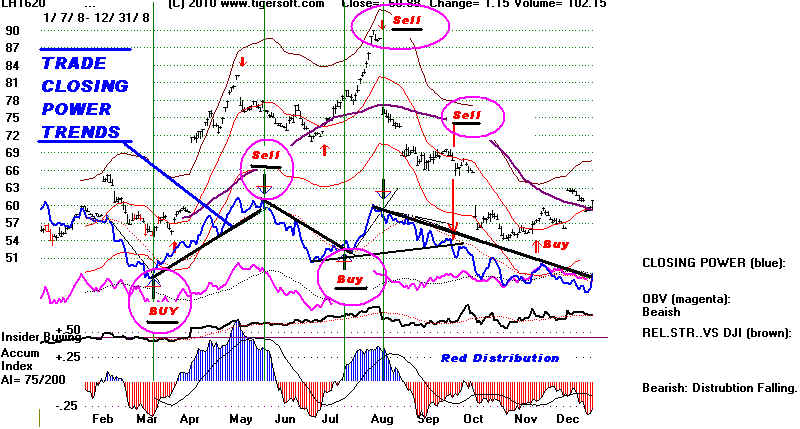
5) Trading with the trend-changes of Tiger's Closing Power is simplest
and generally most effective approach. However, these trend-changes
work best when they are confirmed by the readings from the Accumulation
Index.
6) Confirm the automatic signals and CP trend changes with Tiger's
Accumulation Index.
7) You will may want to take profits at the optimized upper price bands
on long trades and at the lower bands on short trades in conjunction
with breaks in steep Closing Power Trends, especially when the
internal strength indicators do not confirm the move by prices.
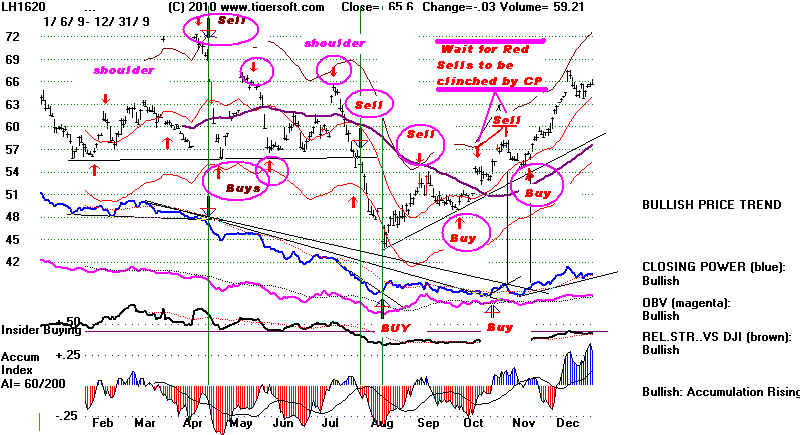
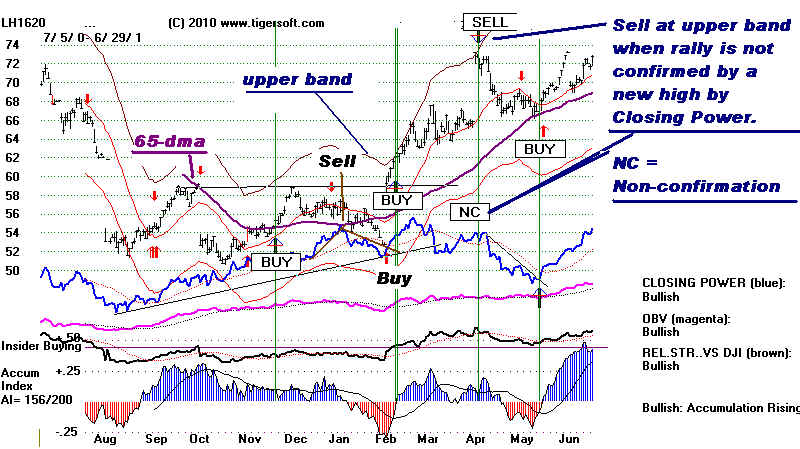
Discussion for this Hogs' Perpetual Contract for 2000-2001.
In December 2000 prices got back above their 65-dma. Since the
Accumulation Index was positive and the CLosing Power was
uptrending this was a BUY signal. Profits were taken when the
next Red Sell appeared or when the Closing Power broke its
downtrend.
Prices next fell back below the RISING 65-dma. That it was
still rising and that the CLosing Power uptrend was not violated
would have prevented a short sale.
In February we were buyers. The Downtrend of the CLosing Power
is violated and prices rocket above the 65-dma. The Accum. Index
moves back above its moving average and turns positive. This
confirms the advance.
In April prices reach the upper band and the Closing Power does
not confirm the move. This is the point to take profits. We would
normally not go short against the momentum shown by the
rising 65-dma unless the Accum. Index was negative.
In May we get a perfect Buy as prices successfully test the
rising 65-dma. We see this because the CLosing Power breaks
its downtrend and the Accum. Index turns positive.
HOGS 2001-2002 SAMPLE TIGERSOFT CHART
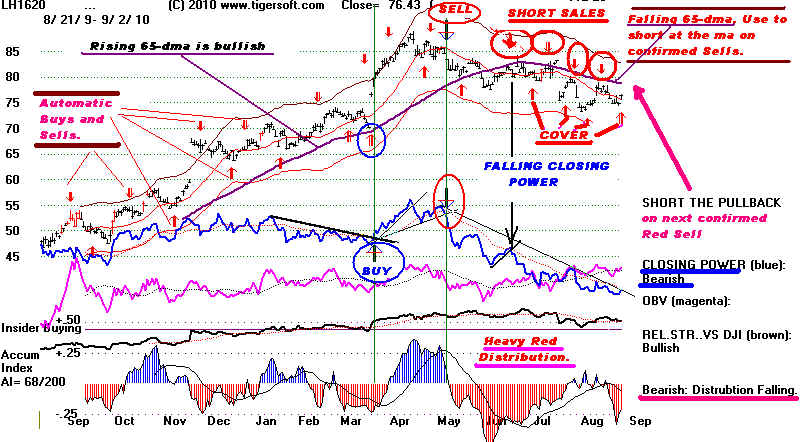
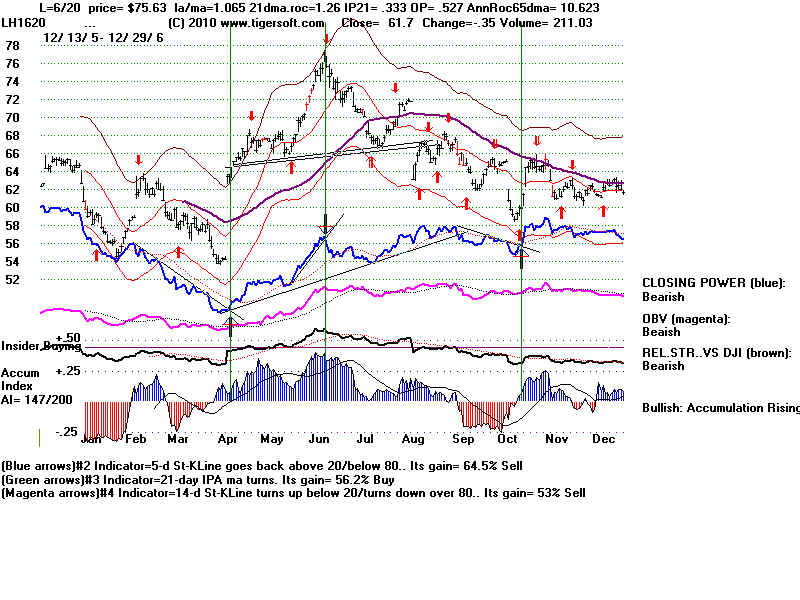
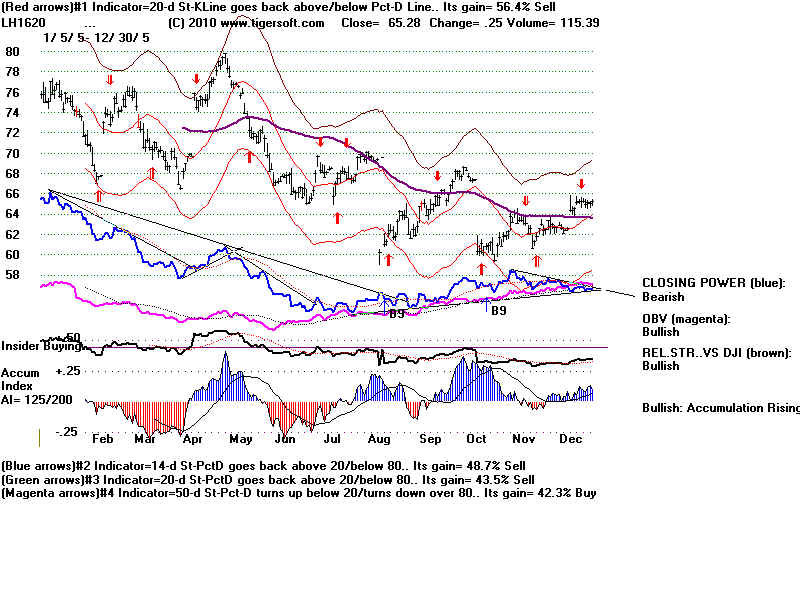
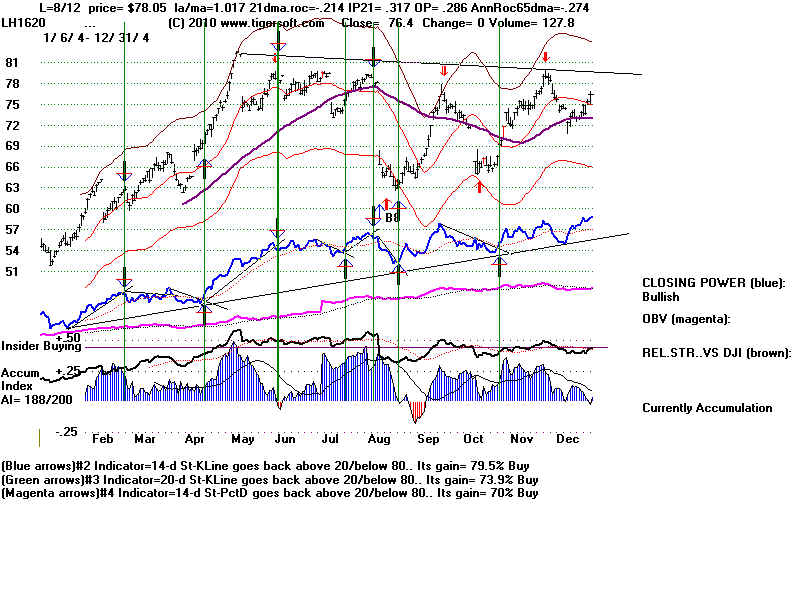
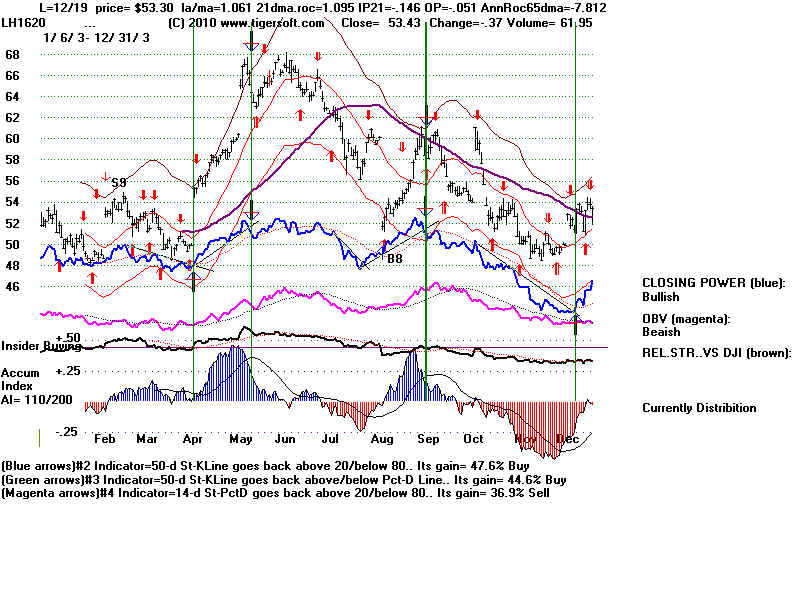
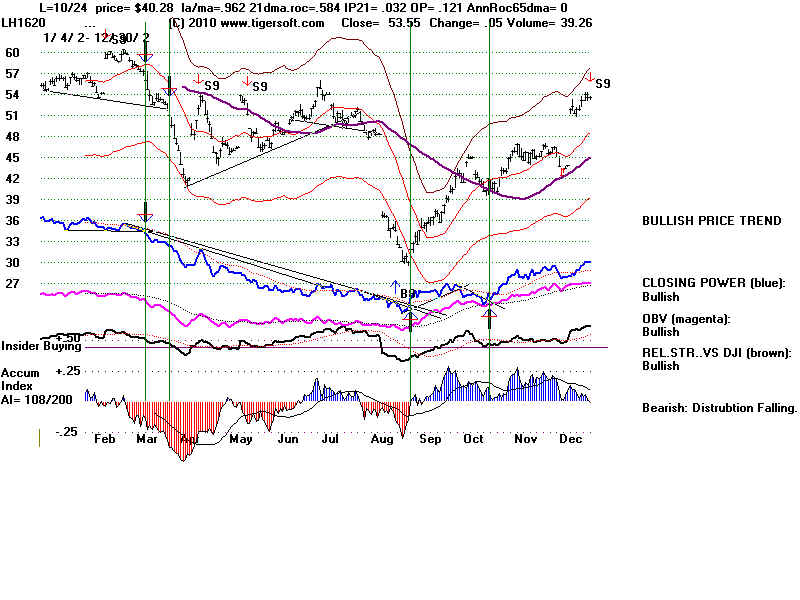
LIVE HOGS PERPETUAL CONTRACT - 2009-2010
The 65-day ma has turned over and is declining. We look to short moves back up to it on
the automatic Sells, so long as the Accum Index is negative (red) and the Closing Power is
declining. Compare this with June- Sept 2009, Sept-Dec 2008, Aug-Nov 2007, Aug-Nov 2006,
May-Nov 2005, Aug-Oct 2004, July-Dec 2003, April-Dec 2002. Note the strong pattern
for weakness in the third quarter of each year.