and BEARISH SPECIAL SITUATIONS
Picks from Late July - September 2010
11/4/2010
(C) 2010 William Schmidt, Ph.D.
11/3/2010
The picks here made use of Closing Power
new highs and lows in conjunction with
confirming highs levels of Accumulation
for the buys and recent steadily low levels
for the short sales. Most were simply
picked using the Bullish MAXCP stocks as
Buys and the bearish MINCP stocks for
short sales. Positions were closed out
when the Closing Power violated its trends.
Steeper trendlines were used after a sustained
move. When the Accum Index was very high
a little more opportunity to advance was
given. See the CP trend-break-lines in the
charts below.
It is believed that the best Buys and SHort sales occurred
soon after the new B7s and S7s, which show extreme CLosing
Power divergences from price.
Trading with the market trend using Peerless helps a lot. In the period shown below
there were no Peerless Sells. Short selling had to be nimble. Breaks in a Closing
Power downtrend are shown below as the basis for covering the short sales.
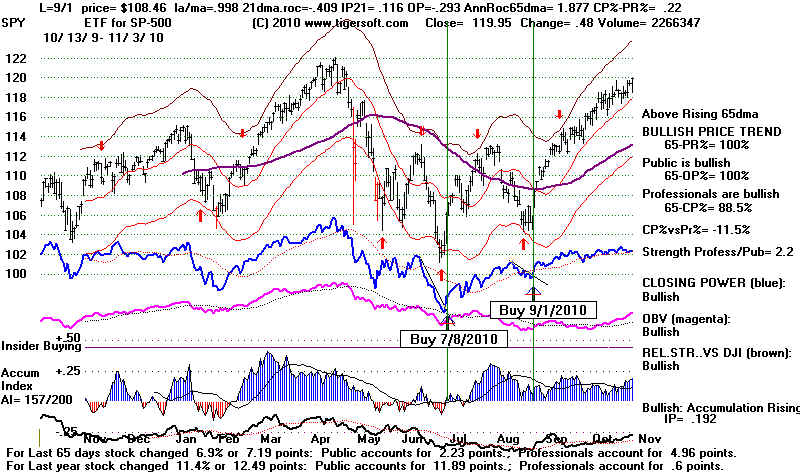
The best buys came soon after a downtrend in Closing Power was broken
following a Peerless Buy. By this rule, the best buying opportunities came
after 7/7/2010 and 9/1/2010. Work down the list and you will some very nice
gains in the stocks below just after these dates. As prices become more
extended in the general market, the quality of new Buys deteriorates. Adding
to positions in the stocks that do the best after a Buy signal usually works
well, especially if you can buy after a minor retreat and another Closing Power
new high.
TOTALS for Special Situations from 7/30/2010 to 9/30/2010
During this time the SP-500 rose from 1101.60 to 1193.55, about 8%.
All 34 Trades. Avg Gain = +10.9%
21 Long Trades. Avg Gain = +12.7%
15 winners' avg. gain = +20.7%
6 losers' avg. loss = - 7.4%
13 Short Sales Avg. Gain = +8.0%
8 winners' avg. gain = +16.5%
6 losers' avg. loss = +5.5%
Regarding long trades, it appears from the data in this study that we can significantly
improve results by not buying the stocks with an AI/200 <140 or an IP21<.22
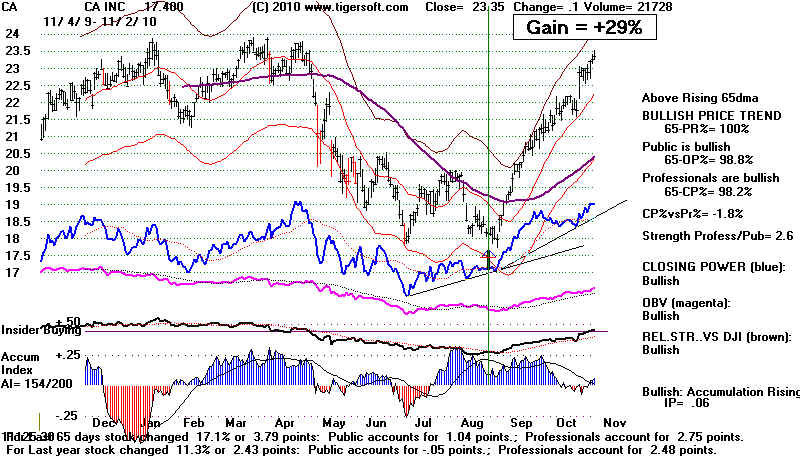
unless they are testing their lows. as CA was.
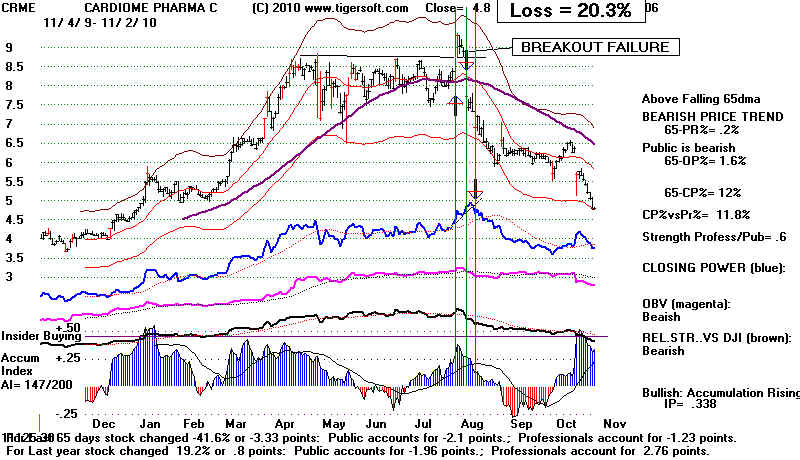
1, LONG 8/5/2010 CRME 9.31 +.57 AI/200=139 (LOW) IP>.36
Loss = -20.3% Watch for false breakouts!
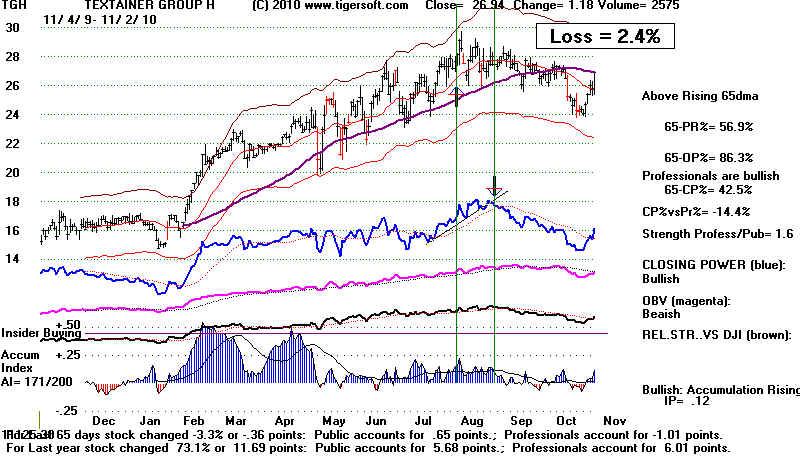
2. LONG 8/5/2010 TGH 28.13 +.43 AI/200=167 IP=.13
Loss = -2.4%
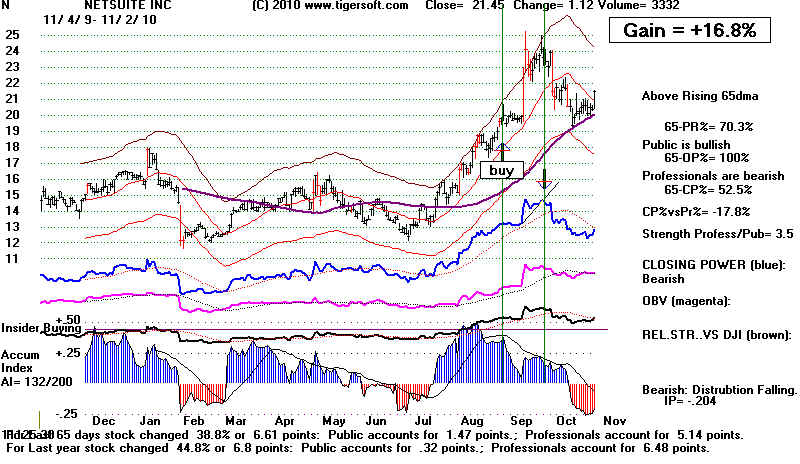
3. LONG 9/1/2010 N 19.58 58 AI/200=139 (low) ip= .35
Gain +16.8%
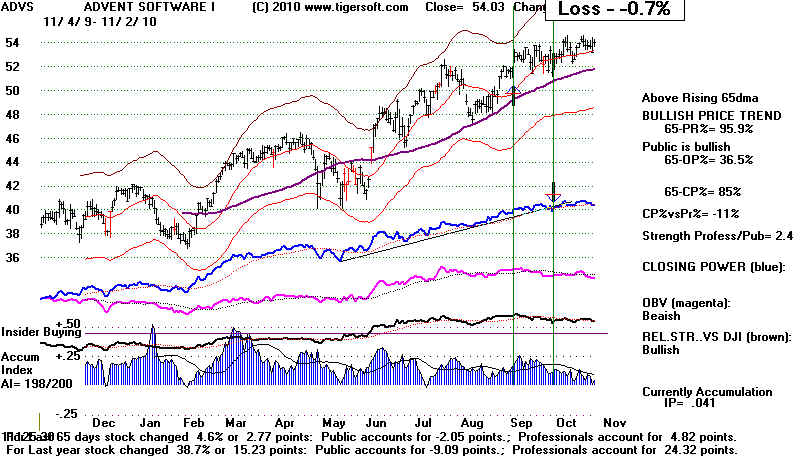
4. LONG 9/13/2010 ADVS 52.82 .8 AI /200=197 IP> .16 (low)
Loss = -5.9%
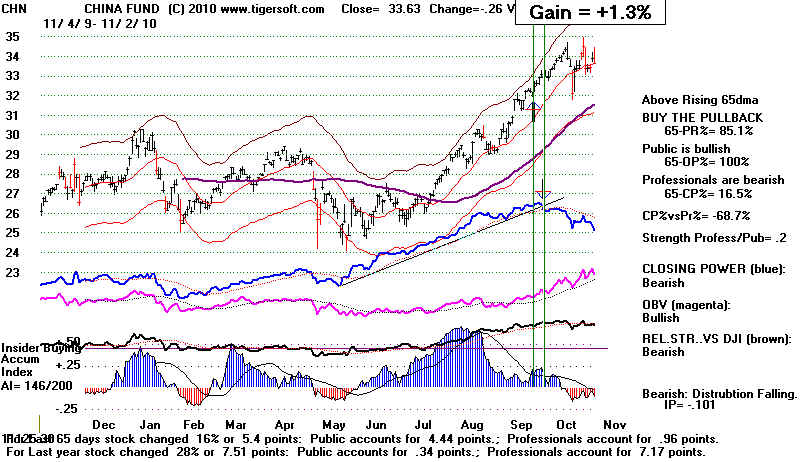
5/ LONG 9/24/2010 CHN 32.49 .5 AI/200=153 IP = .20 low
Gain +1.9%
These 5 lost an average of 2% apiece.
====================================================================================
IMPORTANT
The best gainers generally had very
high levels of current Accumulation, "IP" or "IP21",
above +.46. This is the
horizontal line above which our charts indicate "Insider Buying". level
A/200
IP21 Gain
RDWR
171
.56 +33.4%
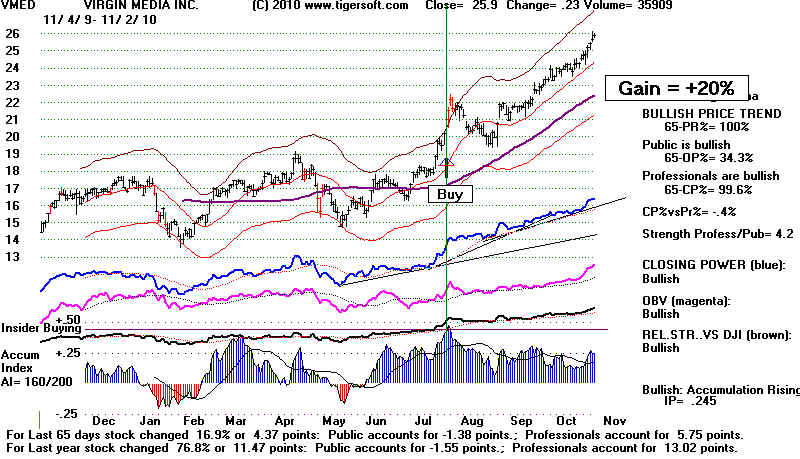
VMED
162
.51 +20.0%
RDWR
171
.56 +33.4%
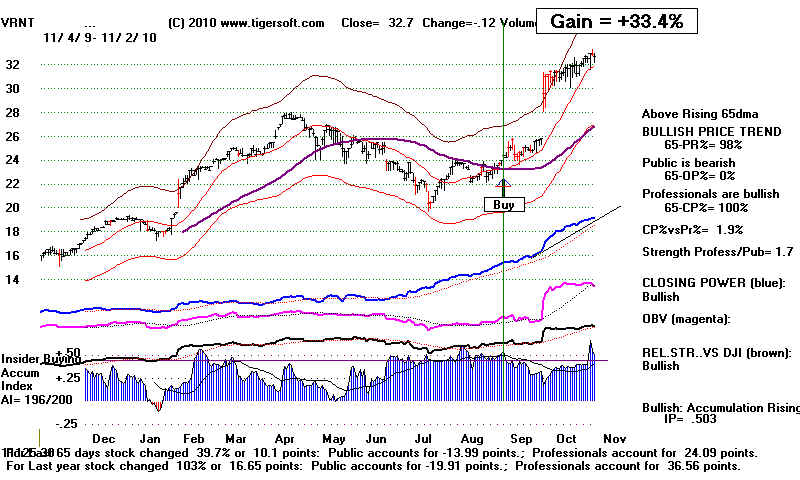
VRNT
189
.50 +33.4%
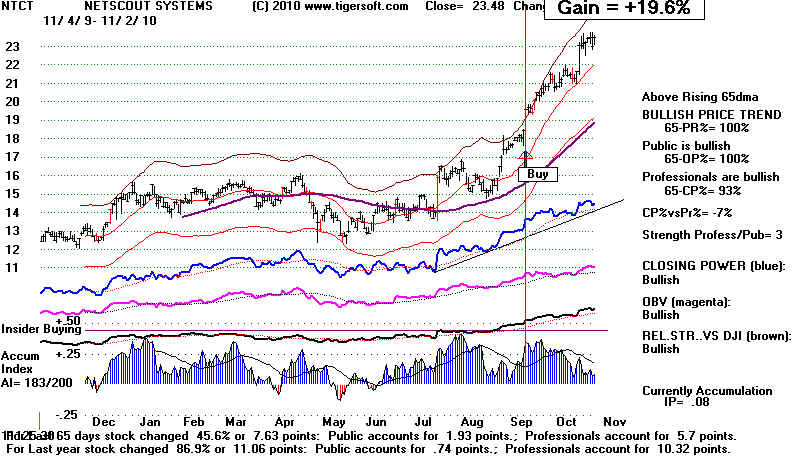
NTCT
182
.47 +19.6%
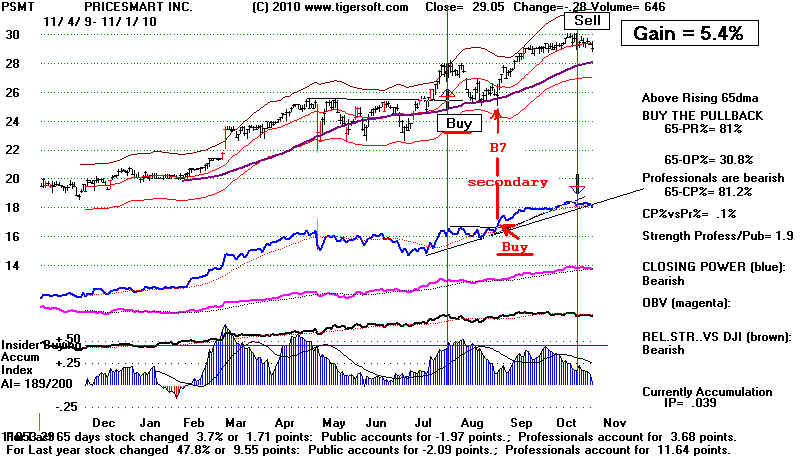
PSMT
189
.45
+5.4%
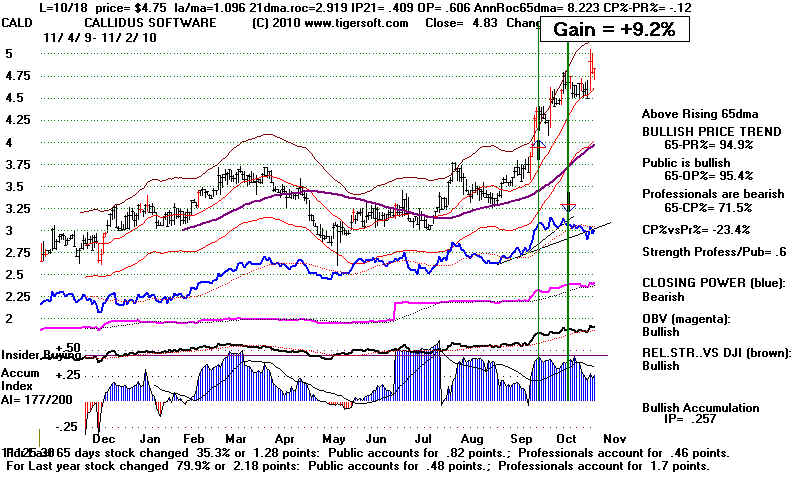
IRS
175
.45
+9.2%
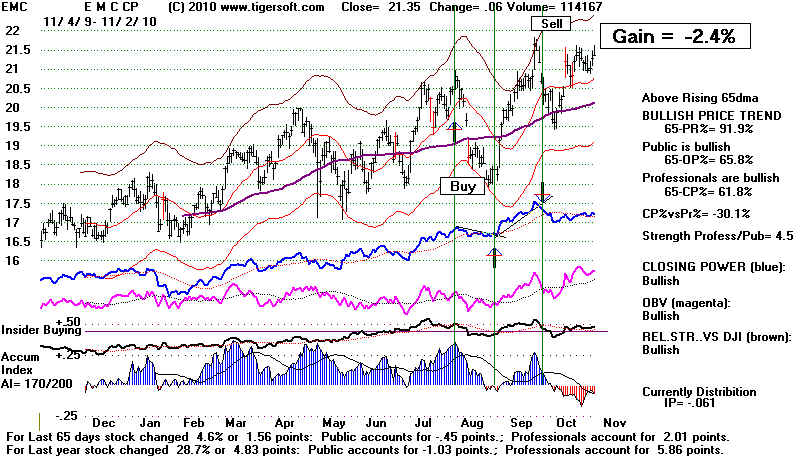
EMC
175
.36
-2.4%
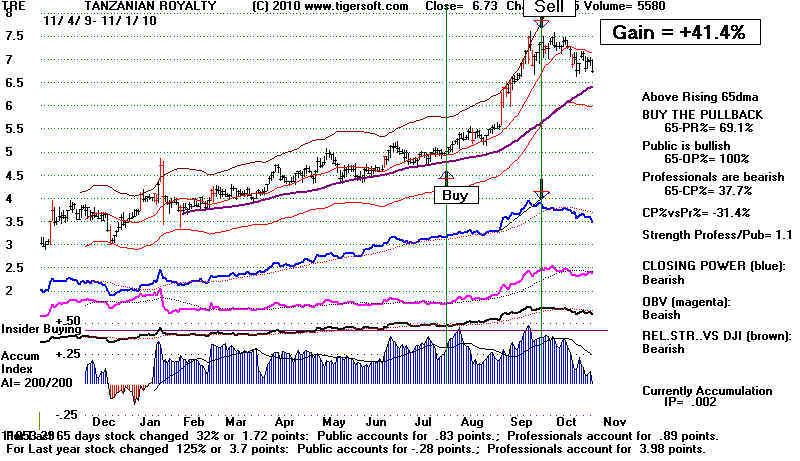
TRE
172
.32
+41.4%
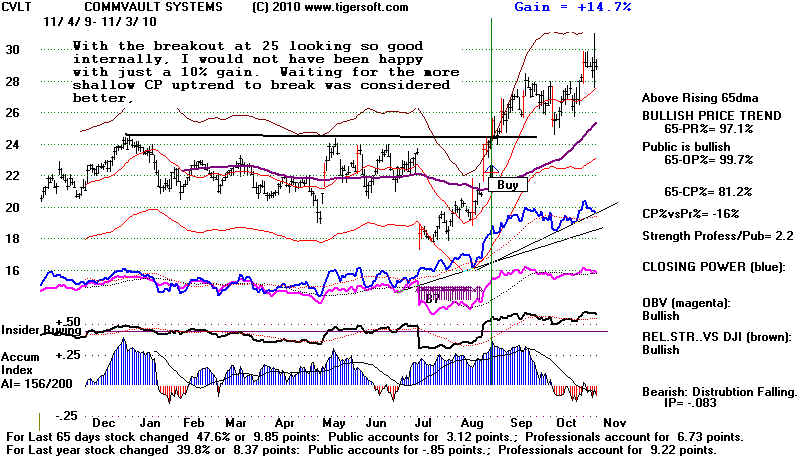
CVLT
161
.31
+14.7%
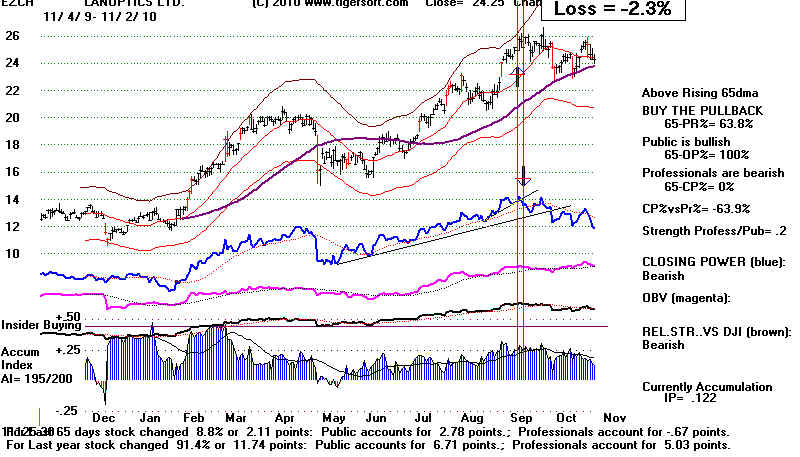
EZCH
189
.31
-2.3%
====================================================================================
It was not a good idea to short a stock that gas recently
received a Buy B7.
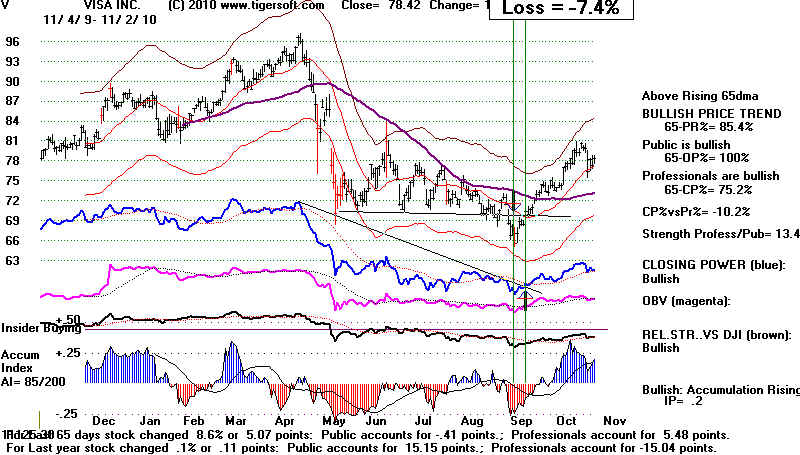
SHORT 9/13/2010 V 65.48 -2.61 97 IP<-.20
Loss = -7.4% There was an
August B7 just before what proved to be
a false breakdown.
One other conclusion from this is that penetrations of the 65-dma after a
Buy B7
or S7s. Look at the many examples
below. See paricularly VRNT and CHN.
Also: Use
success tests of rising 65-day ma when CP downtrend broke.
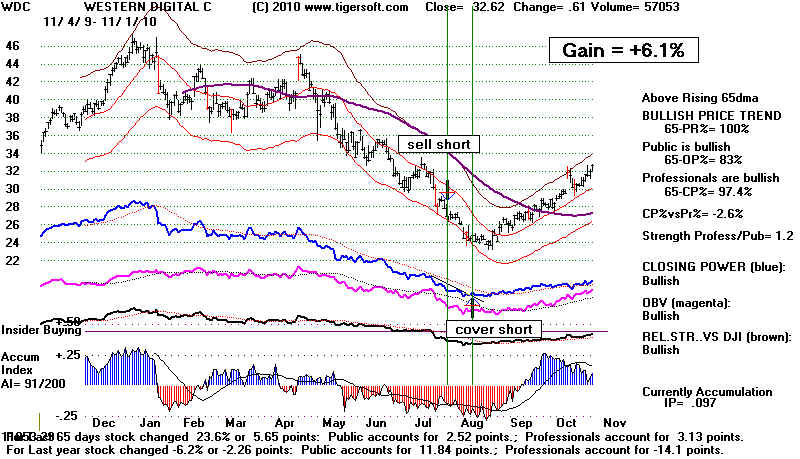
short 7/30/2010 WDC 26.39 -.58 AI/200= 96
Gain +6.1%
S7s
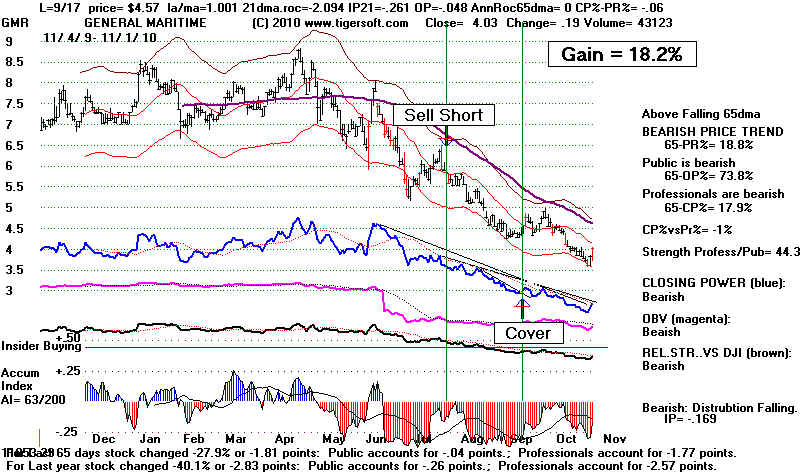
short 7/30/2010 GMR 5.59 -.25 AI/200= 94 IP= -.13
Gain +18.2%
no S7s.
LONG 7/30/2010 PSMT 28 +.66 AI/200=187 IP>.45
Gain +5.4%
There was a timely B7 on subsequent test of rising 65-dma.
LONG 7/30/2010 TRE 5.1 +.09 AI/200=172 IP>.30
Gain +41.4%
There were early June B7s

LONG 8/2/2010 VMED 22.15 +.62 AI/200=162 IP>.50
Gain +20.0% No B7s
LONG 8/4/2010 EMC 20.82 +.35 AI/200=175 ip>.35
Loss = -2.4%
There were numerous B7s in May-June and in August
The August B7s made the CP breakout then on the pullback a very good buy.
LONG 8/5/2010 CRME 9.31 +.57 AI/200=139 (LOW) IP>.36
Loss = -20.3%
The false breakout above 9 was very bearish. Many Pros were trapped by it.
CARDIOME PHARMA CORP Announces Its Co-Development Partner, Astellas
Pharma US., Inc. Suspends Patient Enrollment In The ACT 5 Study Of KYNAPID
(vernakalant hydrochloride) Injection
Thursday, 21 Oct 2010 07:55am EDT
There were misleading B7s in August on the pullback.
LONG 8/5/2010 TGH 28.13 +.43 AI/200=167 IP=.13
Loss = -2.4%
There were no B7s. There was a Sell S7 in July.
S7
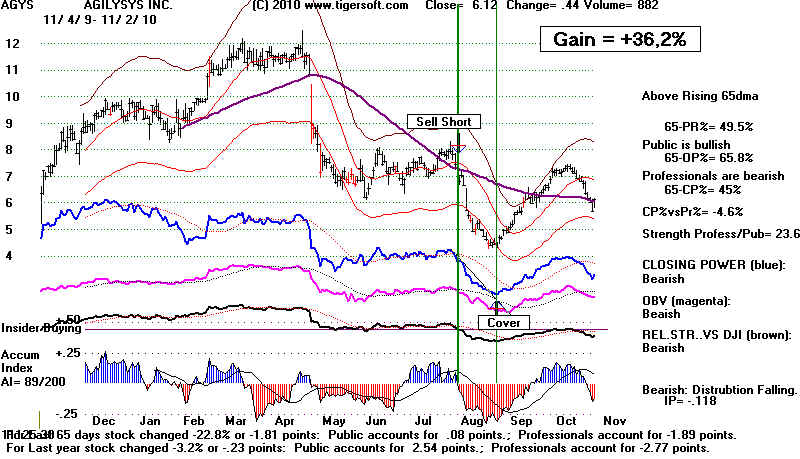
short 8/6/2010 AGYS 6.8 -.19 AI/200=81 IP= -.10 IP21 JUST BROKE BELOW tisi
Gain +36.2%
There were S7s in Jan-Feb.
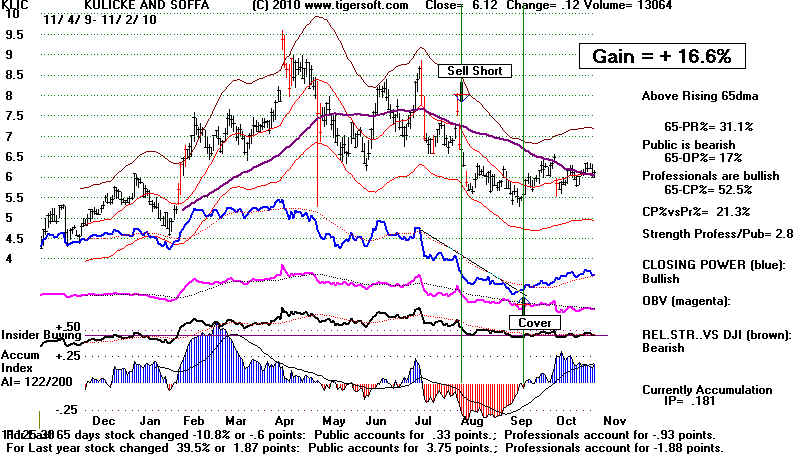
short 8/9/2010 KLIC 6.68 -.11 AI/200=122 IP< -.25
Gain +16.6% Note the timely S7s.
S7 S7
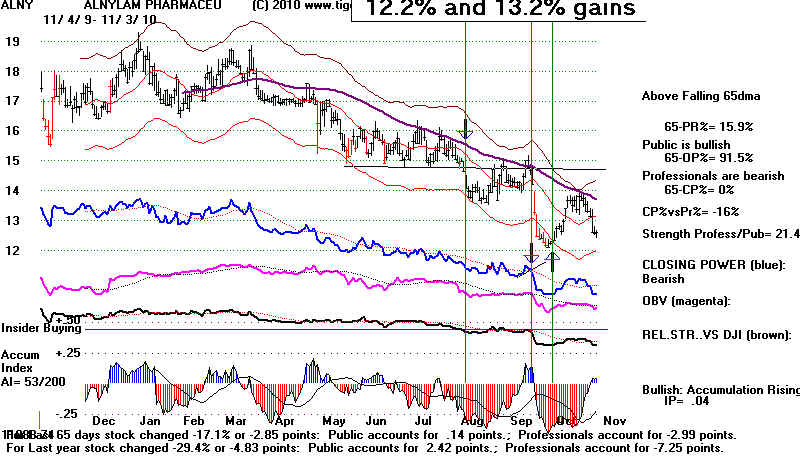
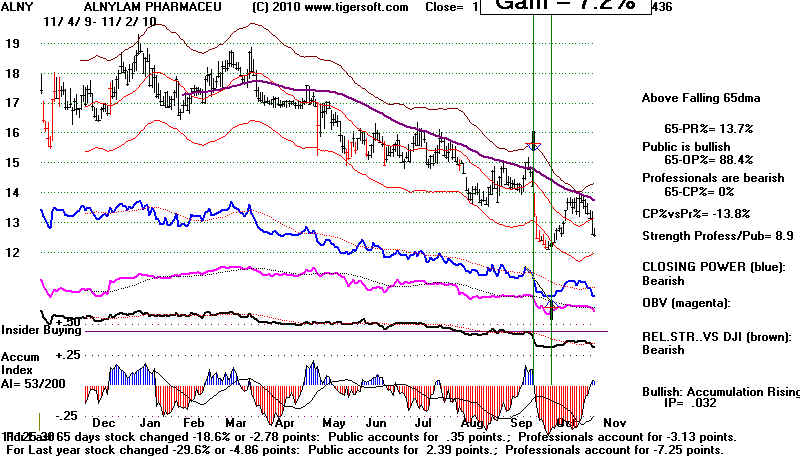
short 8/11/2010 ALNY 14.06 -.58 AI/200=69 IP<-.30
Gain +12.2% and later 13.2% gains. Note broken support at 14.75
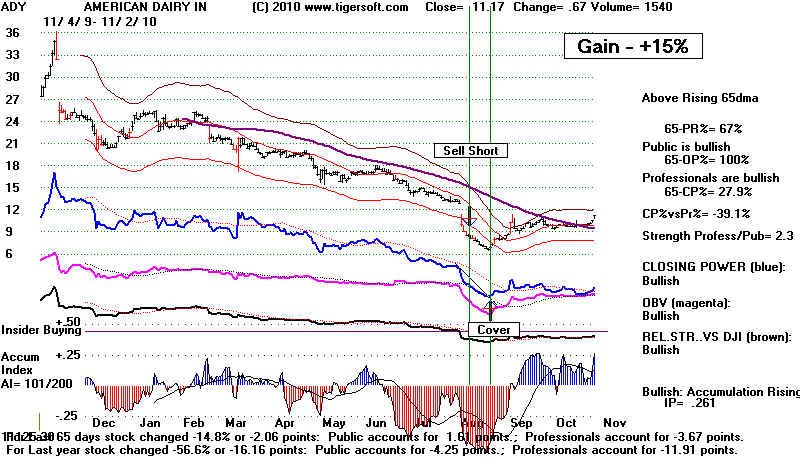
short 8/13/2010 ADY 8.13 -.36 AI/200=94 IP<-.30
Gain +15.0%
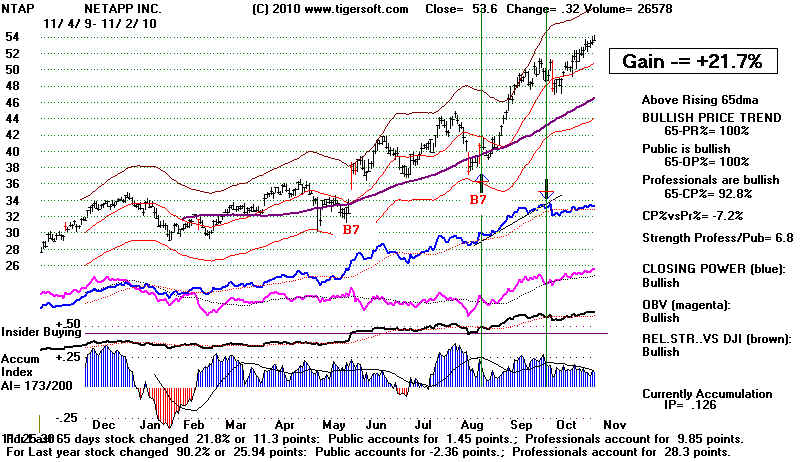
LONG 8/20/2010 NTAP 40.53 -.17 AI/200=159 IP =.23
Gain +21.7%
Excellent Buy B7s on pullbacks in May and August.
c
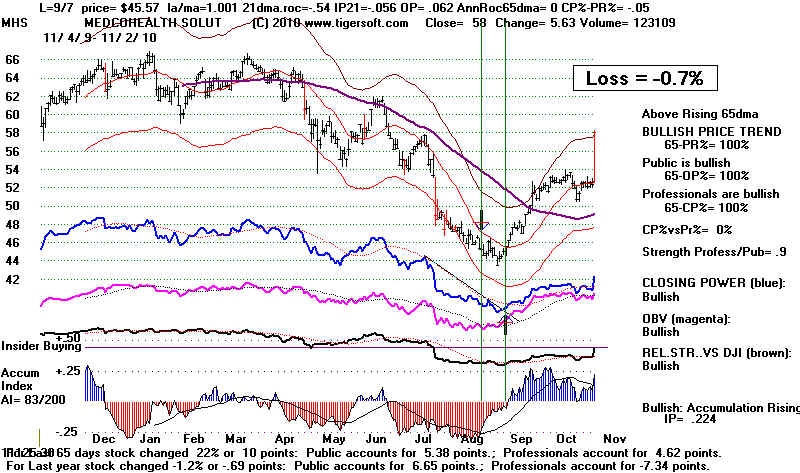
short 8/20/2010 MHS 34.26 -.07 AI/200=70 IP<-.25
Loss = -0.7%
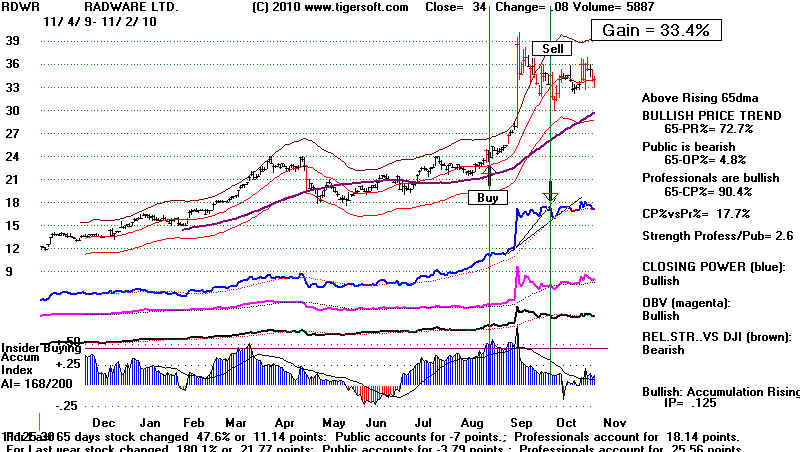
LONG 8/20/2010 RDWR 23.13 -.07 AI/200=174 IP> .35
Gain +44.8%
Perfect mid August B7.
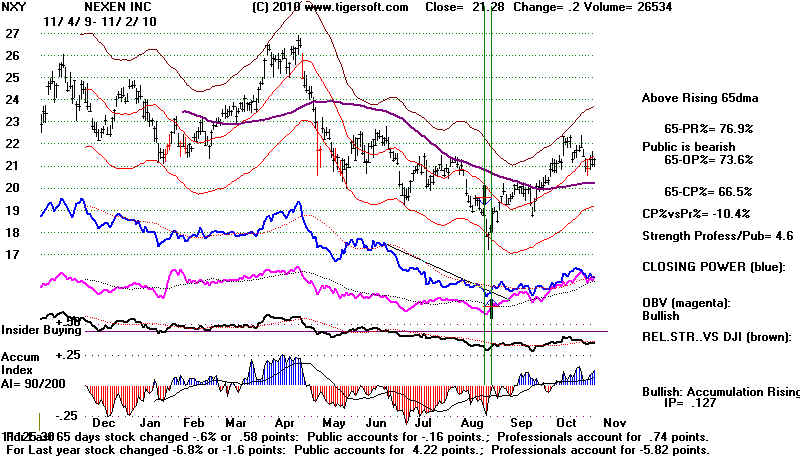
short 8/24/2010 NXY 17.81 -.94 AI/200=65 IP<-.30
Loss = -5.9%
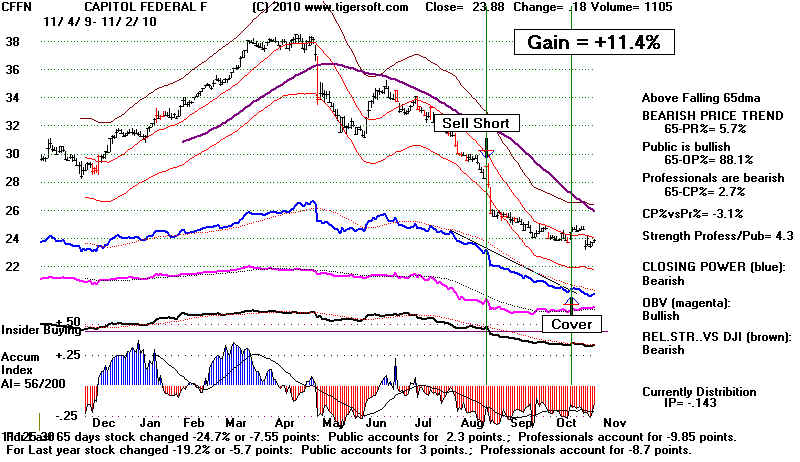
short 8/25/2010 CFFN 27.14 -1.95 AI/200=76 ip< -.30
Gain +11.4%
LONG 8/26/2010 CA 18.13 -.02 AI/200=132 (low) ip=.11 (low)
This stocks was bought on a test of its lows.
Gain +29%
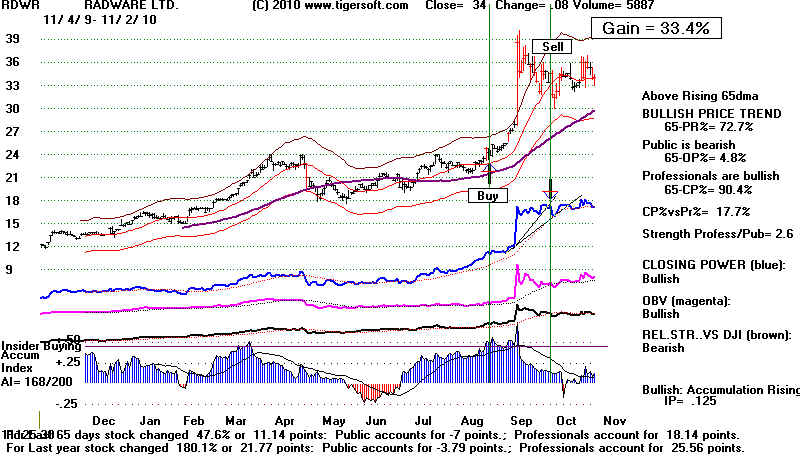
LONG 8/27/2010 RDWR 25.27 +1.44 AI/200=171 IP>.55
Gain +33.4%
Perfect B7 in August
LONG 8/27/2010 CVLT 25.5 +1.34 AI/200=161 IP>.30
Gain +14.7%
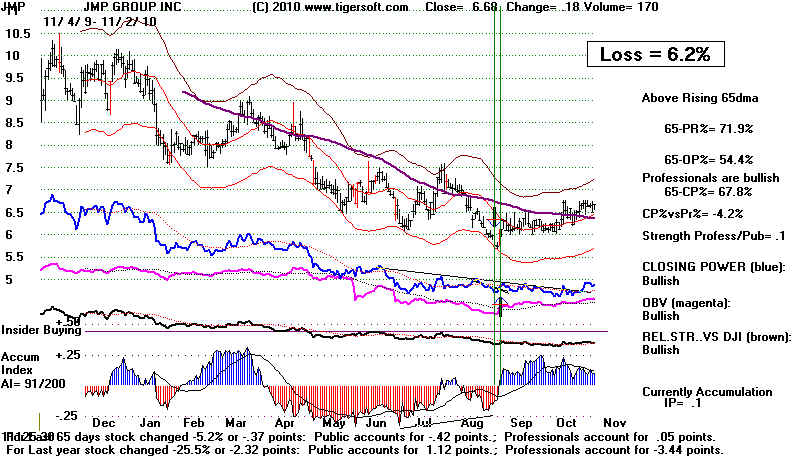
SHORT 8/30/2010 JMP 5.76 -.21 AI/200= 66 IP = -.20
Loss = -6.2%
S7
LONG 9/1/2010 N 19.58 58 AI/200=139 (low) ip= .35
Gain +16.8% June B7s
LONG 9/3/2010 VRNT 24.43 .48 AI/200=189 IP= .50
Gain +33.4% Numerous B7s0 June - Aug
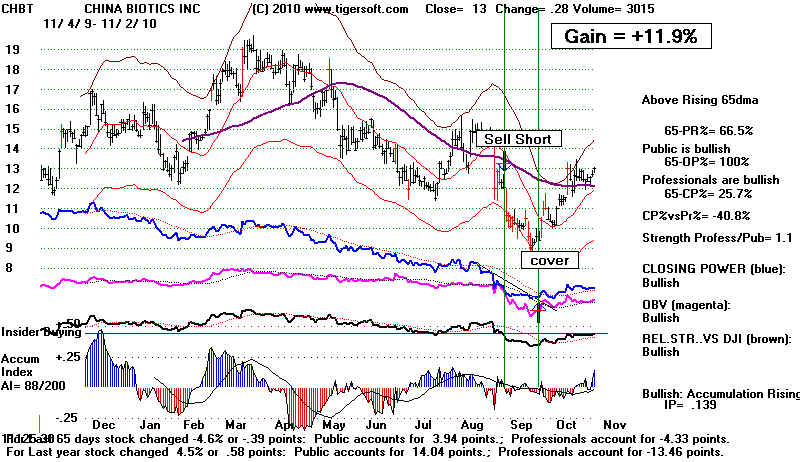
SHORT 9/7/2010 CHBT 10.65 -1.55 AI/200= 91 IP<-.25
Gain +11.9% S7s
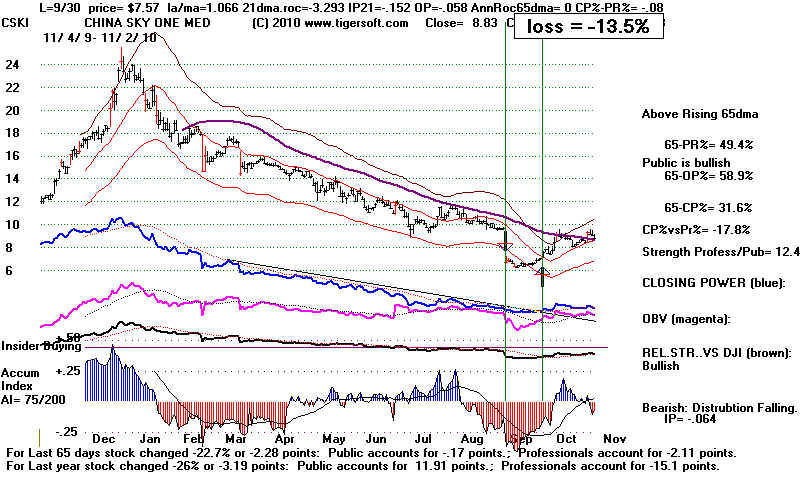
SHORT 9/7/2010 CSKI 6.67 -3.015 AI/200=91 IP<-.25
Loss = -13.5%
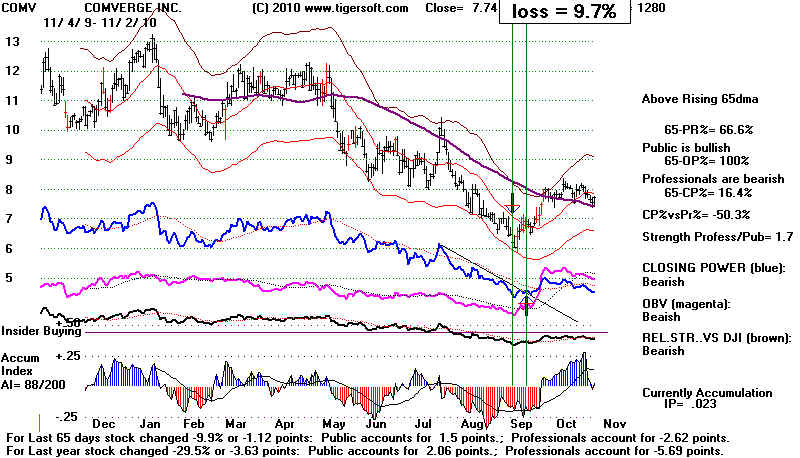
SHORT 9/10/2010 COMV 6.2 -.27 AI/200= 80 IP<-.25
Loss = -9.7%
SHORT 9/13/2010 V 65.48 -2.61 97 IP<-.20
Loss = -7.4%
There was an August B7 just before what proved to be a false breakdown
LONG 9/13/2010 ADVS 52.82 .8 AI /200=197 IP> .16 (low)
Loss = -5.9% Perfect May B7s
LONG 9/15/2010 EZCH 25.78 .87 AI/200=189 IP> .30
Loss = -5.9% June B7
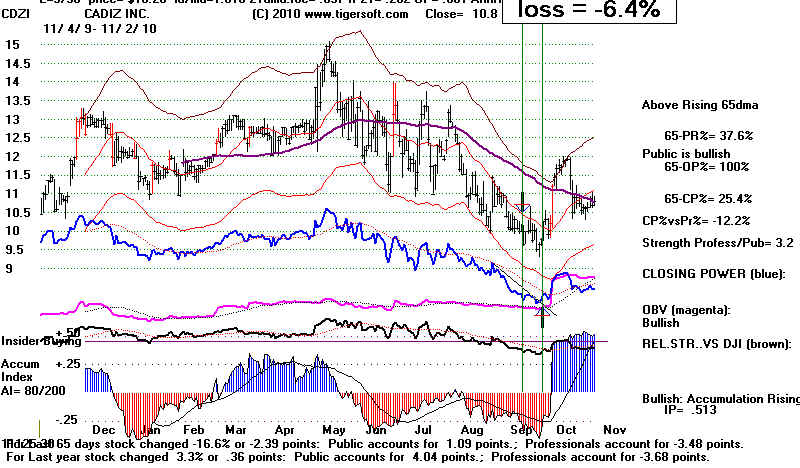
SHORT 9/17/2010 CDZI 9.64 -.36 AI/200= 69 IP<-.35
Loss = -6.4%
LONG 9/20/2010 NTCT 19.56 1.12 AI/200=182 IP> .45
Gain +19.6% B7
SHORT 9/24/2010 ALNY 13.27 -.95 AI/200= 97 IP<-.06
Gain +7.2%
LONG 9/24/2010 CHN 32.49 .5 AI/200=153 IP = .20 low
Gain +1.9% Perfect May-July B7s
Stock was certainly a Buy in July!
Look at the Closing Power and Accumulation.
It was mentioned on the Hotline at this time as a Buy.
LONG 9/30/2010 IRS 14.79 .2 AI/200= 175 IP = .45
Gain +9.2% Perfect June-July B7s
LONG 9/30/2010 VRNT 29.55 3.76 AI/200=194 IP=.35
Gain +10.3% See chart above.
===============================================================