858-273-5900 -- PO Box 9491 -- San Diego, CA 92169 william_schmidt@hotmail.com
3/15/2009
Thanks for visiting...Check back later for more, expanded documentation.
Read the Nightly Hotline for continuous applied research...
EXTREME BEARISH MODE RULES
AND CHARTS WITH SIGNALS: 1929-1933, 1937-1938
(C) 2009 William Schmidt, Ph.D.
Here are recommended settings. But you will want to experiment.
Peercomm + Peerless-2009 + Run/Setups
--> Initial Graph Choices (2)
Pick a number to set width (X-Axis) of display
750 - Compressed ... 625 medium ... 500 Expanded
Pick a number to set height (Y-Axis) of display
1100 - Compressed ... 925 medium ... 750 Expanded
Yes - Price Bar Chart No - Closing Price only OK
No - No Bollanger bands Yes - Bollanger Bands OK
Yes - OBV/ITRS/Accum.Index Display OK
--> Initial Graph Choices (1)
Yes - Price Bar Chart with 4 key internal strength indicators OK
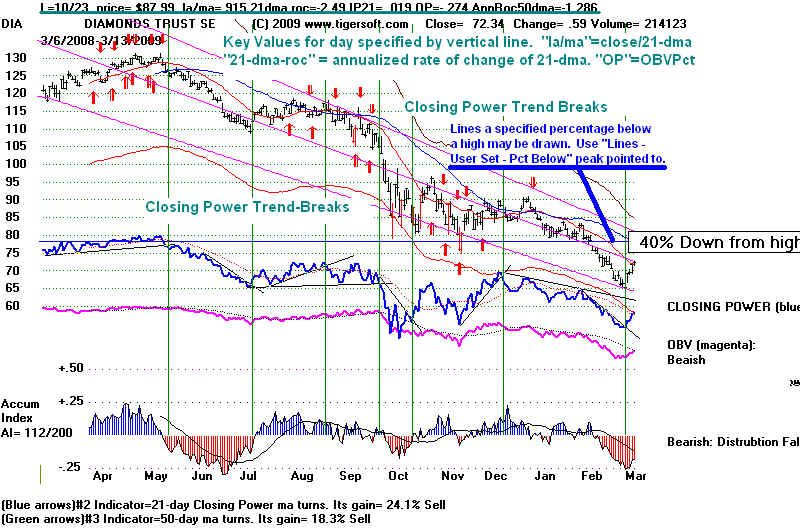
Use TigerSoft's Closing Power Trends. These trendbreaks
occur earlier than do price-trendbreaks. They are a
"game-changer", to quote a customer-professional
money manager. The blue Closing Power has typical
price-like formations. Three tests of a CLosing Power
trendline make it especially important. Horizontal
breakdowns and breakouts with it are reliably profitable.
Under Indic (3) + Tiger Basis of Moves BOML you will see Opening Power, too.
Its trends are often the opposite of the real price trend.
But when they are in agreement with the Closing Power
trend, we often see the biggest moves.
Recommended: use the rubber band Lines to draw the trendlines and the
Vertical Lines to see how timely the trendbreaks are.
OPERATIONS and RULES
Peercomm + Peerless-2009 + Peerless-Daily DJI + DATA
Under Signals(1) you will see several choices.
DJI Major Buys and Sells - This is normally the choice for
the Peerless major Buys and Sells, except when the
market is deemed to be in "extreme bearish mode".
Superimpose DJI Saved Signals - This superimposes on
and chart the signals that I believe should have been applied
at the time using our rules.
2.5% Down Day Reversals - These produce the S6 Sells,
which are good in all modes. Documentation - Sell S6
Multiple Sell S6s on the DJI suggest a very bearish market,
DJI Signals (Extreme Bearish Mode) - Important. Discussed below.
Rare Short-Term Buy. See new Documentation Buy 'b'.
Display A User Selected Signal. Not functional, except with stocks.
Display User Defined Signals' Set. Not functional, except with stocks.
Short Term trading Range Signals (1) (2) - See Help + Short Term Signals
Trending Confirmed Moves Past 50-day ma - (in development)
=========================================================
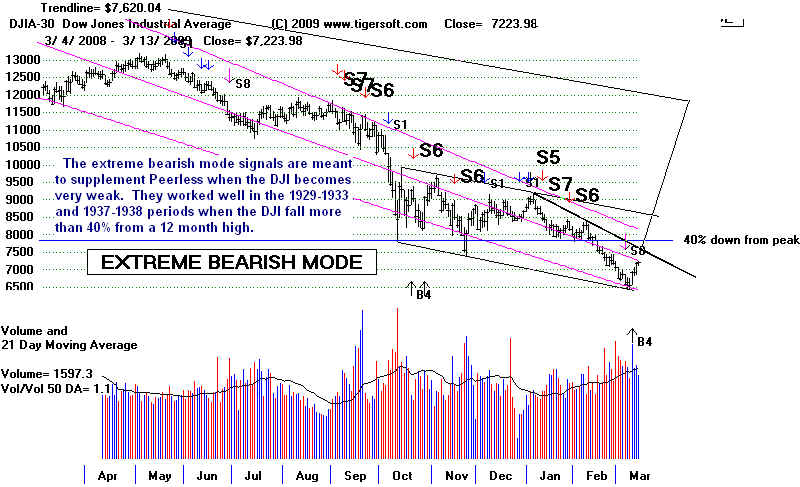
DJI Signals (Extreme Bearish Mode) - This gives the signals
that worked well in the 1929-1933 and 1937-1938 period when
the DJI fell more than 47%, fell more than 40% in a 10 month
period, had an optimized lower band below -11% and showed
multiple S6s. Until the DJI can get back above the price level that
was originally the point where the DJI fell 40% below its 10-month
peak, it is probably best to rely upon the Buys and Sells of the
Extreme Bearish mode and use only the Sells of the normal
Peerless signals.
We apply different signals because we have to be concerned
of the 1930-1933 experience taking place again, during which the
DJI fell sharply with only 2 significant rallies. I have created
special Buys and Sells with the data back then, which you should
note did not have NYSE advances, declines, Up-Volume or Down-Volume.
1929-1933
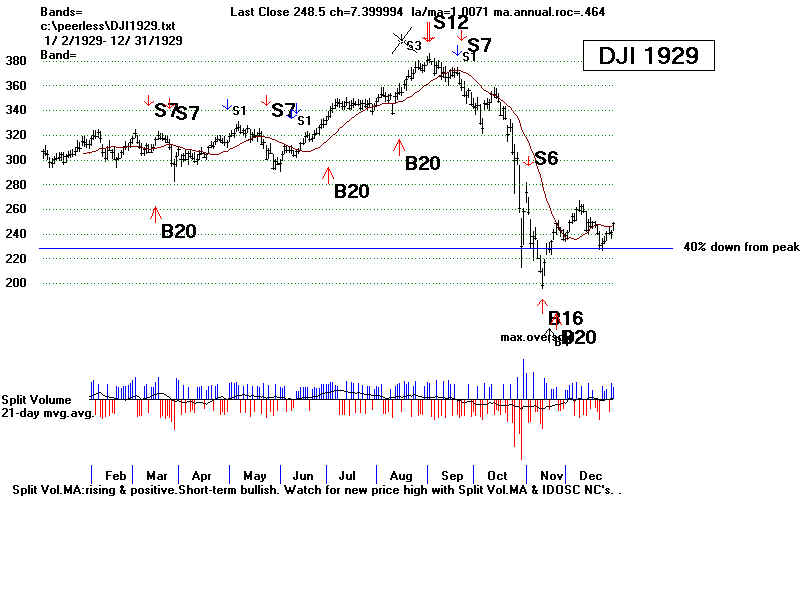
1st Decline 381.20 (9/3/1929) to 198.70 (11/13/1929)
A Sell S12 called the top and a Buy B16 called the bottom
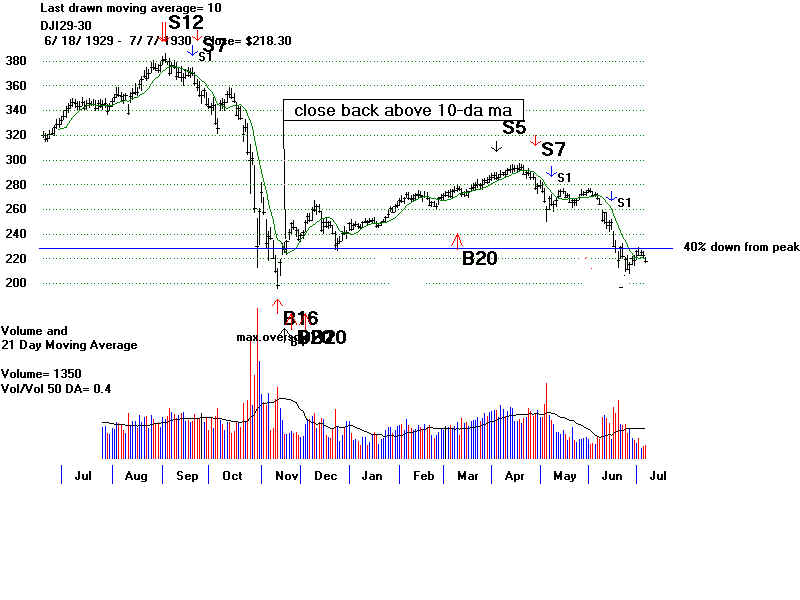
1st Rebound 198.70 (11/13/1929) to 294.10 (4/17/1930)
Reversing Sell S5 at 285.30 on 4/2/1930
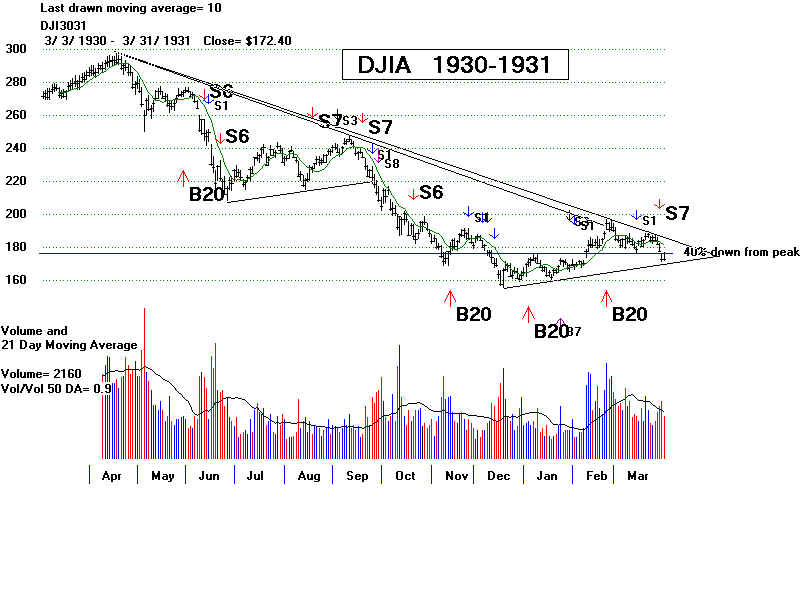
2nd Decline 294.10 (4/17/1930) tO 41.80 (7/7/1933) and Buy B8
Retracements are from previous peak to most recent bottom. Use Lines in our software.
1 33%-48% retracements in 1930 Sell S7 warns decline will continue
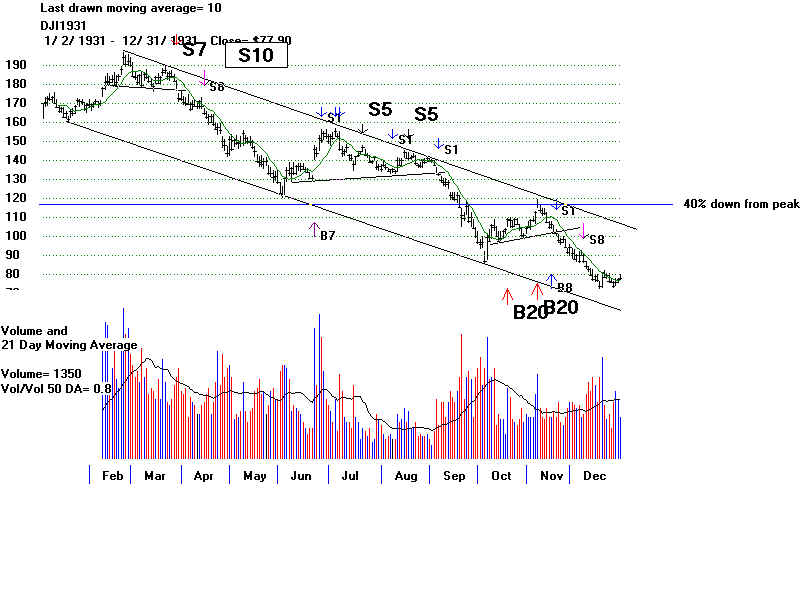
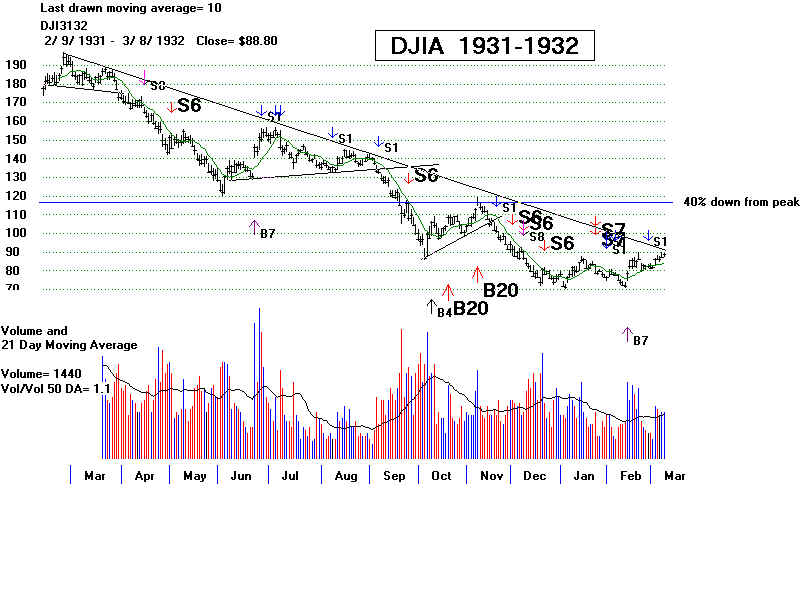
2 33%-48% retracements in 1931 Sell S1s warn decline will continue
1 33% recovery Dec.1931 to March 1932
Sell S7 and Sell S1 warn decline will continue
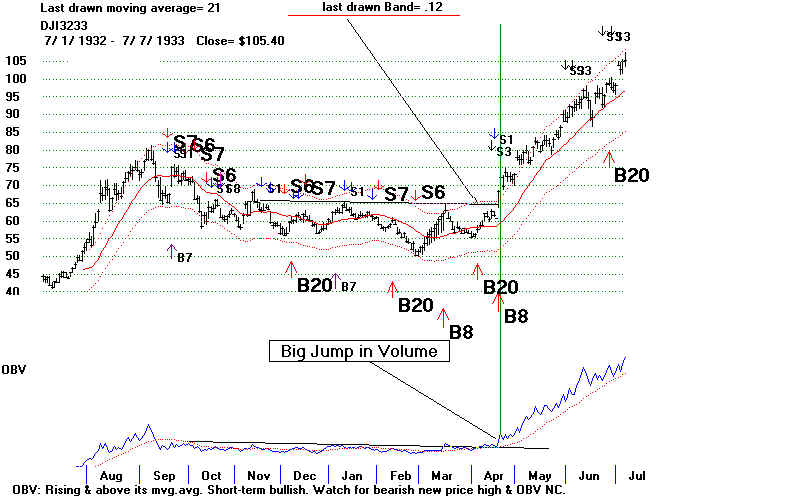
Big Rally off bottom 41.80 (7/7/1933) to 79.90 (9/7/1933),
almost 100% Buy B8 and Sell S7
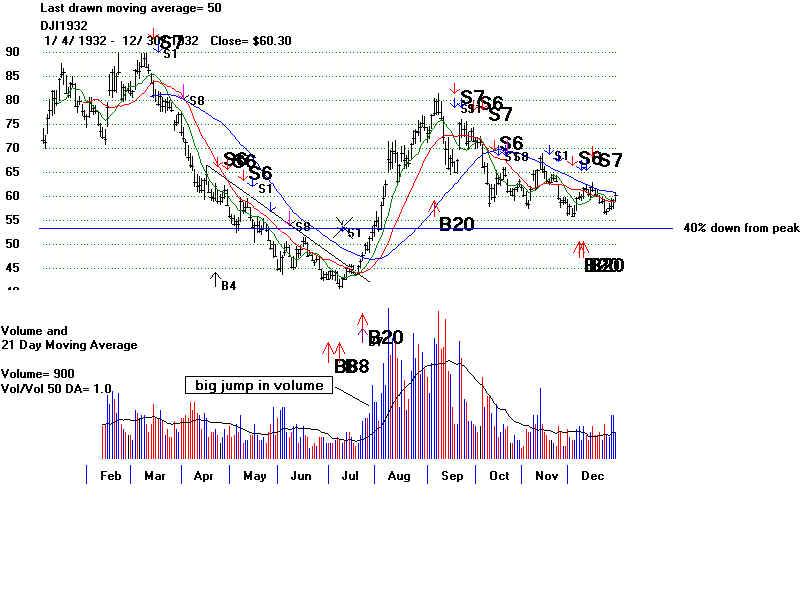
3rd Decline and re-test of lows 79.90 (9/7/1932) to 50.20 (2/27/1933)
Buy B8 42.50 (6/30/1932) and 41.20 (7/8/1933)
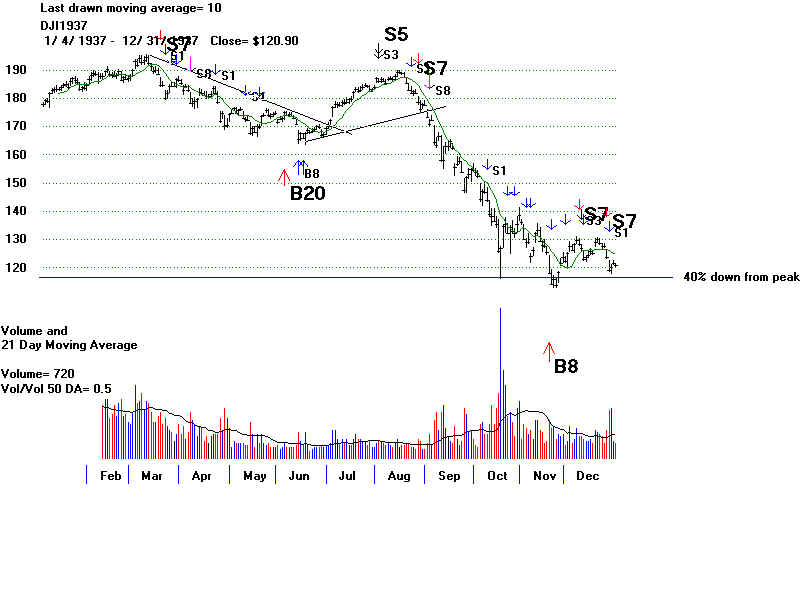
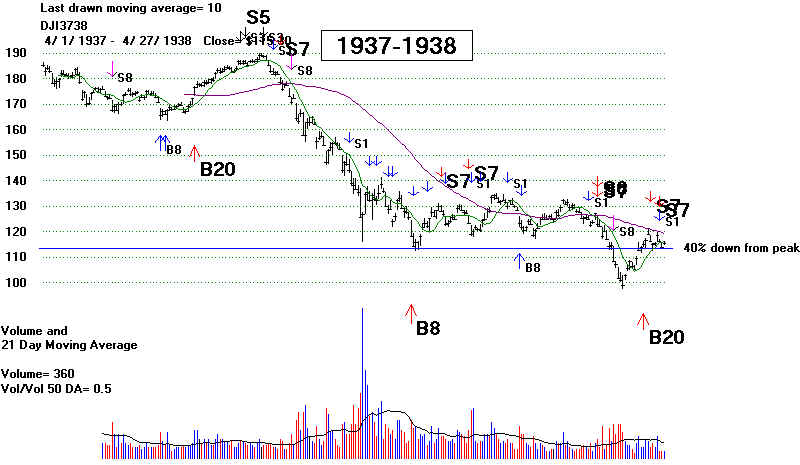
1937-1938 194.40 (3/10/1938) to 98.90 (3/31/1938)
Sell S5 185.90 (8/3/1938) Buy B20 123.90 (6/22/1938)
...on 11/22/1937 114.20 DJI declined more than 40%.
so the Buy B20 is an important re-entry buy.
=================================================================================
Definitions of Buy and Sell Signals for A "Severe Bear" Market.
Here are the Buys and Sells for a severe bear market.
Note some of the newer concepts.
A reversing Sell may be based on an OPCT Bullish divergence (far below the 21-day ma
and positive). See the bottom of the 1932 decline.
There is no Buy based on a bullish IP21 (current Accumulation) divergence. Insiders can
be very wrong about callign a bottom, though they seem to be able to recognize tops quite
well A major Sell (the S12) does consider heavy| IP21 distribution as bearish.
Because a downtrend is more likely to persist or reassert itself in this environment,
we have multiple ways of recognizing that the down-trend is resuming. Watching for the
IP21 and OPCT to fall below their 21-day ma is very helpful if the market has shown it is
severely bearish.
Volume is very important. Three days up straight with rising volume each day is a
new Buy B20. There should probably be a similarly based rule for selling, as when there
are three straight days with volume rising reach day above the previous day's.
BUY SIGNALS - Extreme Bearish Mode
Buy B4 - DJI crosses back above 21-day ma when DJI is down more than 40% from 12 mo high.
Buy B7 - DJI crosses back above its 42-day ma with volume two times what it was 2 days earlier.
Buy B8 - DJI closes between 3.5% and 4% lower band with IP21>+.032 and OPMA>+.054
DJI closes more than 8% below its ma with an OPCT>0 and an annualized ROC
above -.20 but below -1.1
Buy B16 - DJI closes more than 28.5% below its ma with OPCT >-.44
Buy B20 - DJI's closes rise 3 days consecutively on volume which is each day above its previous days.
DJI closes up 4 days in a row on much higher volume..
SELL SIGNALS - Extreme Bearish Mode
Sell S1 - 21-day ma of OBV turns up in certain circumstances.
Sell S3 - OPCT fall below its 21-day ma and it positive.
Sell S5 - DJI is above 2% upper band and IP21 drops below its 21-day ma and it positive.
Sell S7 - DJI falls below 42-day ma with IP21<0.
Sell S12 - DJI closes above 5% band with IP21<-.12 and annualized ROC<.9