San Diego User Group Meeting
Sign Up for Future Meetings' Notices http://investing.meetup.com/431/
January 3, 2008 Saturday - 12:15 - 3:15 Kaiser Permanente Hospital
Pharmacy Entrance - Left Side Elevator to Basement Classroom across from Cafeteria.
There is also a chance we will meet at the far end of the cafeteria. That will be so if
the meeting rooms are taken.
www.tigersoft.com
Stock Market Predictions, Software, Hotline, Books, Research and Consulting.
 TigerSoft New
Service Where we
follow insiders' big money trading to the real story.
TigerSoft New
Service Where we
follow insiders' big money trading to the real story. ===========TigerSoft Makes It Easy To See The Real Trends. ===========
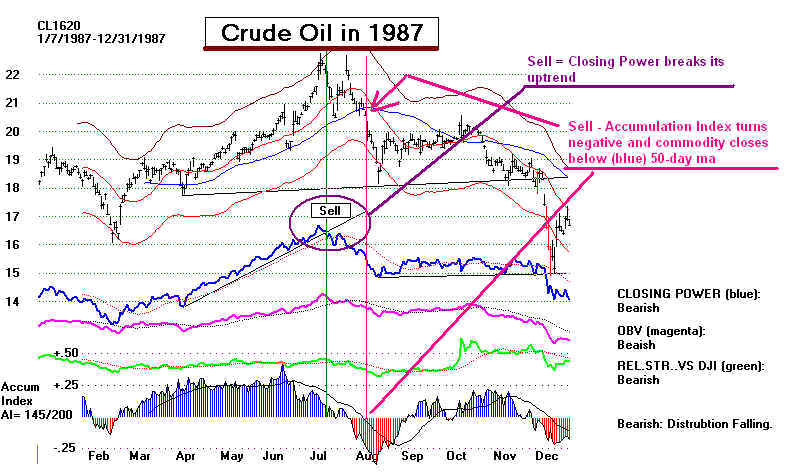
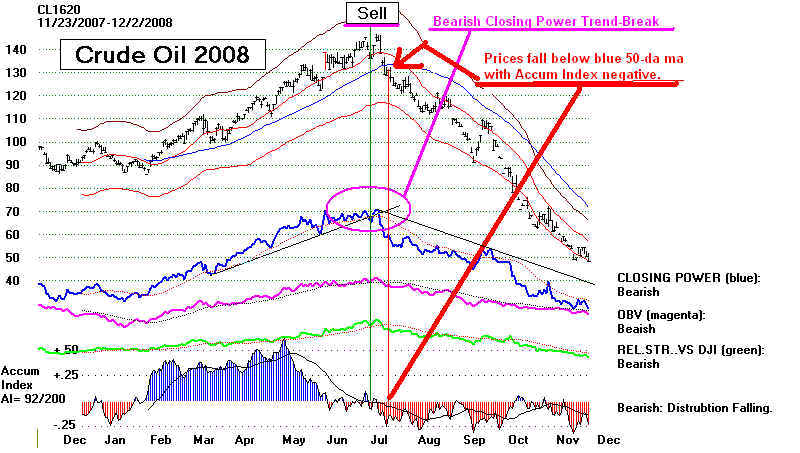
Watch for (1) Closing Power Trend-Changes
and (2) Accumulaton turning into Distribution
just before prices break 50-day ma.
Consider Crude Oil in 1987 and 2008.
("CL1620" is the "perpetual contract for crude oil)
See - Mastering Crude Oil's Roller Coaster Ride: 2006-2008 Was Easy.
With the Mid-East heating up again, oil prices are apt to rise. Come see our charts
on Crude Oil, Commodities, Gold and Silver.
Agenda for January 2009 TigerSoft User Group Meeting.
Visit our website - www.tigersoft.com Lots of Important News
There are some important signs of a reversal upwards. Come and let's talk about them.
But at what point would we have to "bail" if there is no rally. After all,
the Santa Rally has been very weak.
What is the significance of that?
TECHNICALS
Watch breadth, the NYSE A/D Line, new highs and lows.
Gold and Oil are important now. Will explain at meeting.
Use Tiger's Closing Power. Openings are often very false in a bear market. The closings
are "for real".
I have done a lot of testing of this tool. We use Closing Power along with our
Accumulation Index,
OBV and Relative Strength. Look for non-confirmations by it of new price lows to suggest a
bottom.
Watch for its changing direction after a big run where Opening Power has also been
falling.
The outlook for 2009 is very problematic, of course, with banks not lending and people
tapped out. .
But even many Republicans are very tired of Bush. An Obama Administration will not use
FEAR so
quickly as the Bush Administration has. So, there should be a relief rally as Bush leaves
the scene.
Years after the Election have their own dynamics. We will show these at the meeting.
OK - WHAT
ORDERS DO WE WANT TO PUT IN.
Given all these considerations, what Individual Stocks should we Buy or Sell Short? We
will look
at the stocks you own using the vantage point of TigerSoft's" automatic Buys and
Sells and with an eye
to whether the stocks show insider buying or selling using out Tiger Accumulation Index.
Seasoned
Tiger users always chime in. The Tiger Power Ranker can be applied to 6,000 stocks. We do
this to
find special situations that we may recommend now for purchase or sale. Keep in mind that
the Tiger
systems have been extensively back-tested. For example, the highest Tiger Accumulated
stock in the
DJI-30 typically rises 24% per year. Peerless has averaged since 1965 17%/year simply
Buying and
Selling the DJI-30 on its automatic major signals.
Watch the stocks moving above their 50day ma. These can be big winners.
Make a list of stocks that are on New Buys, where the signals have been very
profitable.
Especially, higher priced stocks that are just above their 50-day ma.
This will be a very full agenda. Come early. We look forward to seeing you.
"Tiger Bill"
See also TigerSoft Automatic Buys and Sells (1) (2)
12/26/2008
12-mo gain
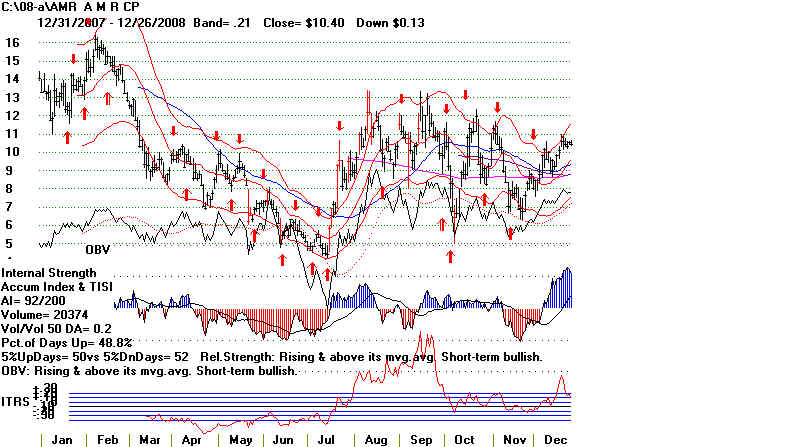
AMR 475%
ARII 589%
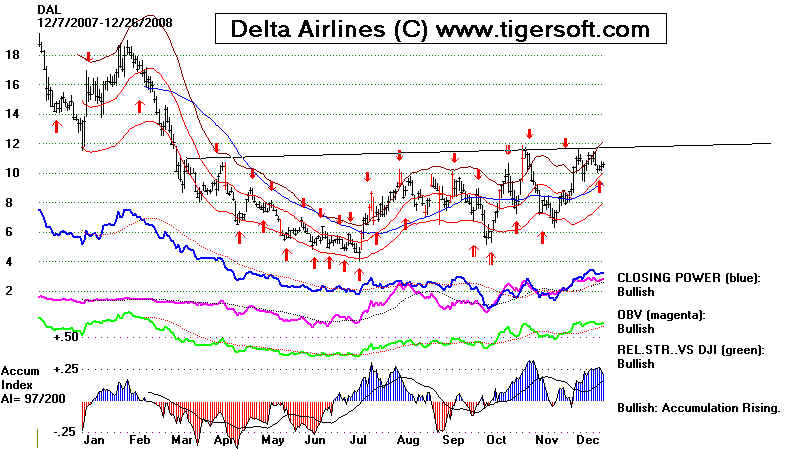
DAL 850%
DRYS 628%
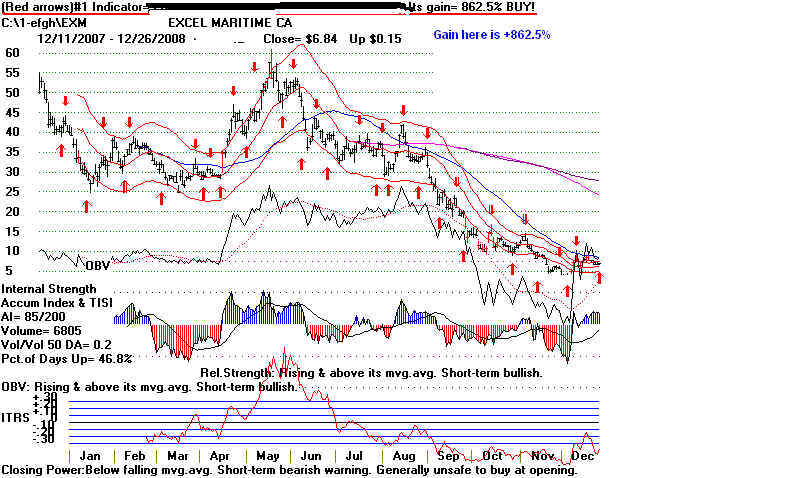
EXM 866%
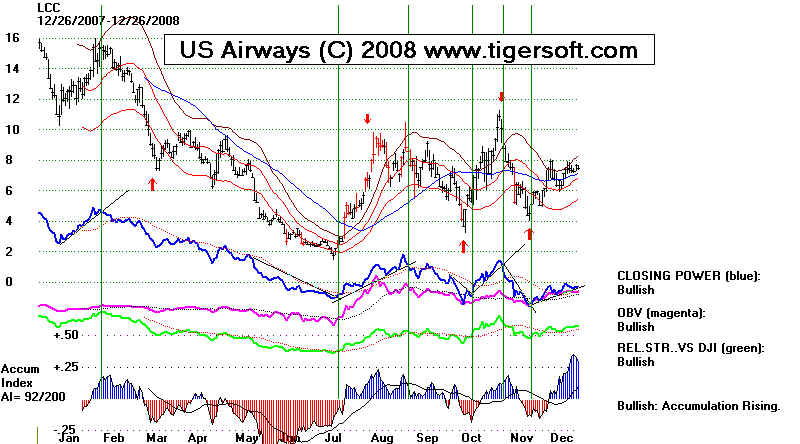
LCC 508%
NM 403%
RAIL 259%
TBSI 575%
YRCW 583%
The simplest approach
to making money using TigerSoft is to use
its automatic Buys and Sells. Buy on a fresh automatic TigerSoft
red Buy and Sell on a fresh automatic TigerSoft Sell. The manual
that
we provide makes a number of suggestions on how best to use them.
But here are some important considerations for anyone who is freshly
considering adding TigerSoft to their investment and trading arsenal.
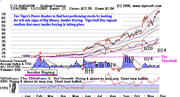
The basic TigerSoft chart also shows 4 moving averages (ma):
red 21-day ma and upper and lower band.
blue 50-day ma
pink 30-week ma
black 200 day ma
black OBV (aggressive buying)
blue and red Accumulation Index
red Intermediate Term Relative Strength.
Chart advises that the short-term expected price direction is up.
new red up Buy arrow.
Short-term relative strength is bullish.
Short-term OBV trend is up.
but last day's volume was only 20% of normal
------------------------------------------------------- EXM
--------------------------------------------------
American Air Lines -
(C) 2008 www.tigersoft.com
DELTA AIRLINES