AND PUBLIC & FOREIGN BUYING PRESSURE.
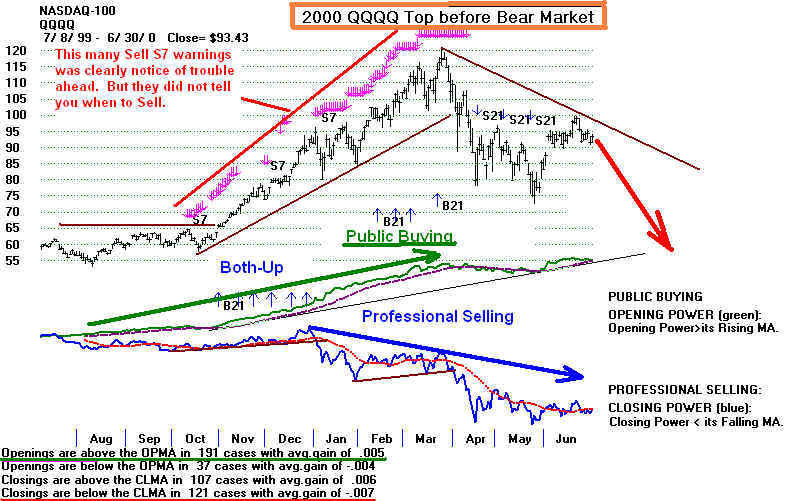
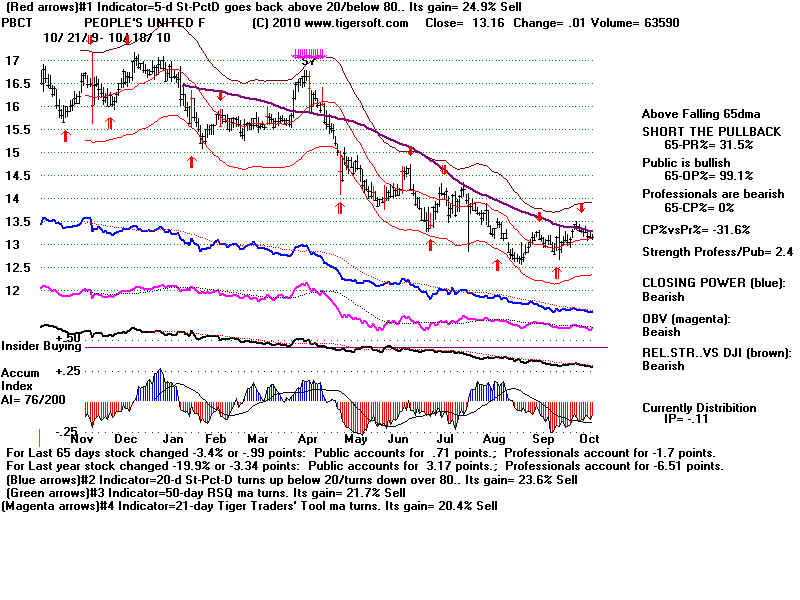
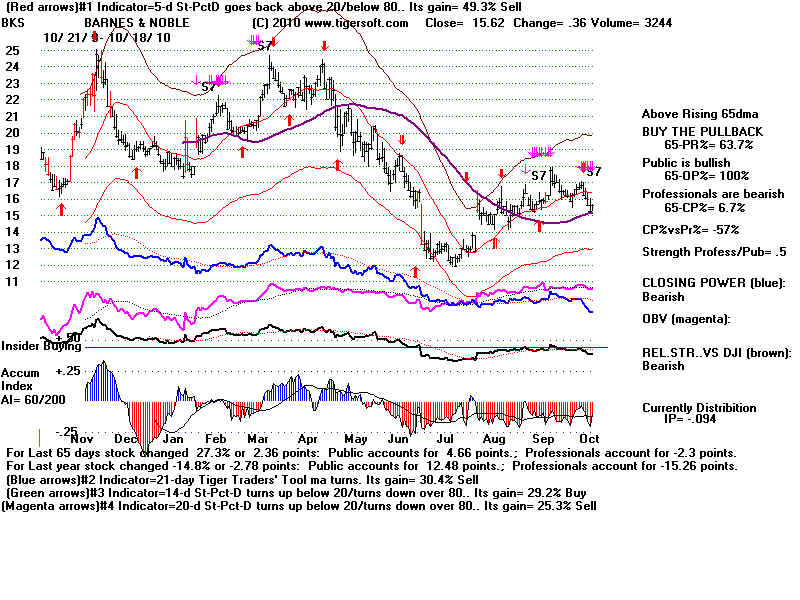
TigerSoft BUY B7s and SELL S7s Show Extreme Professional Buying or Selling
which Diverges Sharly from Price Action abd Public Buying Power.
(C) 2010 William Schmidt, Ph.D. 10/10/2010
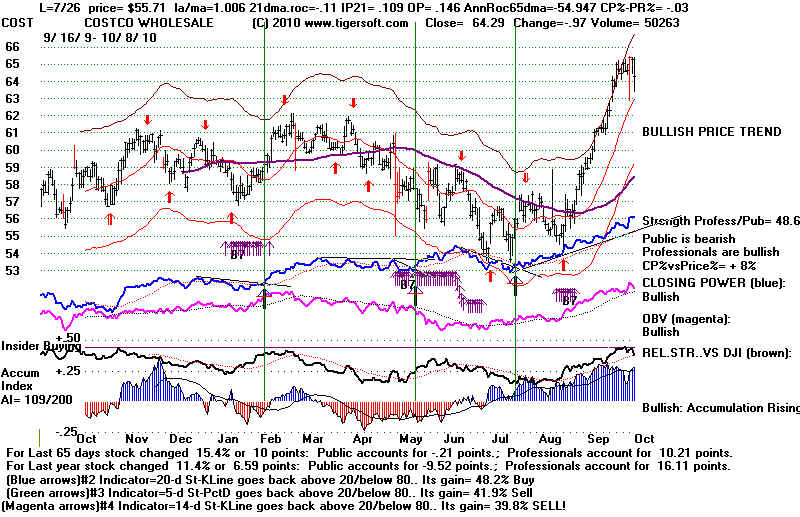
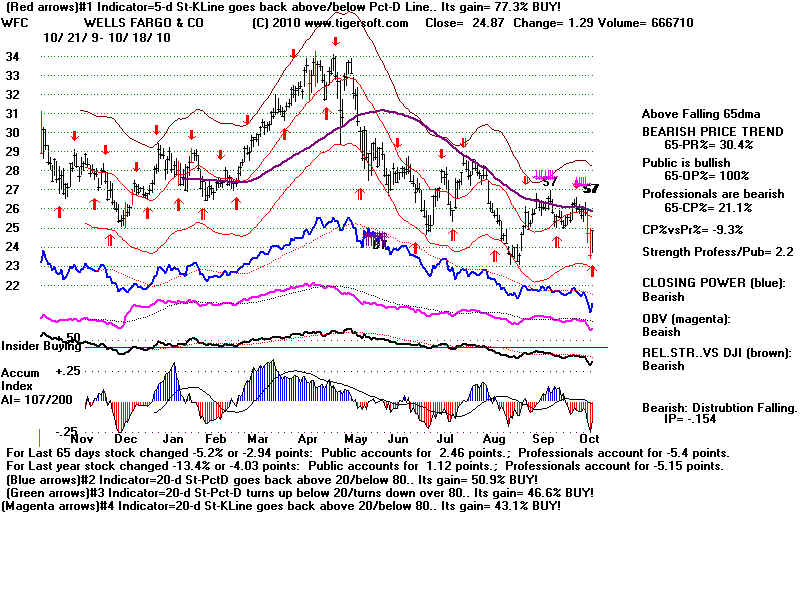
Notice the new Buy B7s. This shows that Professionals and Closing Power are
much more bullish than the Public and Openings are. The calculations are as
follows:
1) Compute CP% ... This shows where Closing Power is within its 65-day range.
Example: If CP is 90 and its 65 day high is 100 and its low is 50,
then CP% = 80
2) Compute Pr% .. This is where Price is within its 65-day range.
3) Computer OP%... This shows where Openoing Power is within its 65-day range.
Example: If OP is 60 and its 65 day high is 100 and its low is 50,
then OP% = 20
4) Compute CP%-Pr%.
If CP%-Pr% >.35, Tiger produces a Buy B7 using the first choice under Signals-3.
If CP%-Pr% <-.35, Tiger produces a Sell S7 using the first choice under Signals-3.
You can use the vertical line command to get the CP%-Pr% at any point.
The B7s and S7s work well with stocks that are not dominated by either strong
or weak Openings. Precious metals' stocks are moved more by Openings, so we
would not consider the S7s important.
Of course, internal strength readings are important, too. Heavy Accumulation makes the
B7 much more reliable. Use price patterns and the 65-day ma, too, because B7s
can be early.
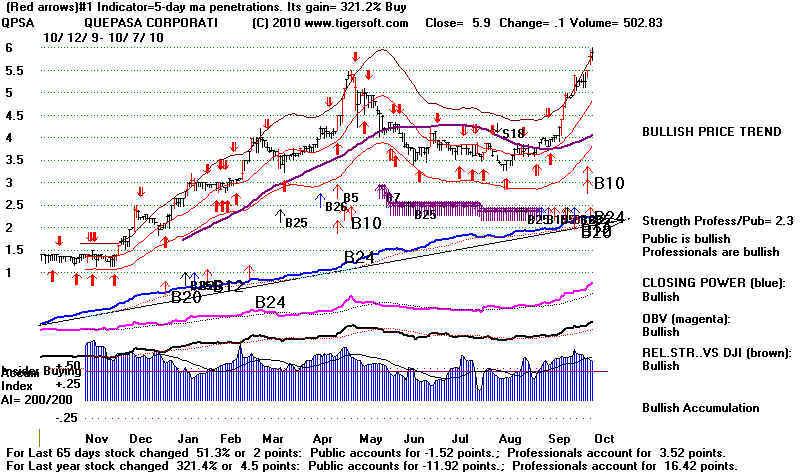
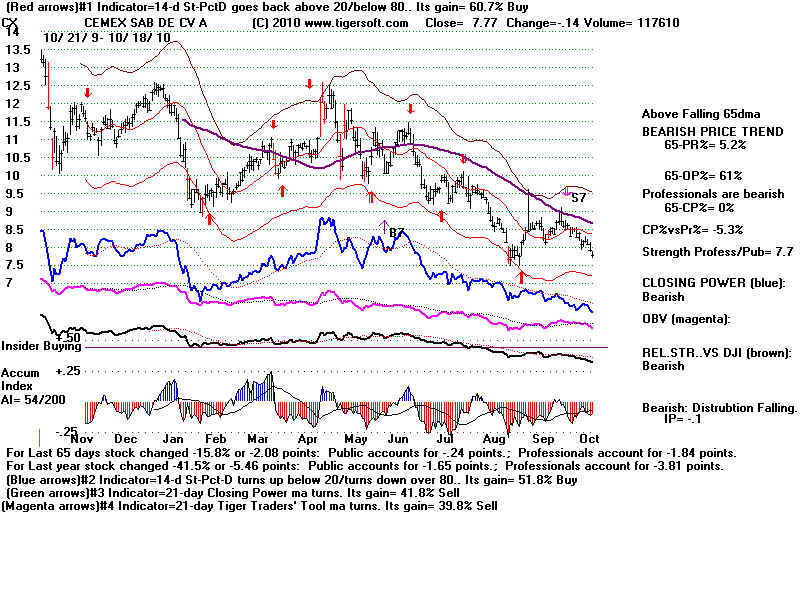
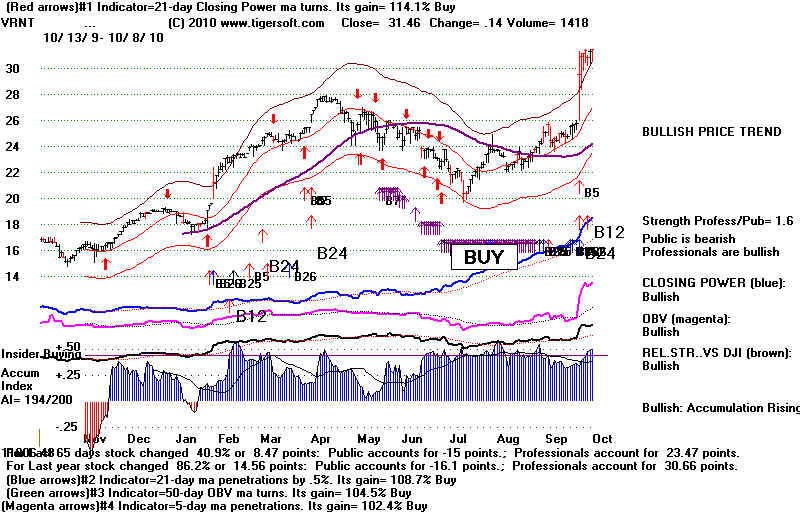
At the bottom of the first graph you are shown how much of the price daily changes
for 65 days and for a year owe to strong or weak openings and to changes from the
opening to the close. The ratio of the 65 day sum of Post Openings' strength to
the 65-day sum of Overnight Openings is called "Strength Profess/Public". On the right
side of the charts, you see a value for "Strength Profess/Public".
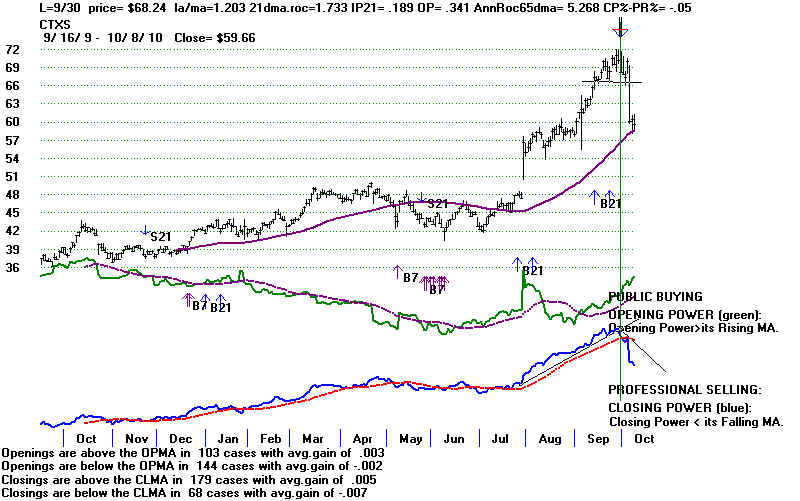
Use Indicators-3 to plot both Opening and Closing Power. Notice the B21s. These show
when both Opening and Closing Power are above their 21-day ma. The first B21 in
a series often produces steep run-ups which are abruptly ended when a diagonal line
of the CLosing Power uptrend is violated. See CTXS below.