Tiger Software: 2/12/2008
(C) 2008 William Schmidt, Ph.D. william_schmidt@hotmail.com
Editor's Note:
Shorted stocks rallied mostly today because of Fed action. I would wait until
they close above 50-day ma before covering. Watch the Bullish stocks for
FIDSTKS (all Fidelity's biggest holdings) to see when they start turning up.
Watch the highest Accumulation (AI/200) stocks for the same thing.
Tax rebates and Fed Discount rate cuts will weaken US dollar. That should
make gold and silver go up. Oil price weakness does hurt gold, thoug,
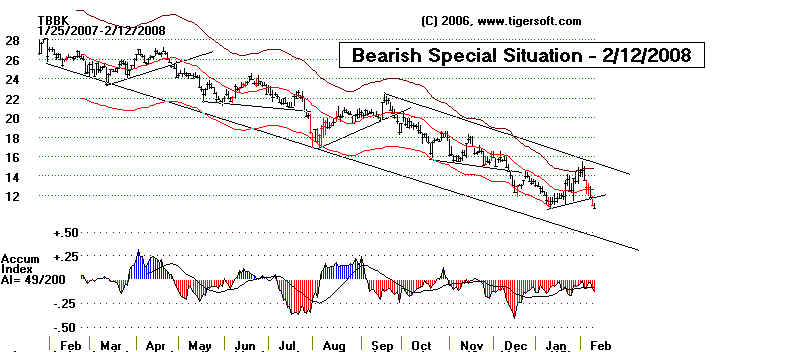
====> New short sale - 2/12/2008 - TBBK
Short Positions:
TISI = 21-day ma of Accum. Index.IP21=current value of Accum. Index.
In general, we will cover short sales if they close above 50-day ma. with IP21>0.
If they jump too fast, hold them short. They will combe back to the 50-day ma.
Cover them there. Know that some of these may be short sales again when
their short covering rallies are over.
Short sales (IP21=current Accum. Index)
ISLE 10.61 -.19 AI/200=14 New Red Sell IP21 is still below -.18
ABFS 28.88 -.13 AI/200=18 IP21>0... This is still below long-term mvg.avgs.
This rose much more than was expected. We will start using the OP21 indicator, too.
It mad a 4-month high just before the rally. The rising 50-day ma is where I would plan to cover.
BONT 6.82 -.59 IP21 is improving. IP21<0 AI/200=11
XING 7.35 +.03 AI/200=17
Long Posiitons.
---------------------------------------------------------------------------------------------------------------------------------------
Using NASDAQ-100 and finding new short-term Buys:
Sell ===> KLAC 41.70 -.47 129.8% gain over last year. Could not rally past 21-day ma today.
SPLS 23.11 -.02 100.6% gain over the last year.
---------------------------------------------------------------------------------------------------------------------------------------
DBC 32.95 -.63 AI/200=183
CHU 23.50 -.18 Great OBV and powerful uptrend.
FDG 44.39 -1.29 B12. Recent breakout was at 45. Nice dividend.
SLV 170.34 -3.56 Uptrend continues as SLV bounced up off of rising 21-day ma
Rising ITRS
Gold 46.39 -.56 Rangold Resources AI/200=154 Heavy red down volume. ITRS=.18
Hold because of weak dollar.
GLD 89.18 -1.81 Heavy Down volume Downtrending OBV. NH
Hold because of weak dollar.
DBA - Power Shares DB Agriculture 37.83 -.92
SSRI 31.81 -2.14 Red Sell ... Having difficulty getting past declining 50-day ma
SID 33.43 +.52 (Split 3:1) AI/200=179
KTEC 35.44 -.57 NH was confirmed by OBV and IP21>.25
KEQU 18 +.48 (AI/200=200)
Bond Fund AGG 102.93 +.05
MCD 56.37 +.39 AI/200=119 broke below 50-day ma... Normally held for 21 months.
Was Tahiti Stock for Quarters 1 and 2, 2007. Hold 21 months.
XOM 84.38 +1.16 AI/200=165... Highest AI/200 Stock. Hold 21 months.
Another head and shoulders top.
Tahiti Stock at end of 3rd and 4th quarters.