BULLISH AND BEARISH SPECIAL SITUATIONS
2008: January - October
Preliminary - 1/4/2008
Click on linked charts to see graphs.
BULLISH SPECIAL SITUATIONS
Usually these were new highs after consolidation.
Conclusions:
Become very concerned about the market when there are multiple
major Peerless Sells and a Support failure. Dec. 2008
Become more concerned when DJI falls more than 20% below
its previous high. When DJI fell below 11200 in Sept. 2008
After Buying a Bullish Special Situation, in this environment certainly,
Sell or take profits when the following conditions present themselves:
1) A Head and shoulders price pattern is completed.
KEQU, GSG, MVG. DBO, MTL, NCOC, APWR, ANR, ILMN, CRY, TACT, IDSA
2) Closing Power fails to make a new high of its own as prices
do, especially near the upper price band. (CP NC)
DBO, MTL, BEXP, SDA, APWR, ANR, USLM, PHX, AVAV, WLL, AVAV
3) Closing Power fell below its ma on significant price right shoulder.
KEQU, DBC
4) Two head and shoulders price patterns appear.
KTEC
5) Closing Power breaks below its long uptrend-line, especially
if prices have advanced a long ways, 50% or more from bottom:
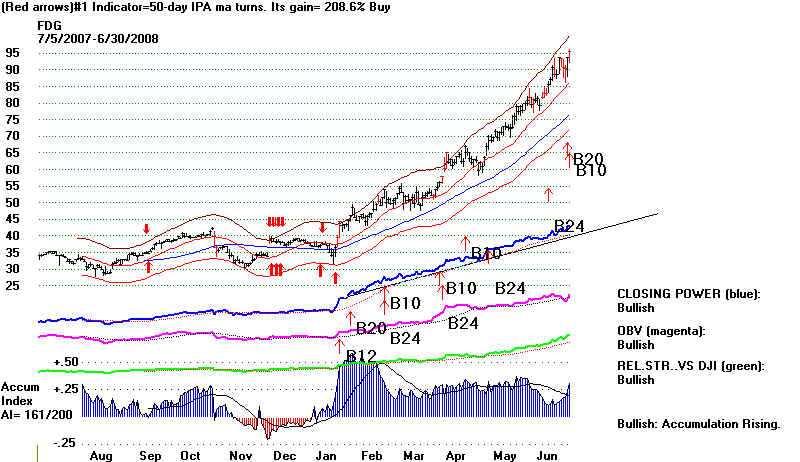
FDG, MVG, NSYS, NCOC, ISYS, NSYS, ILMN, TACT, DLR, IDSA
6) Closing Power starts to trend down, zig-zagging to lower and
lower highs and lows and is below its 21-day ma.
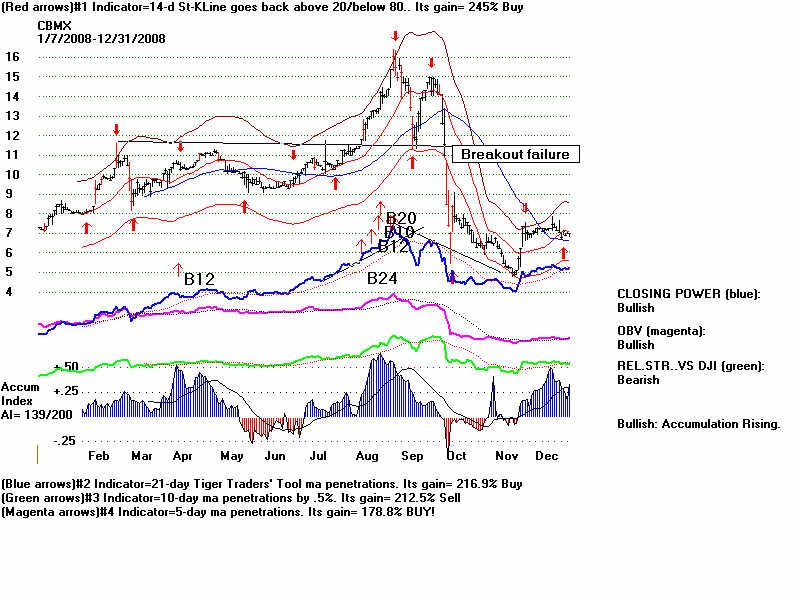
7) There is a price breakout failure.
GBN, NSYS, AXYS, CBMX
8) High volume dumping.
BVX
9) Accum. Index is negative on new high.
ANR
10) OBV NC of new high.
HIL, PHX, FLIR, AVAV, FLIR
11) Price blow-off
AXYS
12) Hands above the head pattern
WLL
13) Closing Power forms its own bearish head and shoulders pattern.
CRY
14) High volume break below 50-day ma, expecially with Accum. Index
below 0. This is often late in the topping out process, but must
be used when there has been a multiple Peerless Sell/DJI
support-failure.
BULLISH SPECIAL SITUATIONS
High Current Price Low 50dma
Date Technical Bases for Selling Break
===================================================================================
1/2/2008 KEQU 16.99 bottom of channel aand AI/200=200 .. 19.8 . 9.01 7 18
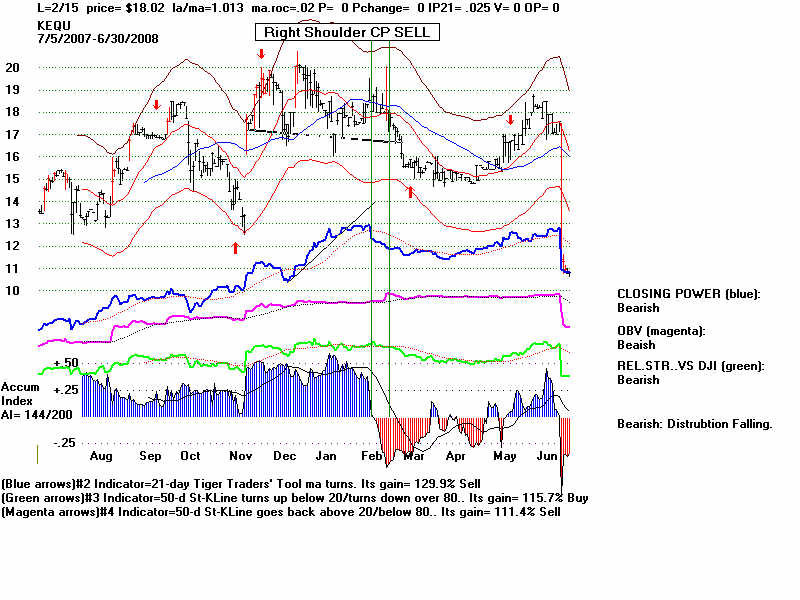
Head and shoulders price pattern
Closing Power fell below its ma on significant right shoulder.
1/5/2008 KTEC 38.07 breakout above rising upper channel AI/200=198 39 18.09 11.5 33
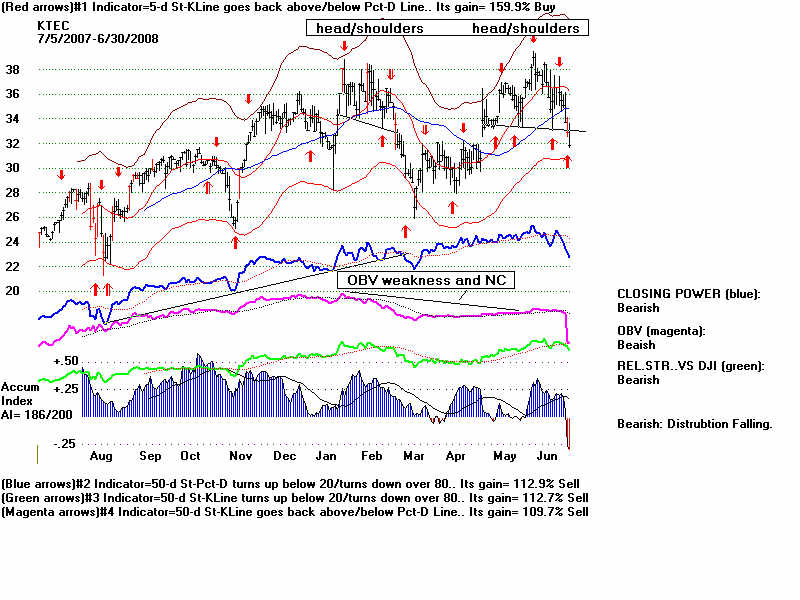
Two head and shoulders price pattern
1/31/2008 FDG 44.64 B12/B24 AI/200=161 95 buy out 74.51 75
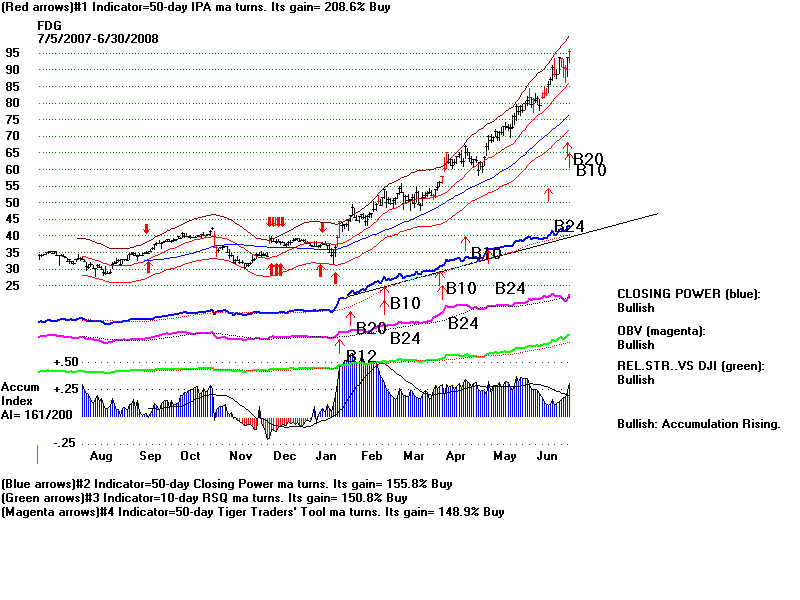
Breakdown of long CLosing Power uptrend.
2/8/2008 DBC 33.37 Flat top breakout B24 AI/200=183 OBV was lagging 46 21.19 20 42
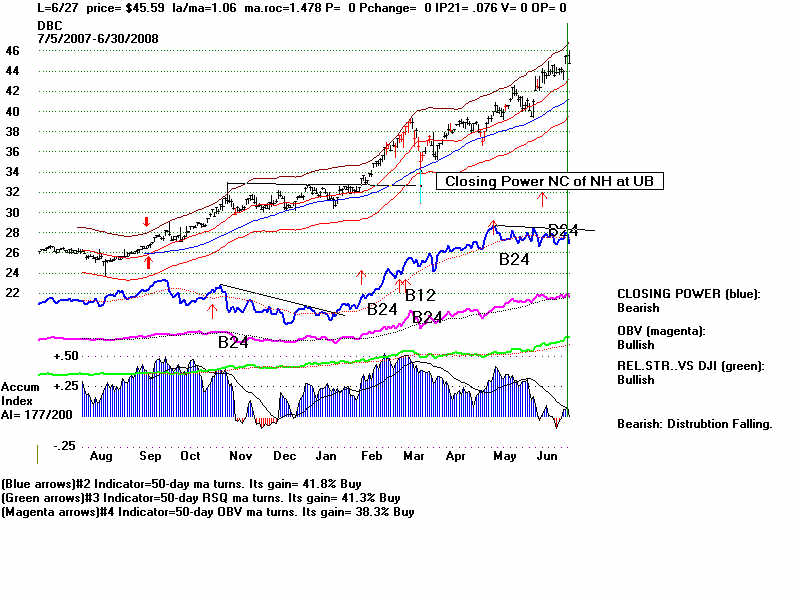
Closing Power fell below its ma on significant right shoulder.
2/19/2008 PBV 114.45 tried to anticipate a flat-topped breakout AI/200=191 buy out?
2/25/2008 GSG 57.47 B12 AI/200=177 76 28.61 27 69
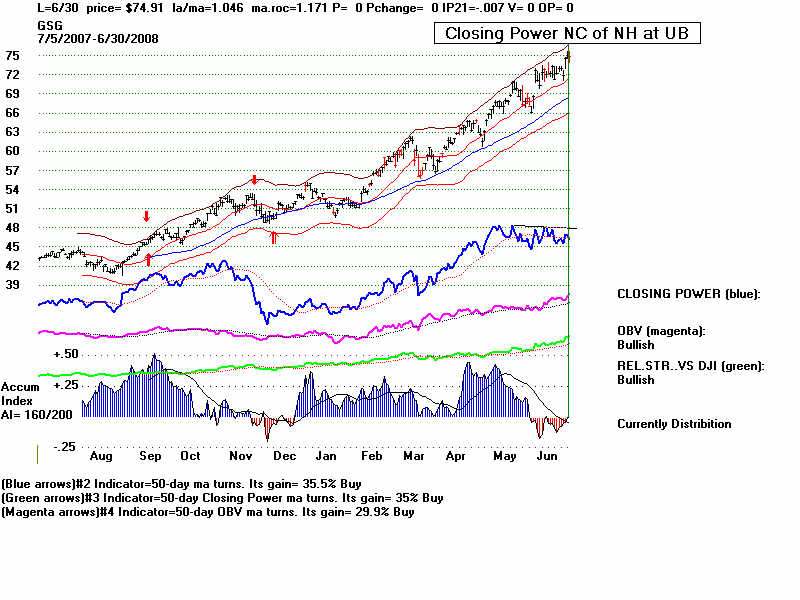
Head and shoulders price pattern.
Closing Power NC
2/26/2008 MVG 14.34 new issue. up from rising 200-dma on high volume 16 4.5 3.2 13.5
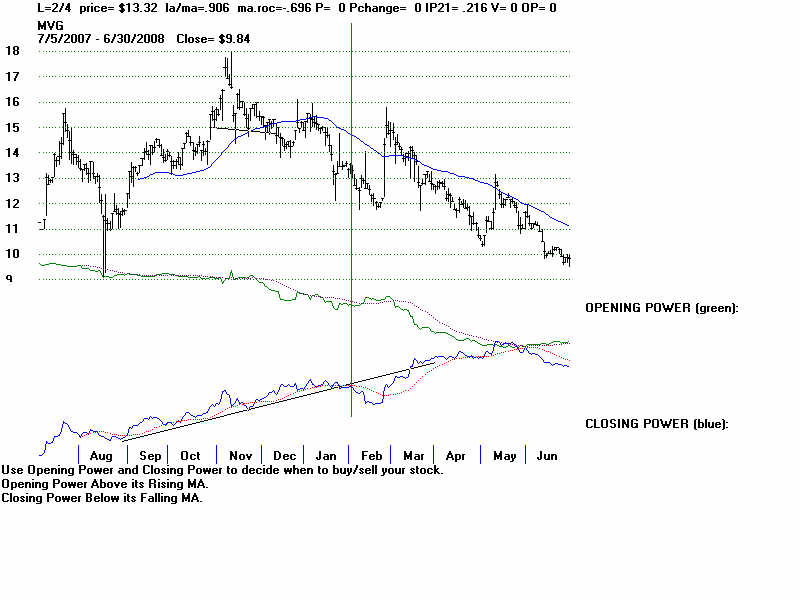
Head and shoulders price pattern.
Opening Power declining.
Closing Power breaks its uptrendline.
2/27/2008 NFLX 32.43 +3.43 B12, B19 AI.200=124 40 29.89 19 30
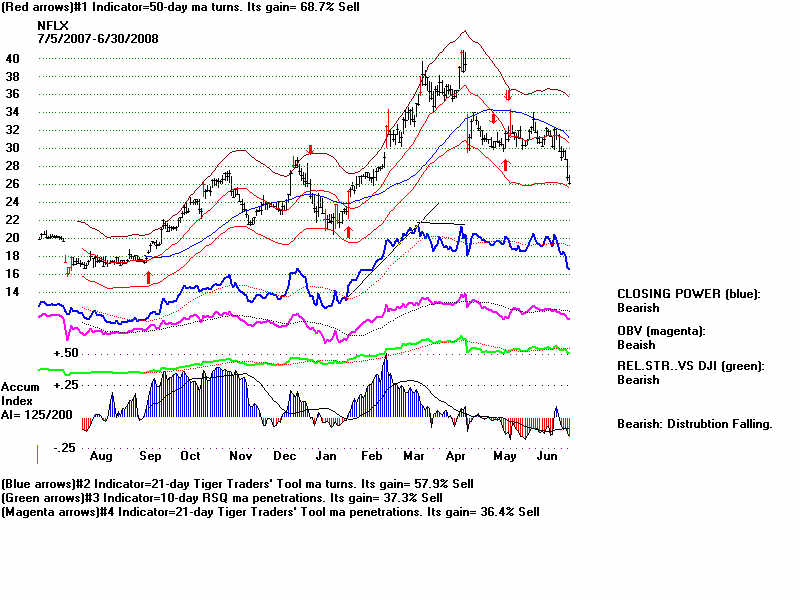
Closing Power NC
Heavy red down volume on decline below 50-day ma
3/11/2008 BZP 20.89 B20 ...already tripled... AI/200=160 no bulge buy out?
3/13/2008 GBN 3.76 flat topped breakout AI/200=150 3.8 1.3 0.75 3.25
Breakout failure.
3/14/2008 XPL 5.64 below flat top at 6.25 AI/200=160 5.7 1.5 1.40 5.4
This never achieved a breakout closing.
3/24/2008 GNET 8.20 Flat topped breakout B24 10.7 5.84 4.5 8.4
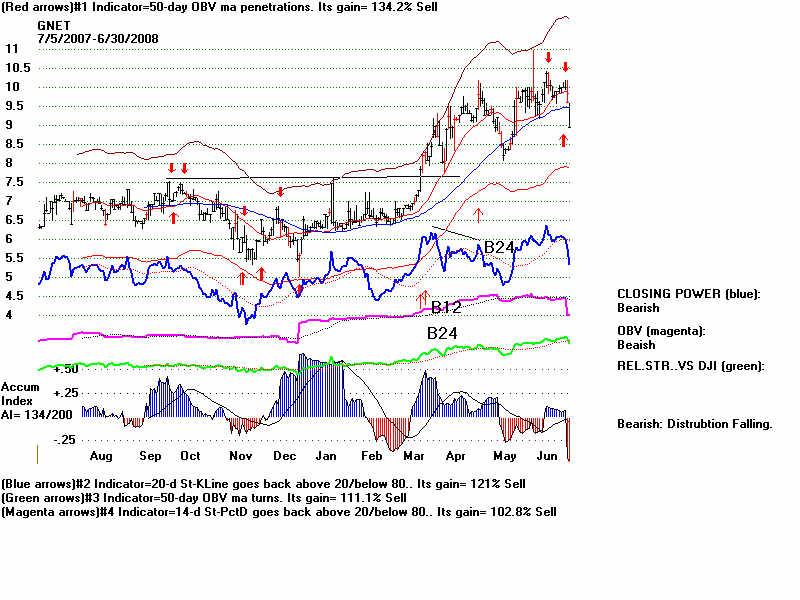
Closing Power NC in April
4/4/2008 FDG 57.75 B24 AI/200=161 95 buy out 74.51 75
Breakdown of long CLosing Power uptrend.
4/9/2008 DBO 41.02 B24 flat topped breakout. AI/200=164 55 19.29 18 48
Closing Power NC and head and shoulders top. Note right shoulder distribution.
4/10/2008 MTL 151.50 flat topped breakout...Already up 300% for year. 57 4.00 4.00 50 T
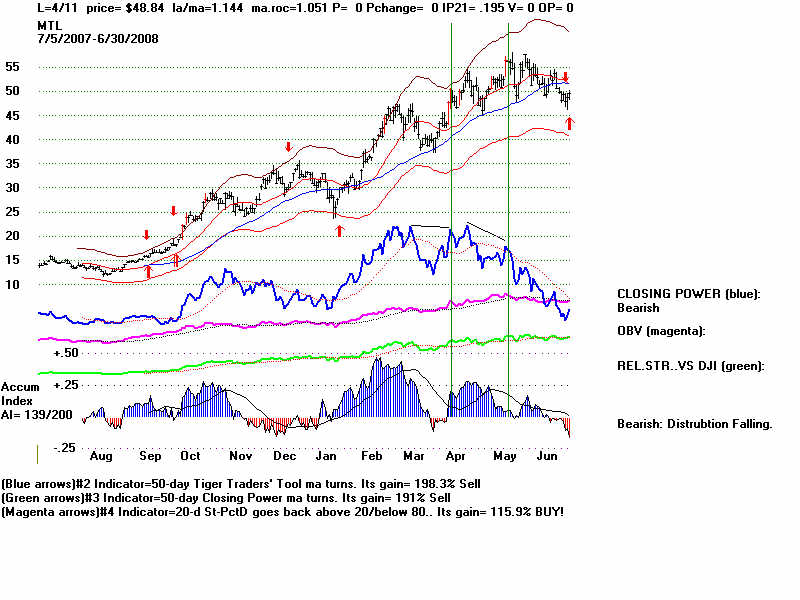
Clear Closing Power NC and head and shoulders pattern.
4/14/2008 BEXP 8.64 flat topped breakout AI/200=151 18 3.20 3 13 T
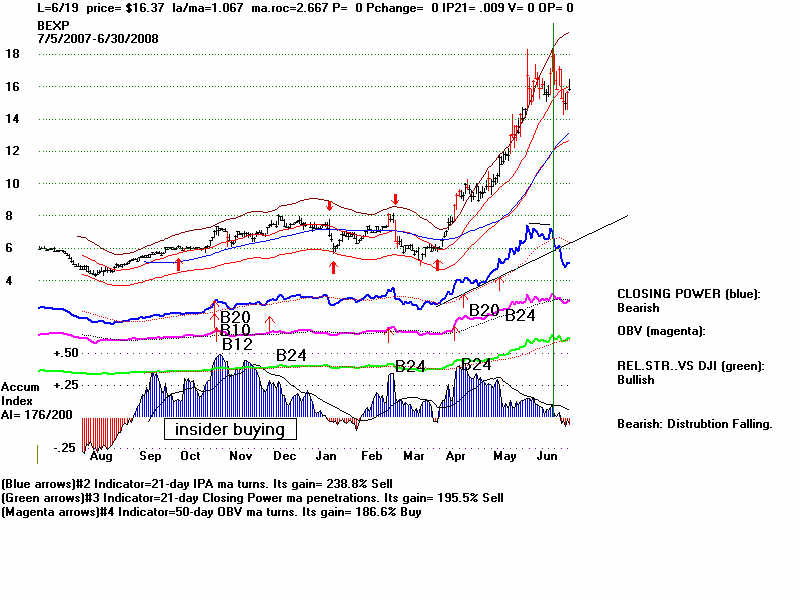
Closing Power NC
4/18/2008 EPLUS 13.30 B12 AI/200=177 ??? buy out
4/23/2008 SDA 21.56 Flat topped breakout AI/200=170 26 4.90 3.8 22
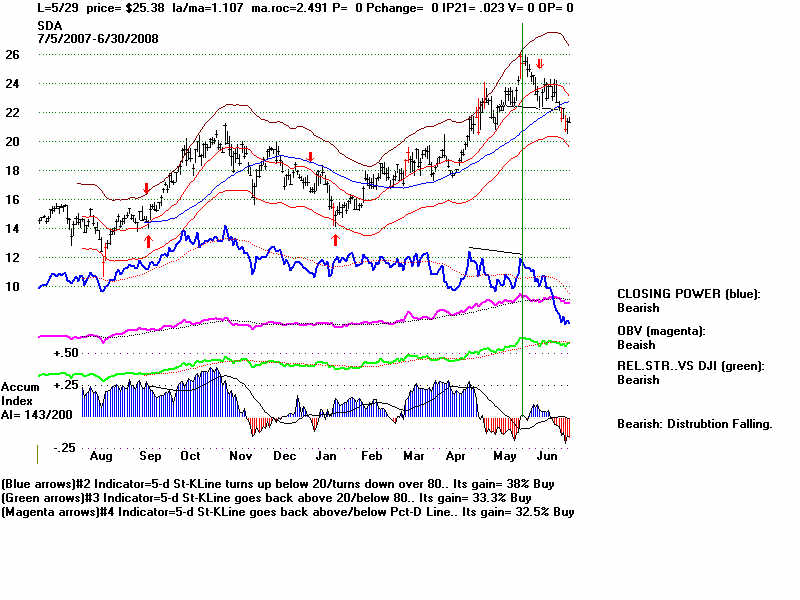
Closing Power NC
4/25/2008 BVX 8.56 B10,B12, B29 AI/200=147 9.2 6.24 4 7
Heavy volume dumping after rally.
5/1/2008 IDRA 14.55 B24 flat topped breakout 15.5 7.60 6 13.5
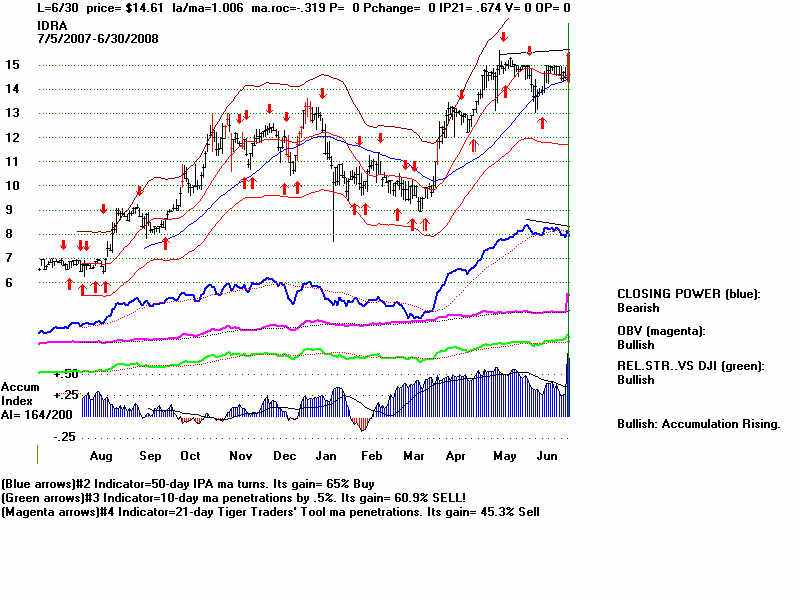
Closing Power NC of new high,
5/2/2008 BVX 9.09 B24 AI/200=147 9.25 6.24 4 7
high volume dumping.
5/5/2008 CDY 2.50 diagonal downtrendbreak B12 AI/200=170 3.6 1.1 .85 2.1
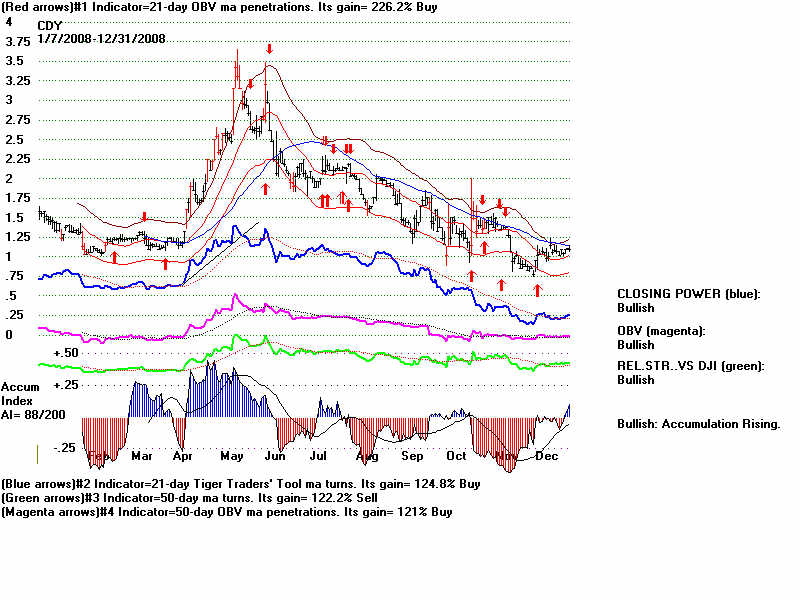
Tripled in a month. Double top and breakdown.
5/7/2008 RDEA 15.22 AI/200=137 needs to breakout above flat top at 15.5 It never did, 11.97
Never achieved a breakout.
5/15/2008 NSYS 9.40 B10,B12, B20, B24 AI/200=124 14.5 4.0 3.75 10
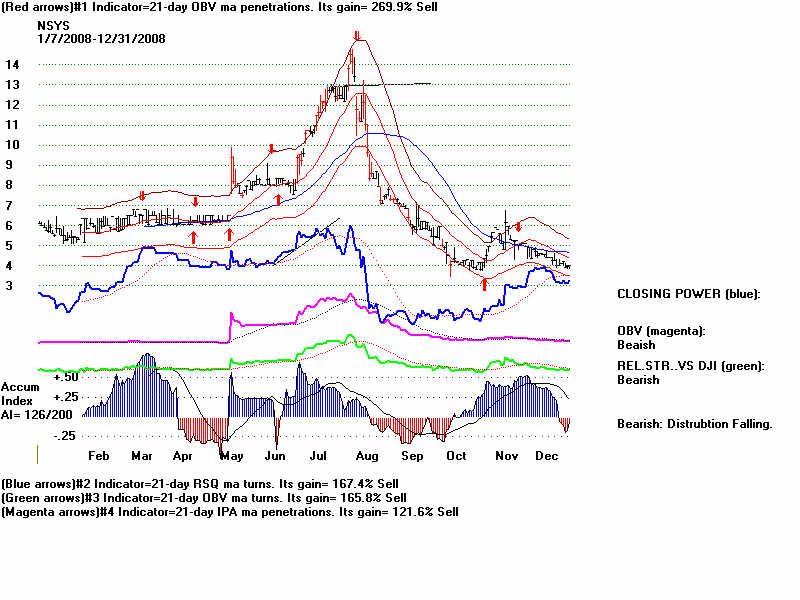
Breakout failure at 13..
Closing Power uptrend-break after prices doubled.
5/15/2008 NCOC 7.10 B24 but a day late, broke out at 5.75 AI/200=171 10.5 1.27 1.0 7
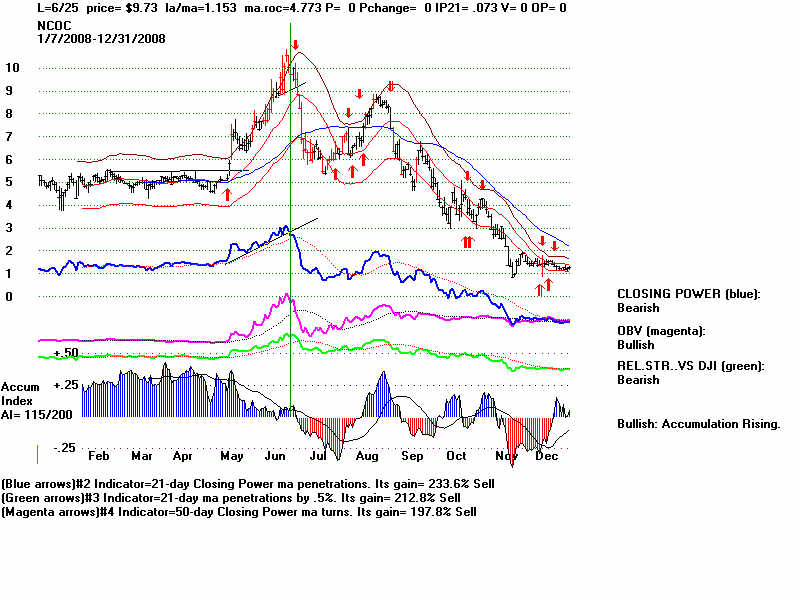
Quick head and shoulders and heavy downside volume after a double.
Closing Power uptrend-break after prices doubled.
5/16/2008 APWR 22.50 B12, B20, B10, B24 AI/200=173 but already up 200% 31 4.3 4.0 21
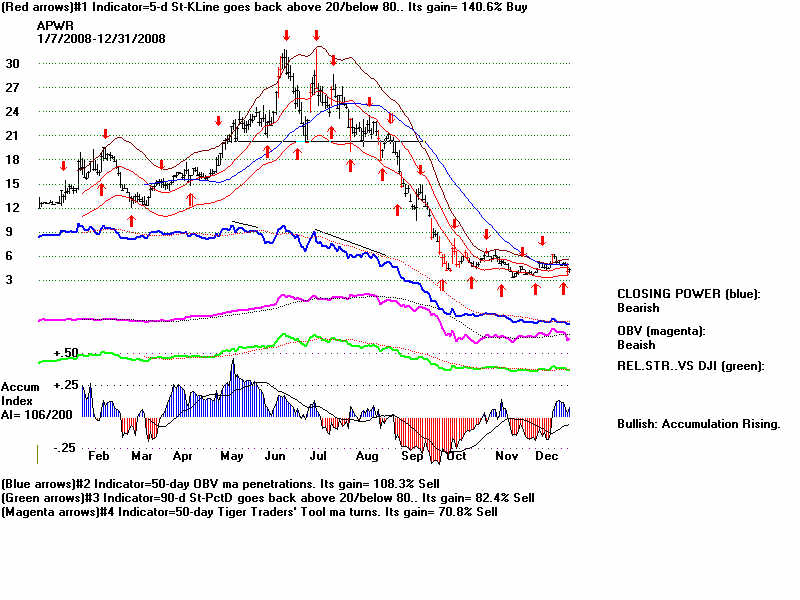
Should not have been recommended based on CLosing Power NC.
CLosing POwer NC and head and shoulders top.
5/23/2008 ISYS 18.50 B20 AI/200=181 (split 2:1) 26.5 12.05 9.0 22
Broke CLosing Power uptrend after a double. .
5/28/2008 ANR 79.61 AI/200=181 already quadrupled! 119 16.19 16.0 81
Top called by Closing Power NC, IP21 NNC, head and shoulders top.
5/29/2008 HIL 15.96 B24 AI/200=188 17.5 7.04 3.8 15
Top called by OBV NC
5/30/2008 AXYS 59.16 B24 AI/200=164 80 54.86 44 54
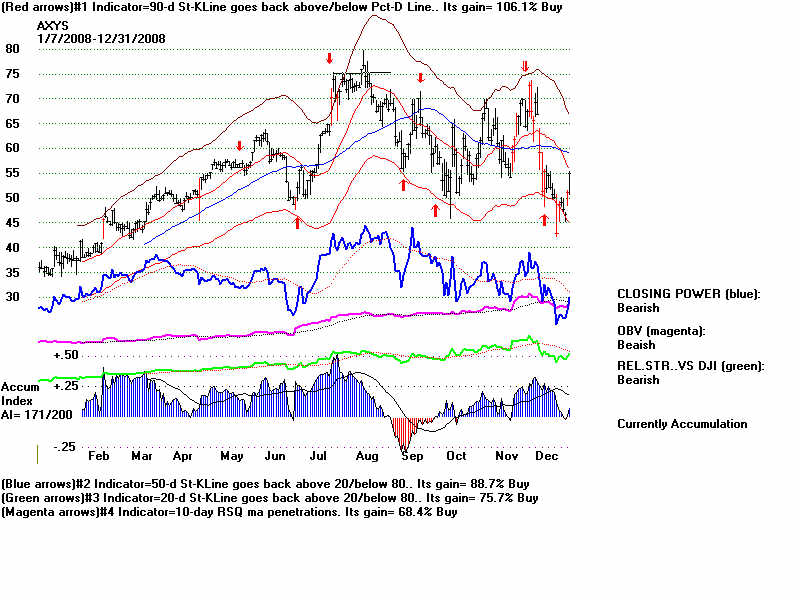
Top called by shakeout and blow-off.
6/6/2008 DBC 43.20 zig-zagging up AI/200=183 OBV was lagging 46 24.19 20 42
Top called by Closing Power NC and IP21<0 on NH.
6/13/2008 INTX 11.39 flat topped breakout AI/200=127 13 5.20 2.5 9.8
Top called by head and shoulders, Closing Power NC. and move to upper band with IP21<0
6/13/2008 APWR 26.38 B24 AI/200=181 but already tripled. 31 4.3 4.0 21
Massive head and shoulders top. Closing Power NC.
Closing Power is declining on right shoulder
6/17/2008 USLM 40.30 B12,B24 AI/200=151 thin 45.5 23.95 20 37
Closing Power NC at upper band.
6/17/2008 PHX 37.77 breakout past top rising channel line. AI.200=177 40 18.00 16 32
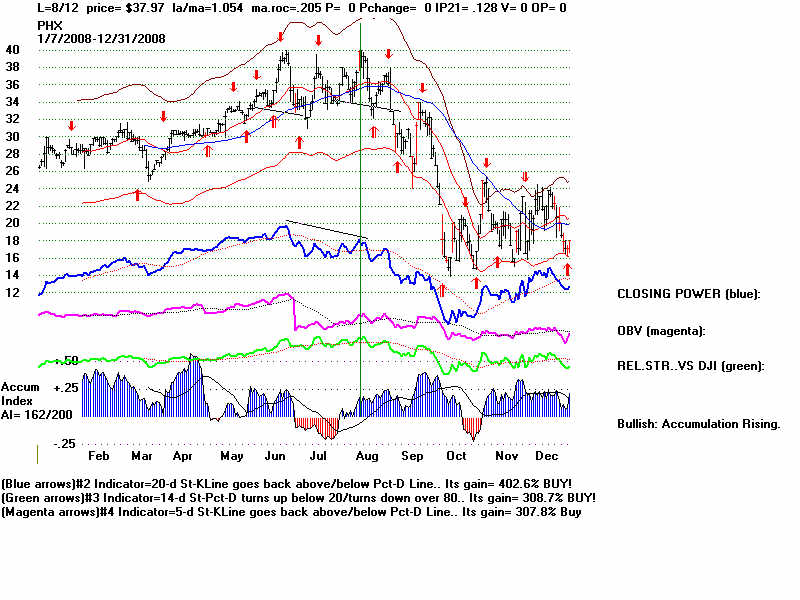
Top called by OBV NC, Closing Power NC
6/20/2008 FLIR 39.20 B12 AI/200=127 45.5 30.68 24 39.5
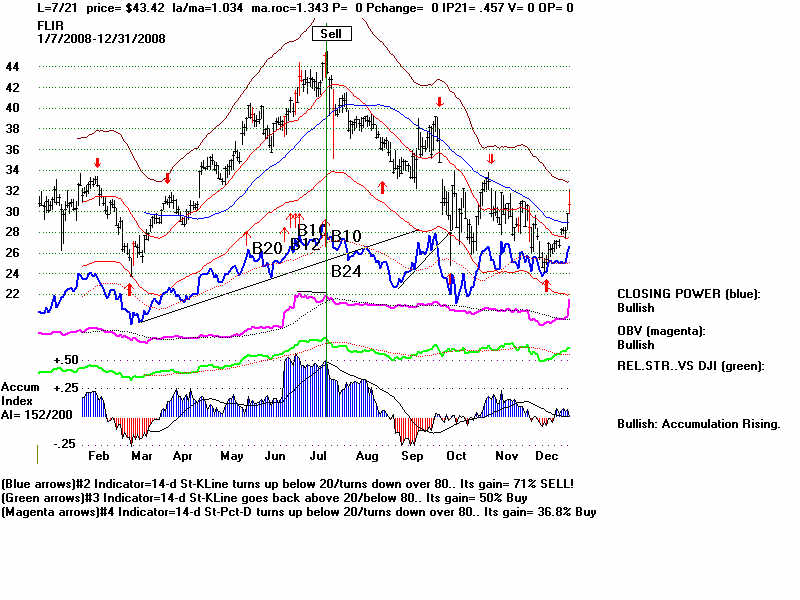
OBV NC
6/25/2008 DRS 79.83 AI/200=146 Buy out. at 80.5
6/25/2008 AVAV 28.64 AI/200=186 B10, B24 38 36.81 26 30
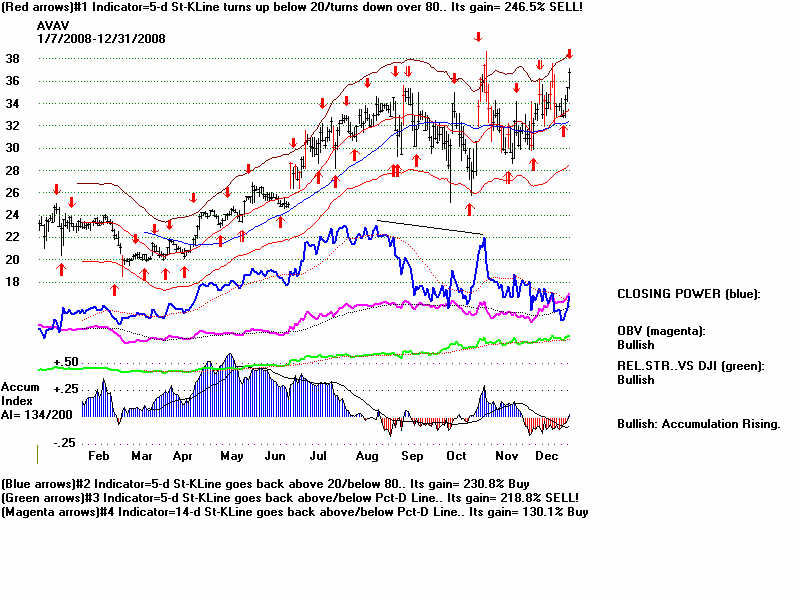
Top called by OBV NC, IP21<0 and Closing Power NC
6/25/2008 FLIR 40.71 B12 AI/200=130 45.5 30.68 24 39.5
OBV NC
6/30/2008 DMRC 14.16 B12 with big gap AI/200=101 Stopped trading at 15.
7/1/2008 WLL 110.66 monor flat topped breakout AI/200=1 110 38.46 29 95
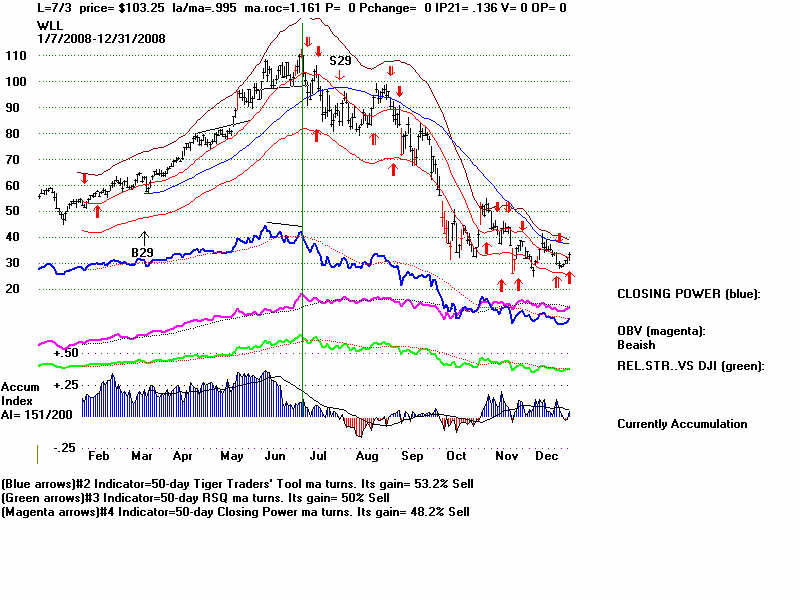
Closing Power NC
Bearish hands above the head pattern.
7/11/2008 IDRA 15.36 not yet broken out over flat topped resistance at 15.5 AU/200=164
7/16/2008 BRCAA 27.05 flat topped breakout. B24 AI/200=156
7/16/2008 PMFG 52.87 B10 AI/200=174
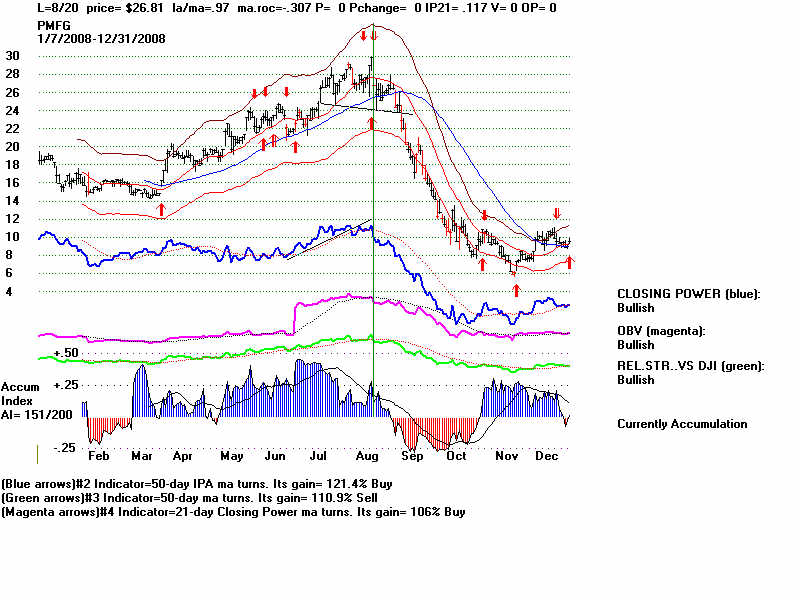
7/18/2008 FLIR 45.10 B12 AI/200=141 45.5 30.68 24 39.5
OBV NC
7/21/2008 AXYS 64.75 N25 AI/200=183 80 54.86 45 61
False breakout at 75.
7/27/2008 ILMN 91.95 AI/200=165 48 26.05 20 43
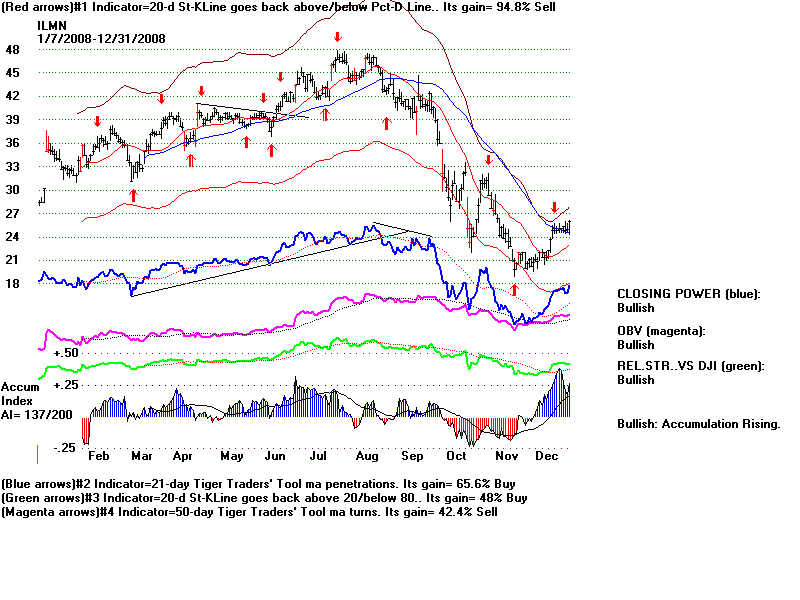
Head and shouldes top and violation of Closing Power uptrend and reversal.
Declining 50-dma, negative Accumulation and falling Closing Power
7/23/2008 AVAV 32.40 AI/200=188 up up up 38 36.81 26 31
Note the NC by Closing Power of high at 38.
8/1/2008 CRY 13.66 AI/200=161 B12 but far above point of breakout. 17 9.71 7 13.5
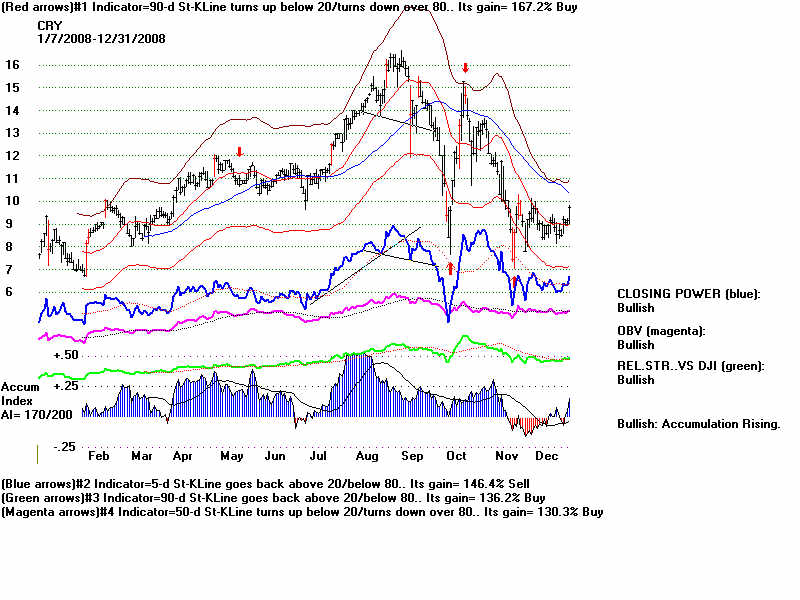
Head and Shoulders in Price and Closing Power.
8/7/2008 TACT 11.25 B10,B12 AI/200=166 13.5 4.59 3.5 10
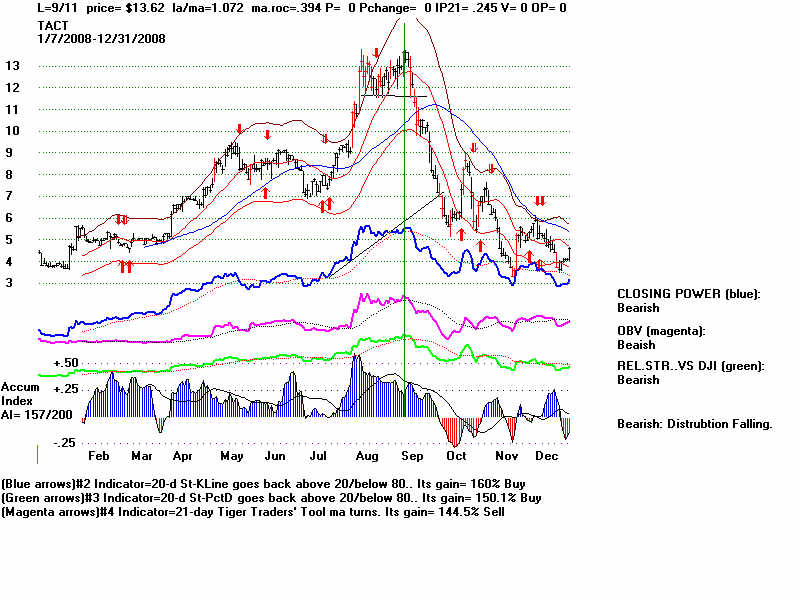
Closing Power failed to confirm final high and then broke 9 month uptrend-line.
Stock gad already tripled off January low. A "piffle" stock.
8/8/2008 DLR 45.82 AI/200=159 51 32.85 20 43
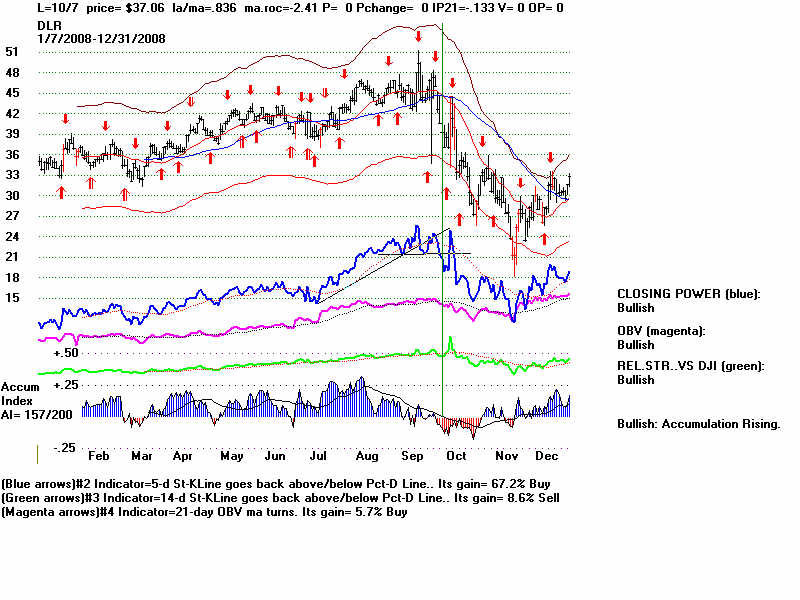
Breakdown and Turning down of Closing Power 50-day ma
8/15/2008 IDSA 18.11 AI/200=132 rising channel 19 5.45 5 14.25
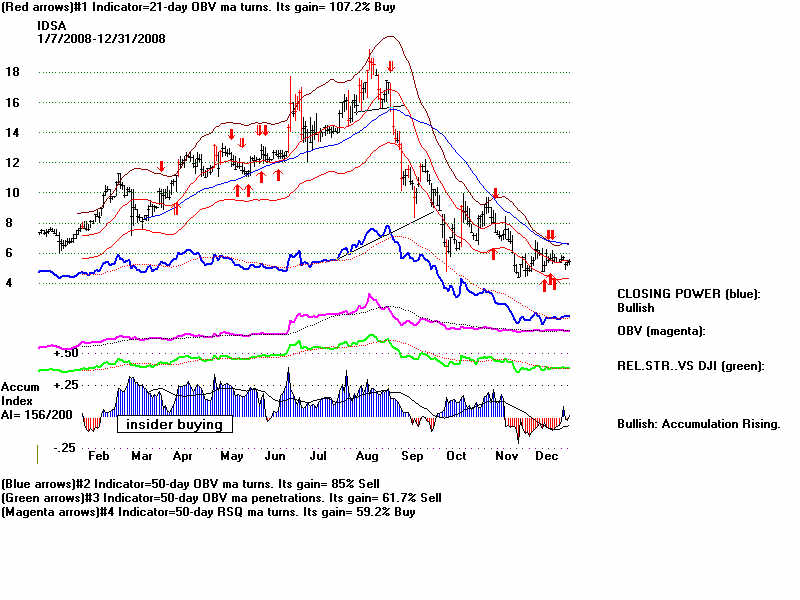
head and shoulders top.. High volume break below 50-dma.
Closing Power trend break after a 6 month triple.
8/22/2008 CBMX 13.10 AI/200=170 B10, B12
8/26/2008 NPSP 7.69 AI/200=169 breakout was at 6.5
8/27/2008 CLHB 81.69 flat topped breakout AI/200=120
8/29/2008 CBMX 14.36 AI/200=170 B10, B12
Breakout failure
Declinming CLosing Power after a 7mo double.
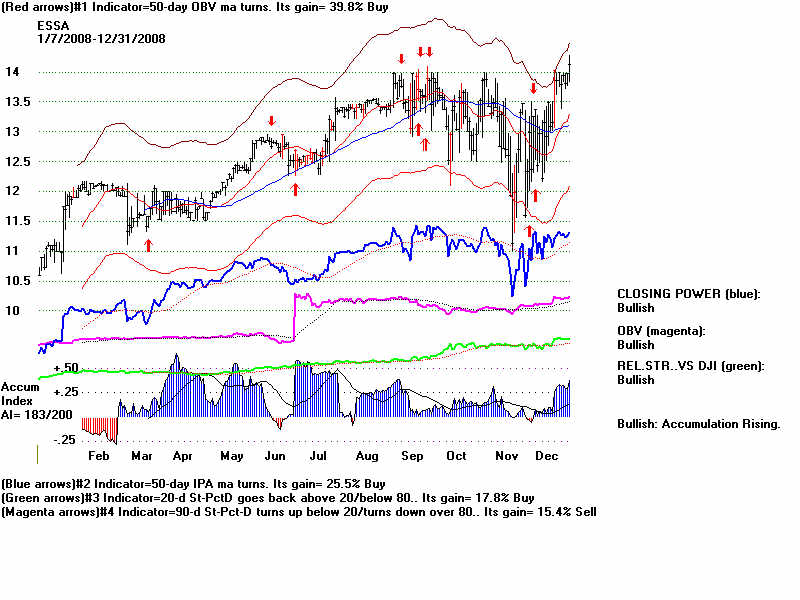
9/3/2008 ESSA 13.97 B24 flat topped breakout AI/200=166
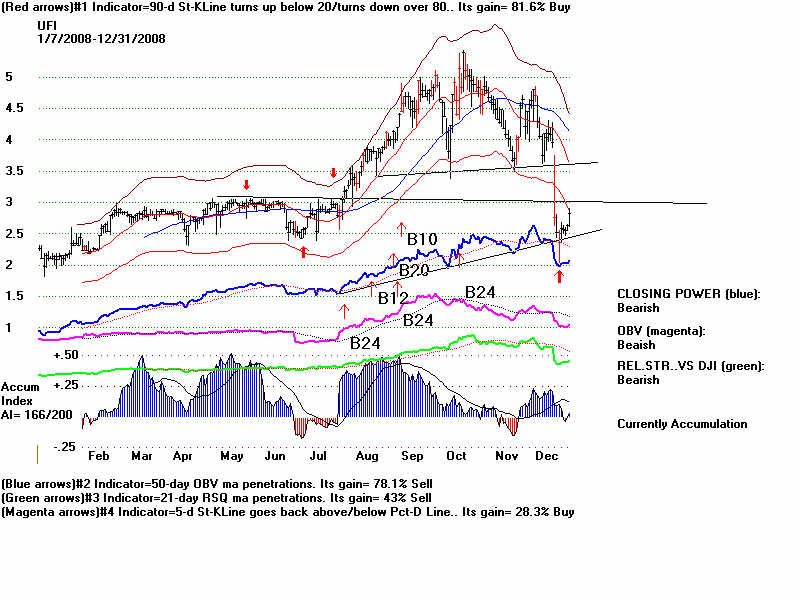
9/5/2008 UFI 4.16 B12,B20, B24 AI/200=144
OBV NC
9/19/2008 NHI 34.52 AI/200=175 flat topped breakout
9/26/2008 OTIV 3.10 needed to move past 3.4. Never bought. B12 AI/200=181
10/3/2008 GLD 82.59 Red Buy
10/8/2008 CMP 48.29 at base AI/200=125
10/20/2008 EBS 18.30 AI/200=161 B24
10/27/2008 SLV 919.50 Red Buy
10/29.2008 PAAS 11.46 Red Buy
10/31/2008 ANEN 12.4 AI.200=?
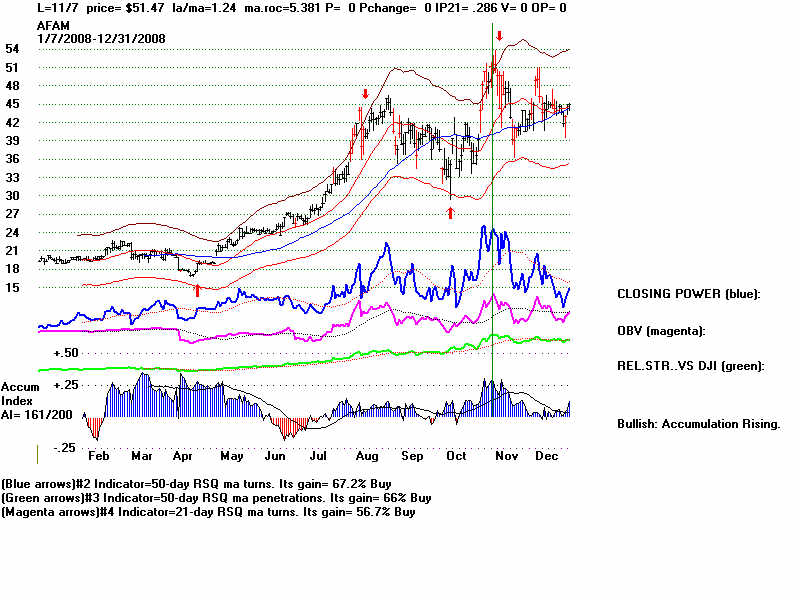
10/31/2008 AFAM 48 AI/200=148
Already doubled and Closing Power NC
Usually these were new lows after consolidation in stocks
that showed heavy red Distribution.
Conclusions.
Usually the breaking of the Closing Power downtrend.
If there was no clear CP downtrend, the the coming
of the CP above its 21-day was usually a good place
to cover a short sale to avoid the risjs of a rally.
Often, waiting for the price recovery and selling short
on the next rupturing of the rising CP uptrend by the
CP was very profitable.
Classic cases:
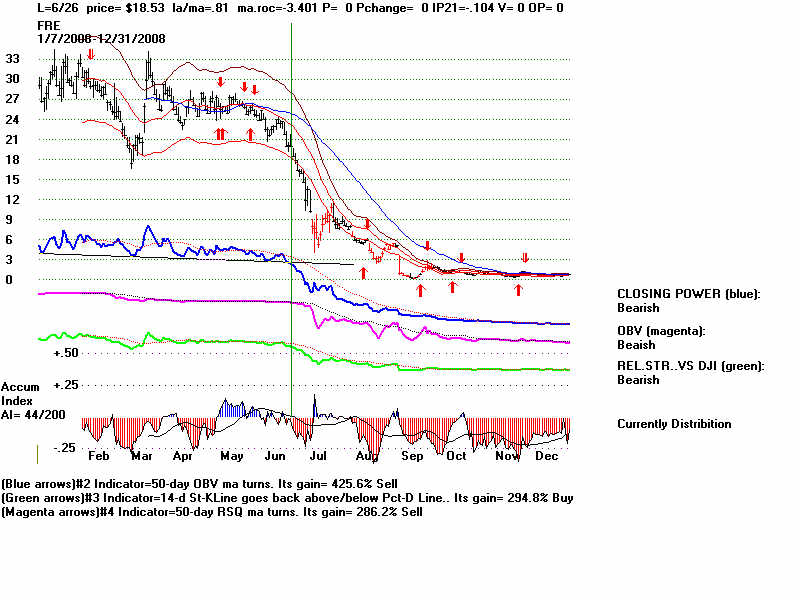
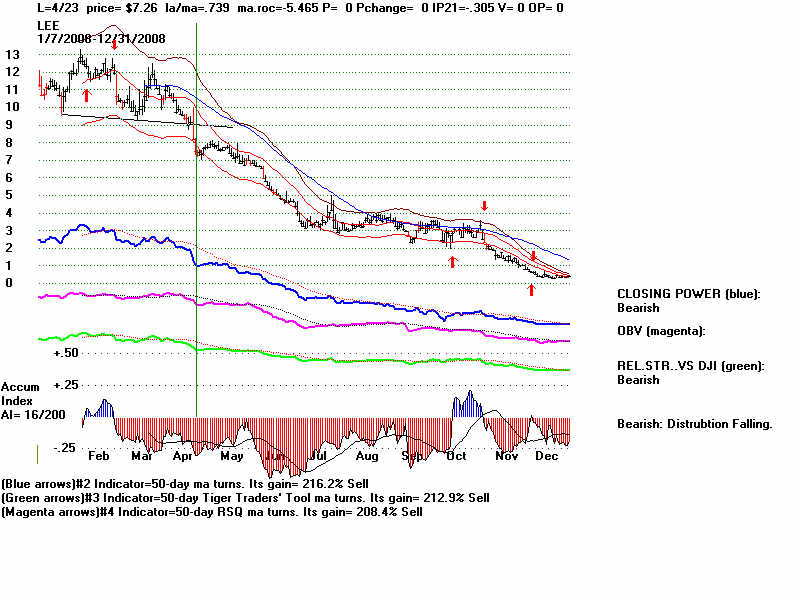
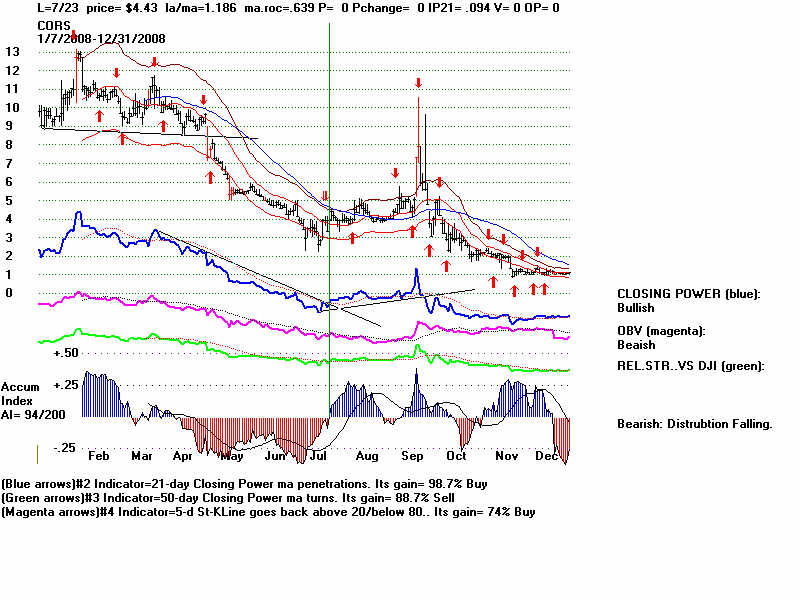
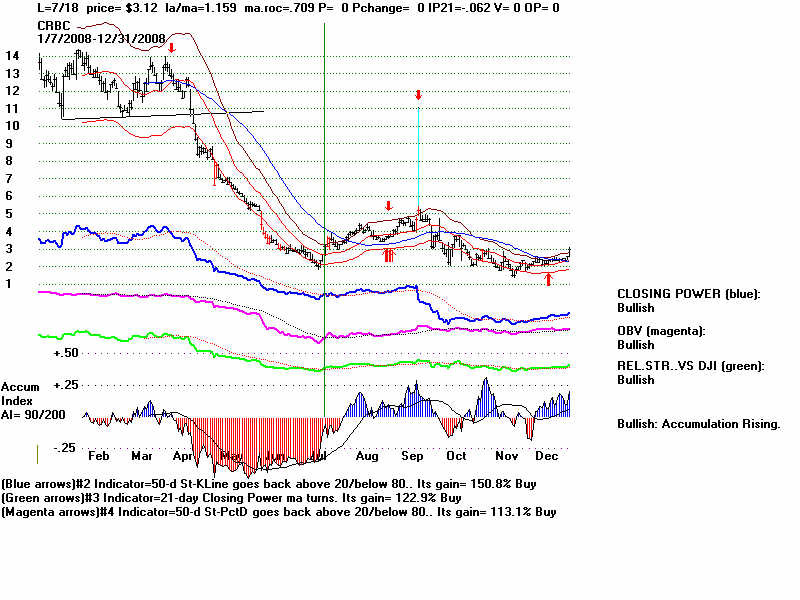
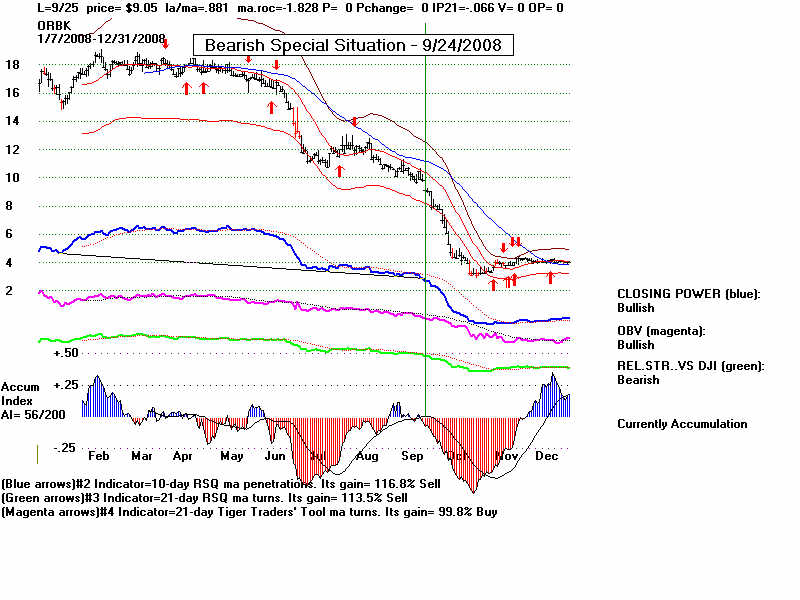
FRE. LEE CORS CRBC VCBI ABR LIZ MGM AIG LOGI IGT MTW ORBK
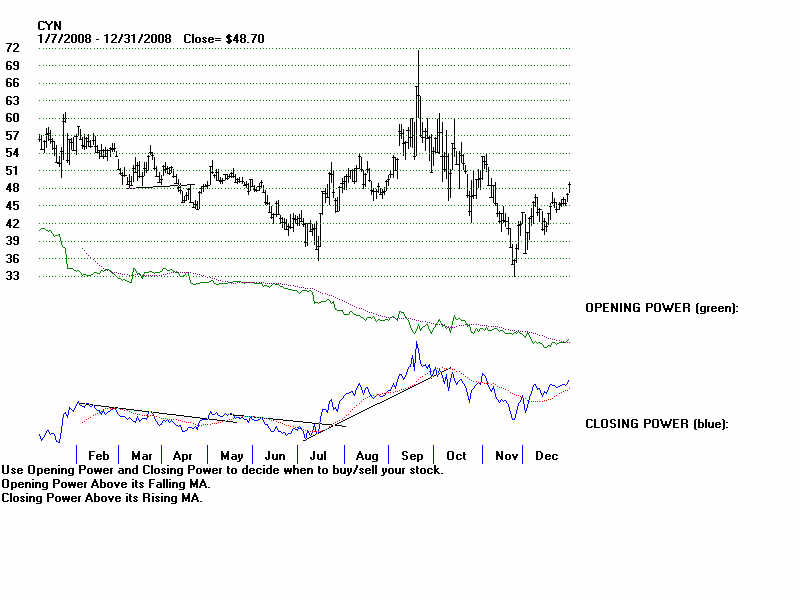
But one has to be ready to close short sales if there
is a high (red price bar) reversal back above point of
breakdown. CYN
After the rally, watch for reversal back downwards when
CP uptrend is violated.
SHORT SALES Close Low Moved over 500day ma
Date
---------------------------------------------------------------------------------------------------------------------------
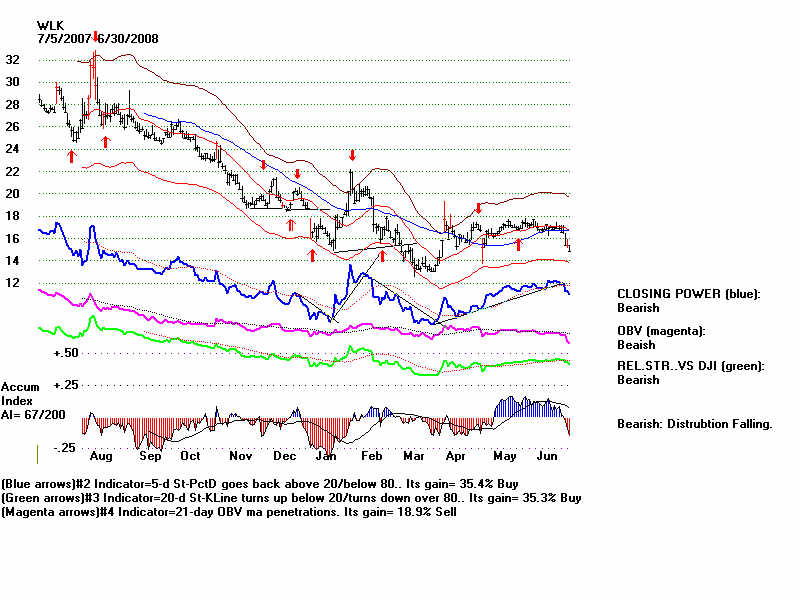
1/25/2008 WLK 17.02 AI/200=32 12.5 16.29 17
Using well-defined trends of Closing Power would have helped a lot.
1/25/2008 ISLE 10.62 AI/200=14 3.20 2.5 7.5 - Us CP vis-a-vis CP MA.
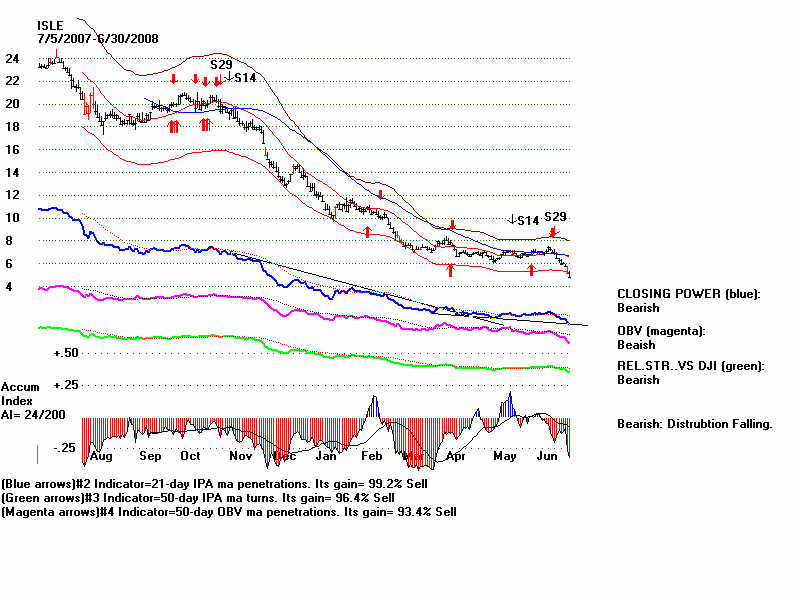
2/1/2008 AGYS 13.20 AI/200=27 4.29 2.07 11.5 Use well-defined trends of Closing Power
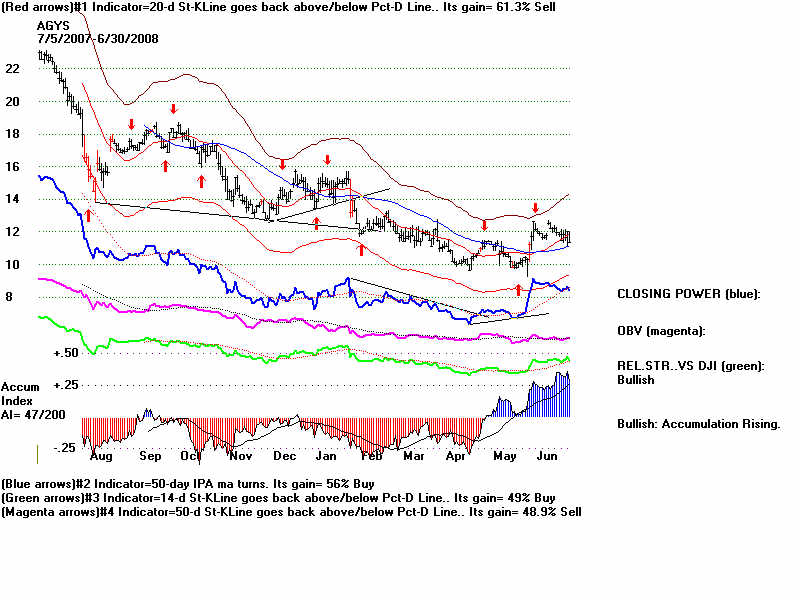
2/8/2008 HAR 39.72 AI/200=6 16.73 13.00 44 Using CP trend was vital here.
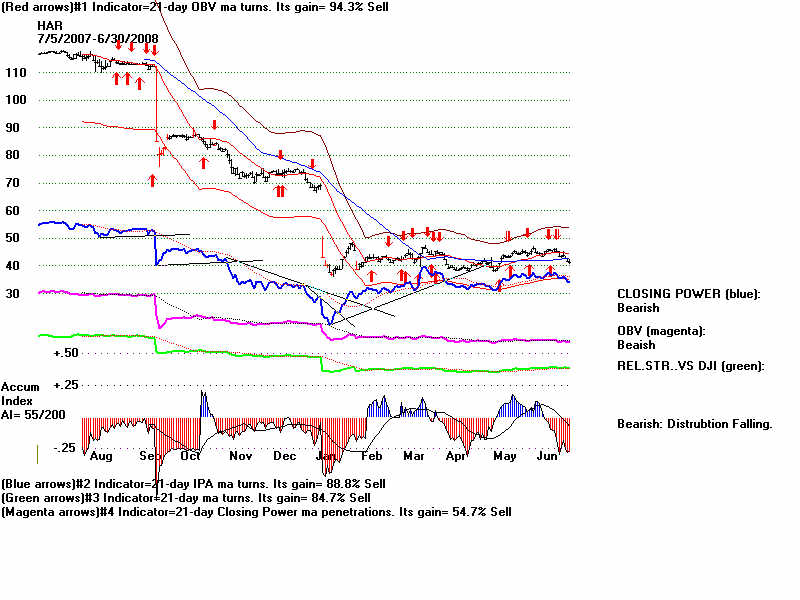
2/12/2008 TBBK 10.5 AI/200=49 3.75 2.5 12.5 Watch for CP support failures.
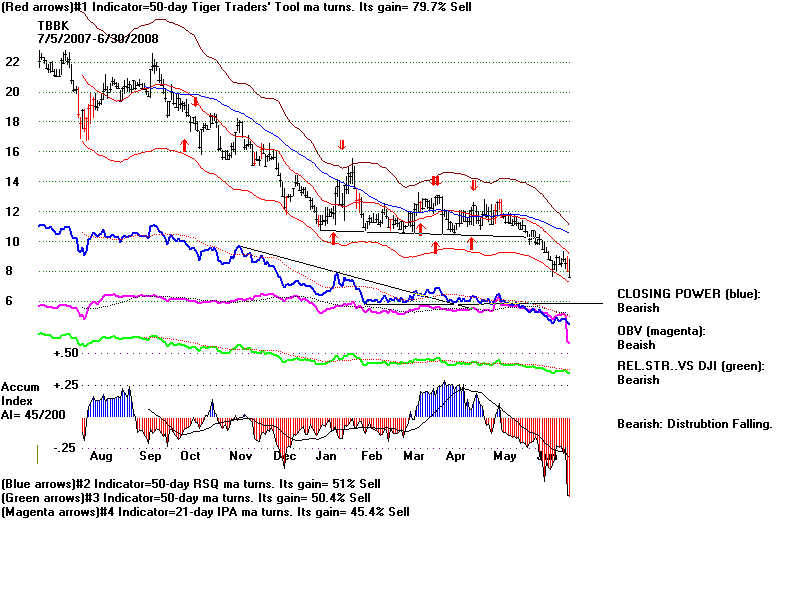
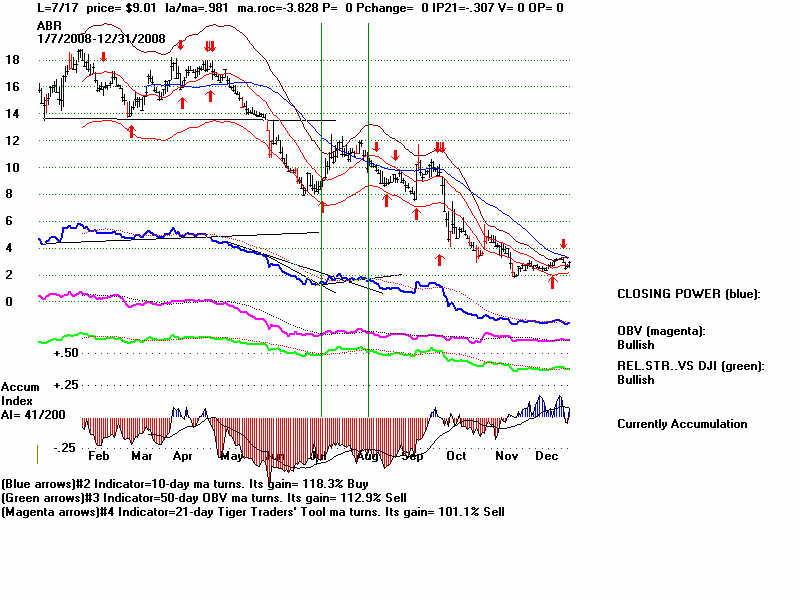
2/14/2008 ABR 15.76 AI/200=57 2.95 2.0 17 Use CP versus CP MA and CP breakdowns..
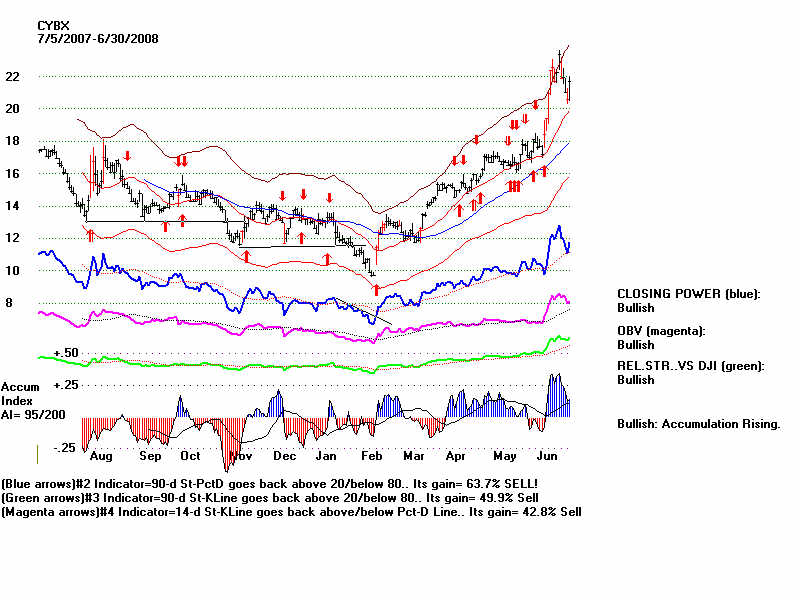
2/25/2008 CYBX 9.74 AI/200=60 13.00 10.0 12 Had to use CP trend.
Note high volume reversal after false breakdown..
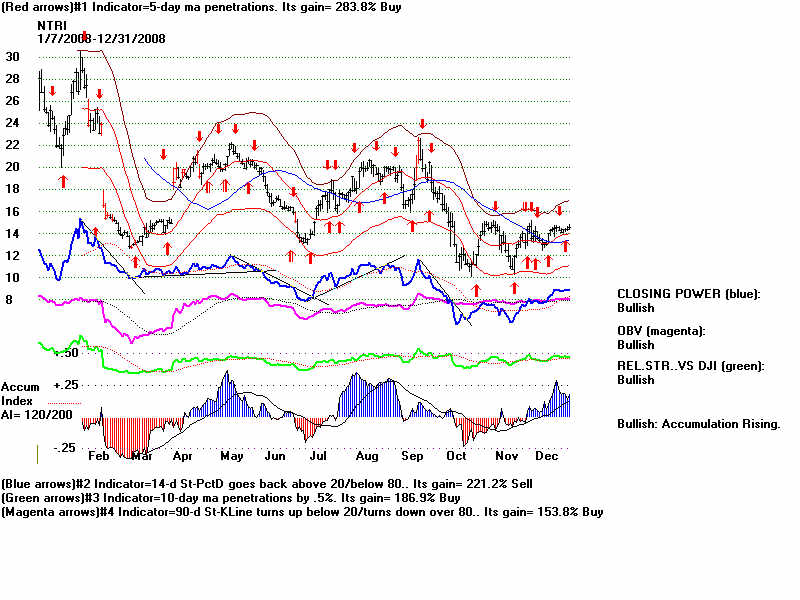
2/21/2008 NTRI 15.40 AI/200=66 Use CP's breaking of downtrend to go long.
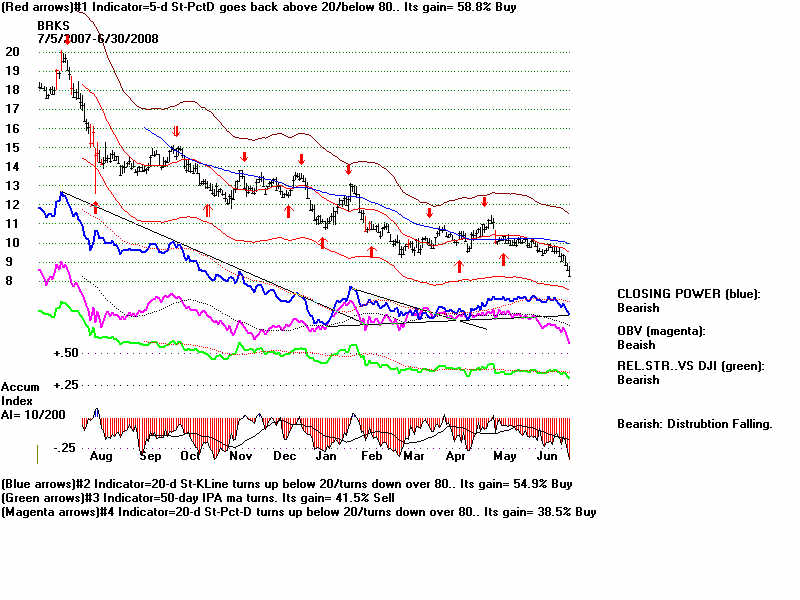
2/22/2008 BRKS 10.33 AI/200=16 5.81 2.75 10.75 Use CP trend.
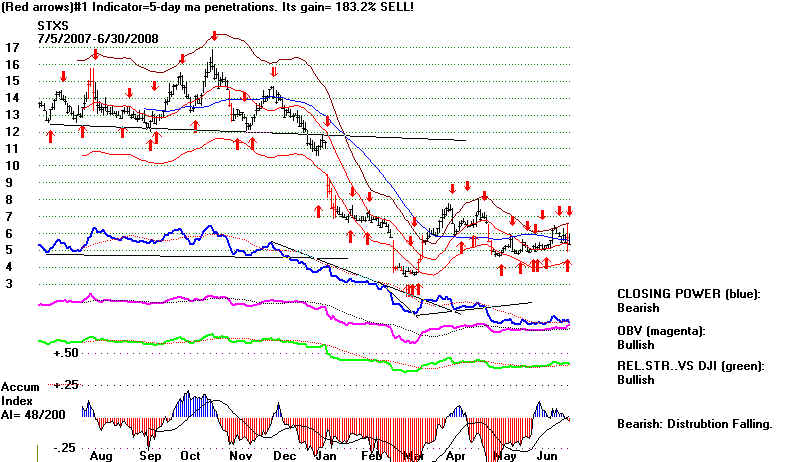
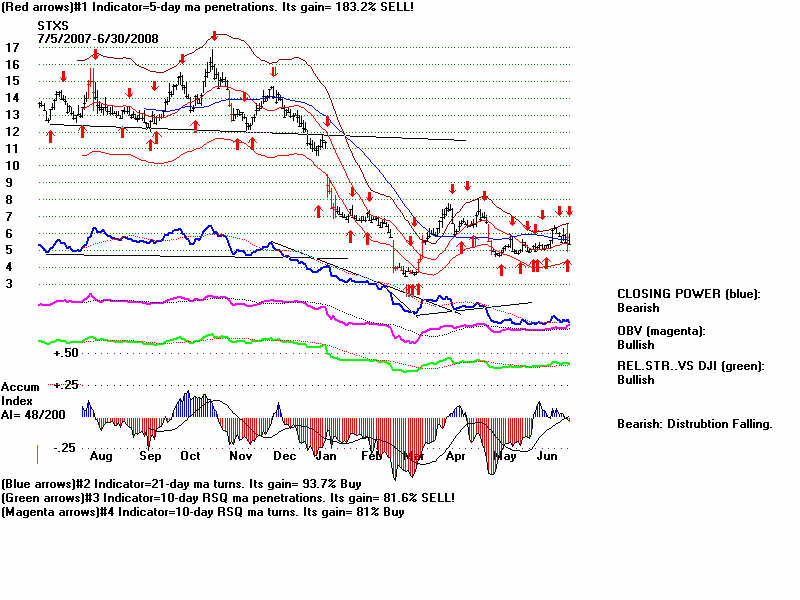
2/28/2008 STXS 6.05 AI/200=69 4.40 2.9 6.5 See above
2/29/2008 ??? WTM 11.17 AI/200=17
3/2/2008 FRE 24 AI/200=59 0.73 0.7 30
Classic Closing Power Breakdown below its own well tested
suppor ton 6/26 at 18.53
3/7/2008 NTRI 12.83 AI/200=66 14.59 11 18
3/10/2008 FMD 9.5 AI/200=94 1.29 1 4
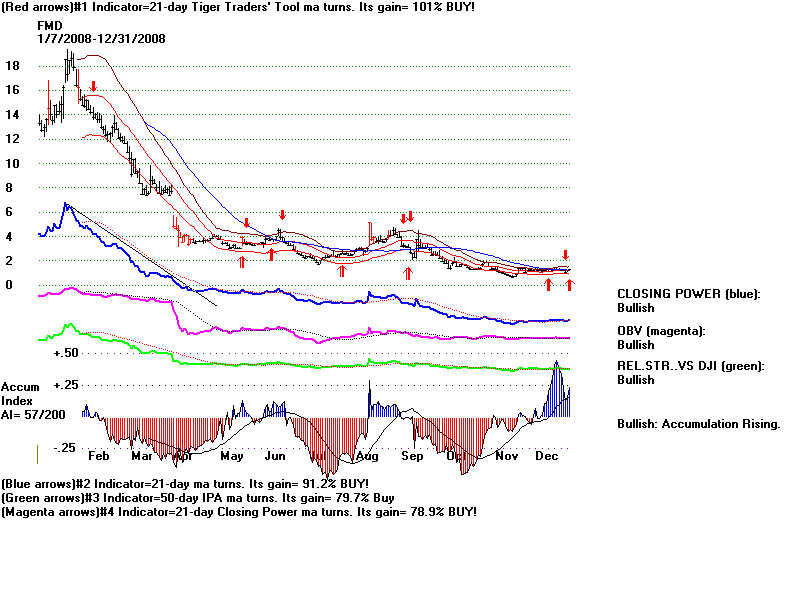
3/14/2008 BGVF 7.91 AI/200=22| 3.00 2.5 not yet very thin!
3/20/2008 ACMR 5.55 AI/200=88 1.40 1.0 7.5
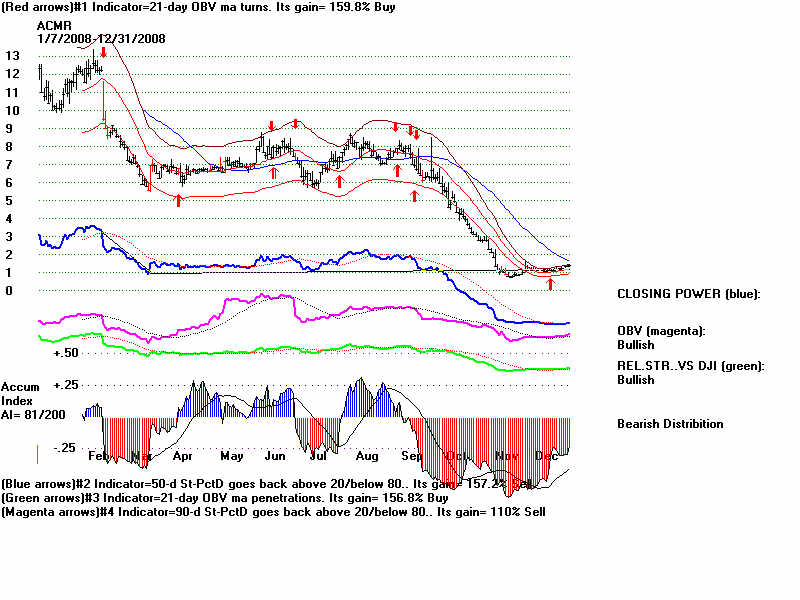
look at breandown in September.
3/23/2008 XRIT 5.35 AI/200=57 best to cover when CP>CPMA - fell to 1.31 in May.
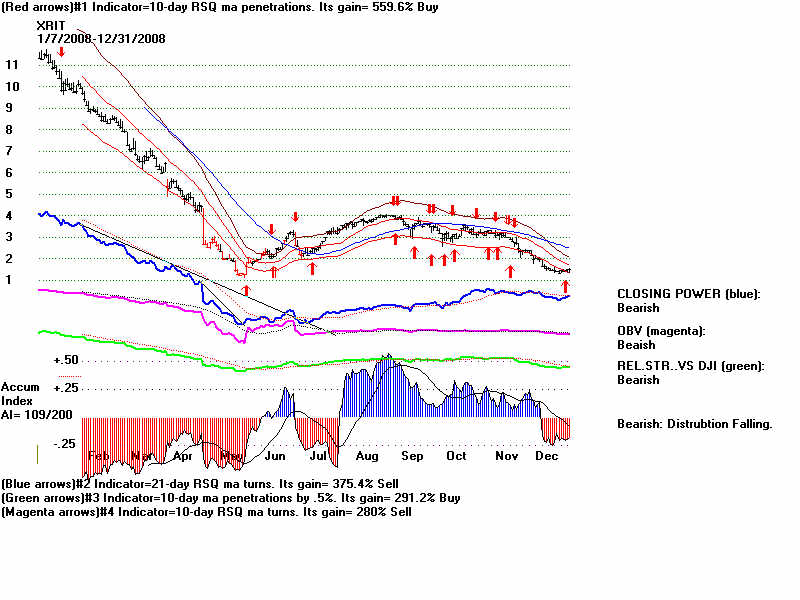
3/26/2008 JBIL 9.29 AI/200=72 stock disappeared. ???
3/28/2008 GSBC 15.50 AI/200=31 best to cover when CP>CPMA - fell to 8.92 in July.
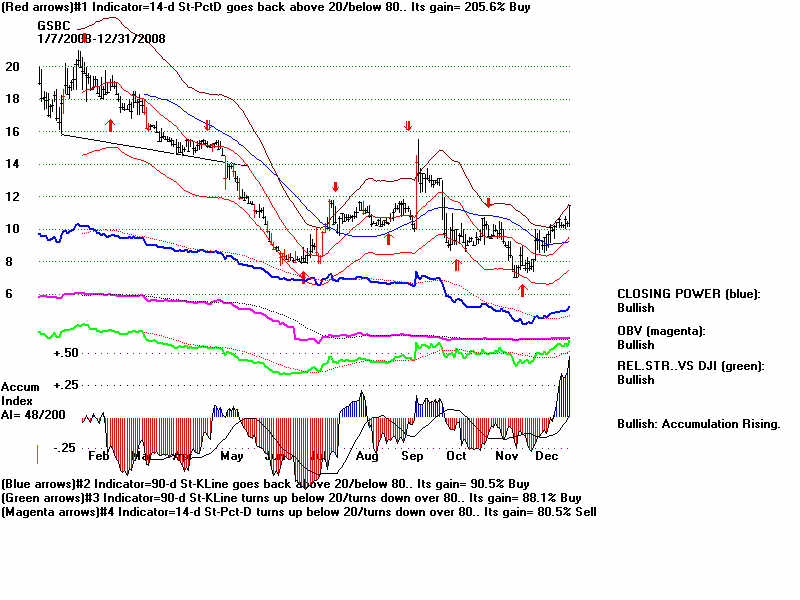
4/3/2008 HNI 24.82 24.82 AI/200=49 covering when CP>MA - fell to 22.69 on 5/14
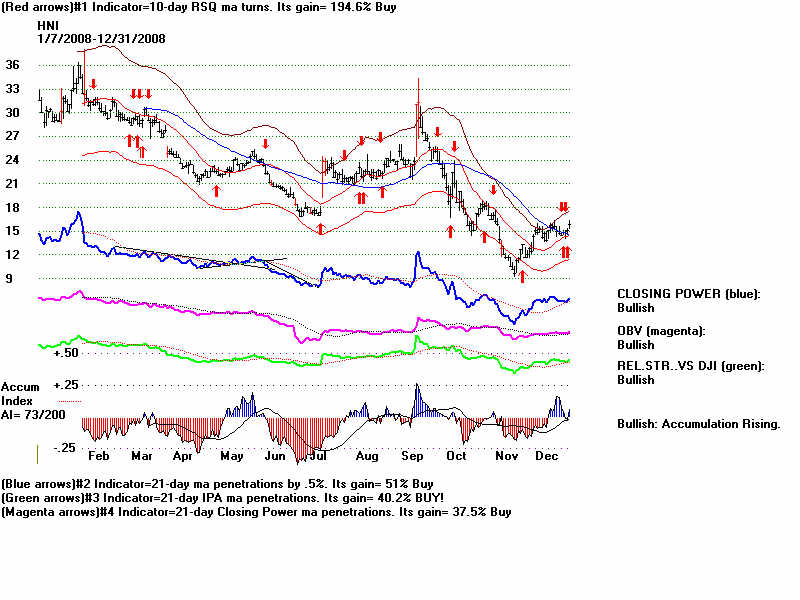
4/4/2008 ZION 47.00 AI/200=64 Not trecommended at new low. So might have been covered
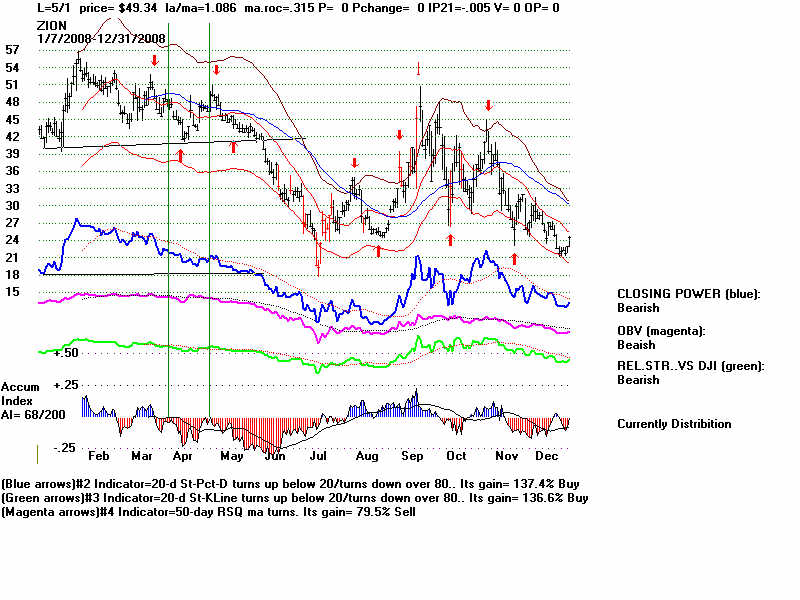
when recent low was tested. CP?COM 9 on 5/1 at 49.34
Did not decline sharply until CL made new low or price breakdown,
4/11/2008 DELL 18.5 AI/200=73 False breakdown at 18, Rallied to 26. When short-covering rally
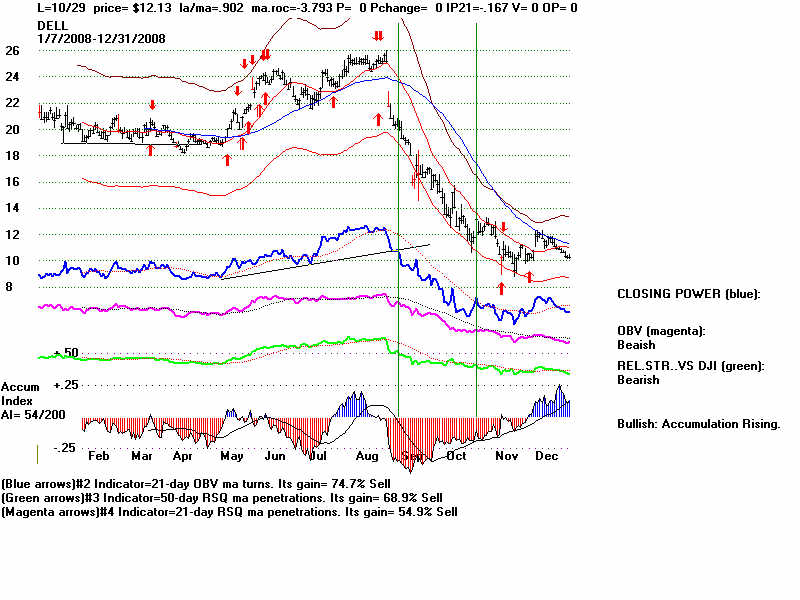
was over and CP broke its uptrend, stock fell from 20 to 12.13,
if covered when CP>CP MA.
4/17/2008 CYN 45.67 AI/200=31 False breakdown. Small loss. Using trends of CP were helpful.
4/22/2008 LDSH 32.2 AI/200=72 Best to cover on high volume Reversal day or wh CP goes over its CP MA.
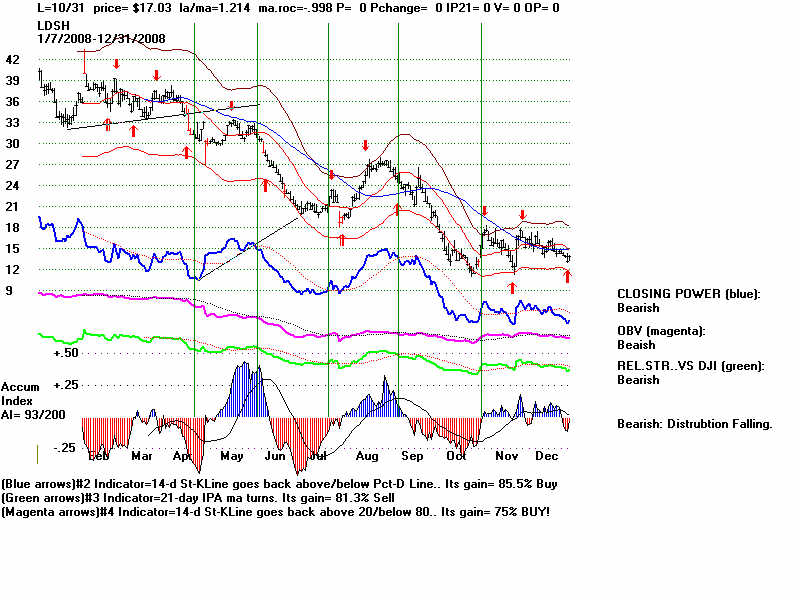
Then go short again when CP uptrend violated or CP< CPMA. This
would have meant covering short sale below 23. After each rally, shorting
it when CP fell below CPMA would have made money.
4/23/2008 ACAD 7.78 AI/200=88 This did not collapse until support failure at 8. Then high volume
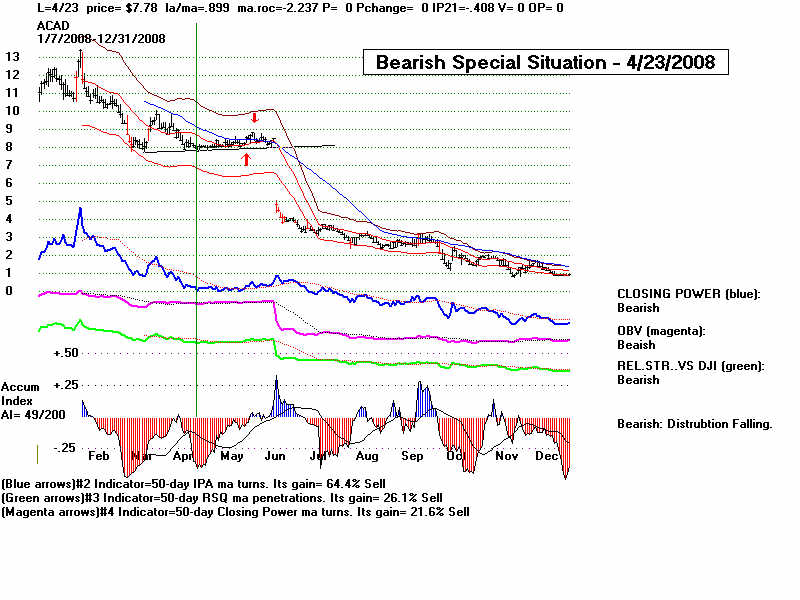
breakdown with gap would have been best time to sell short..
4/23/2008 :LEE 7.00 AI/200=22 Classic high volune, heavy distribution breakdown. This fell to 3.5
and only then rallied with CP/CPMA.
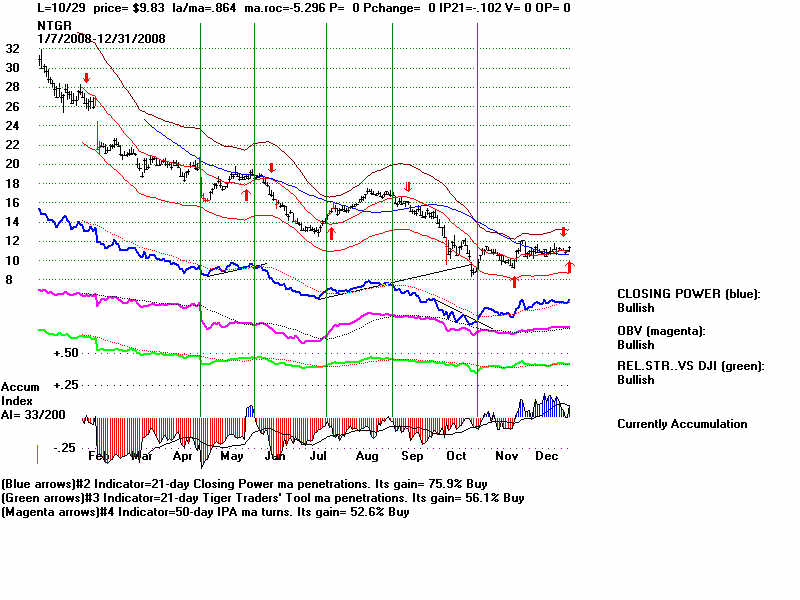
4/25/2008 NTGR 16.76 AI/200=45 Best traded using trends of CLosing Power and CP related to its MA.
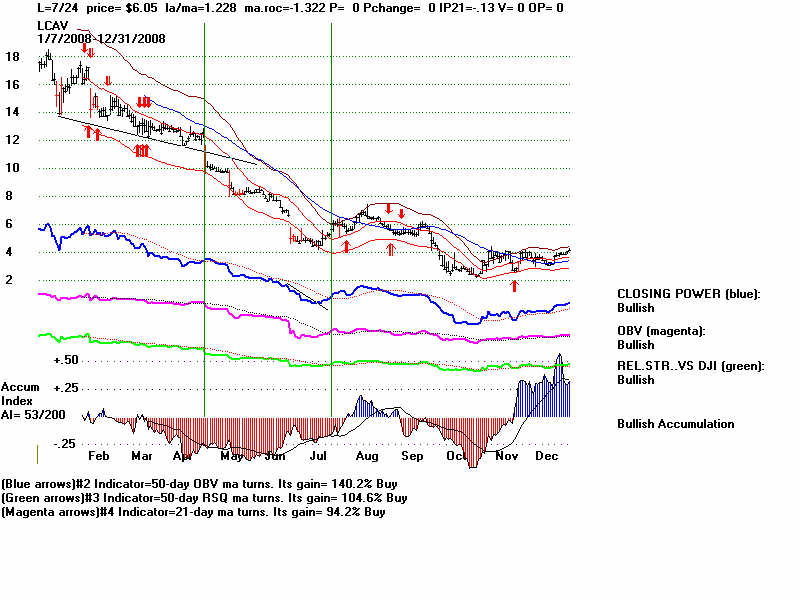
4/29/2008 LCAV 10.13 AI.200=46 Covering when steep downtrend of CP ended, would have meant covering at 5 in July.
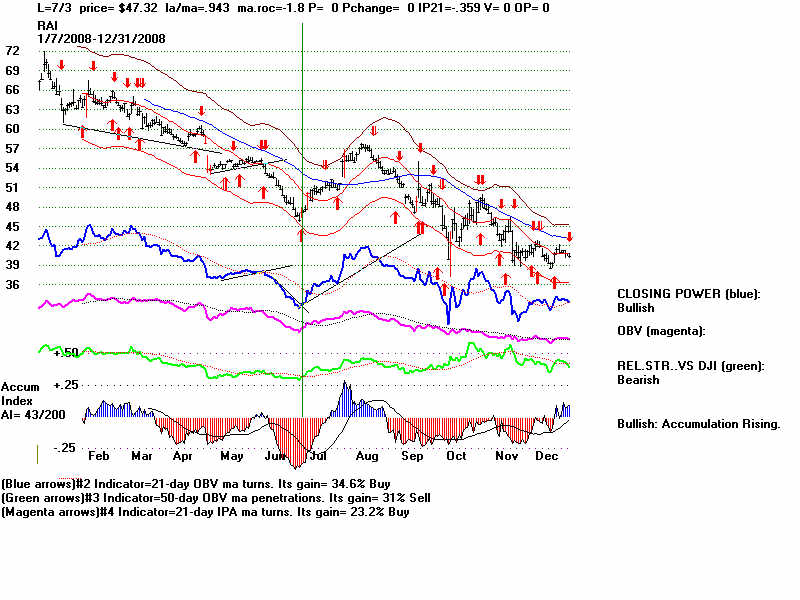
4/30/2008 RAI 54 AI/200=57 Covering when steep downtrend of CP would have meant covering at 47.32 on 7/3
4/30/2008 CORS 7.5 AI/200=95 Classic high volune, heavy distribution breakdown. This fell to 2.25. Covering on
a double bottom was best, but using CP trend-break or CP>CPMA worked well.
4/30/2008 CLX 54.00 AI/200=93 False breakdown. Not a good shortsale. No heavy red distribution.
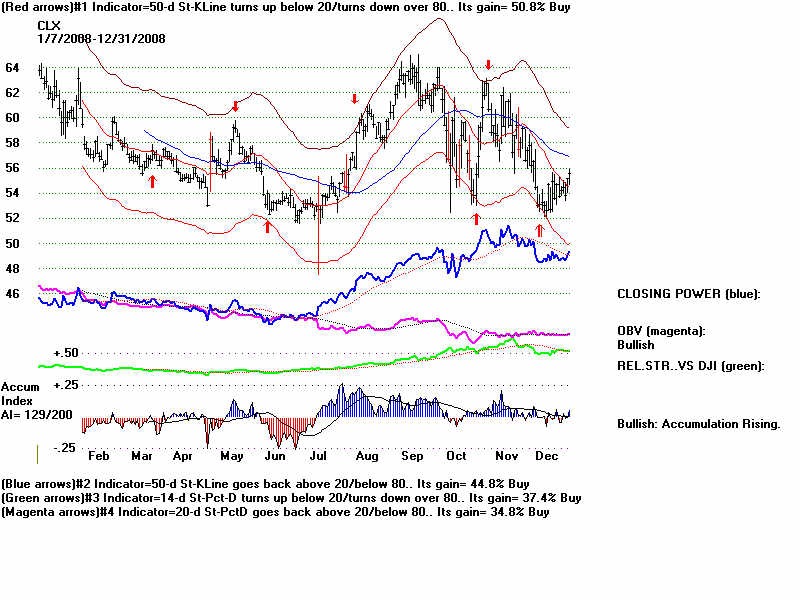
5/2/2008 ASFU 9.71 AI/200=36 no data...
5/5/2008 CRBC 7.0 AI/200=89 Classic high volune, heavy distribution breakdown. This fell to 3.12
and only then rallied with CP>CPMA.
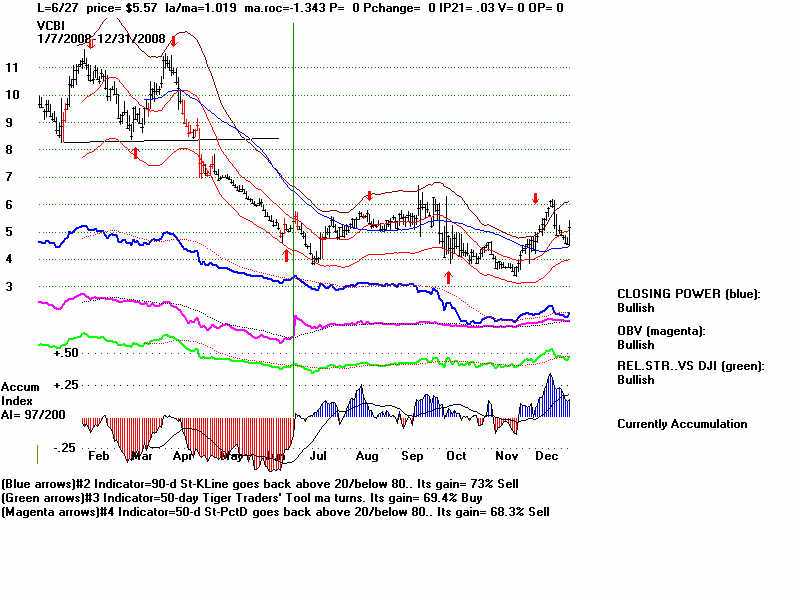
5/7/2008 VCBI 6.89 AI/200=48 Classic high volune, heavy distribution breakdown. This fell to 4,
Using CP>CPMA would have meant covering it at 5.57 in June. .
5/9/2008 KMB 62.35 AI./200=60 This looked like a fine short sale but only fell to 51. Best to have covered using
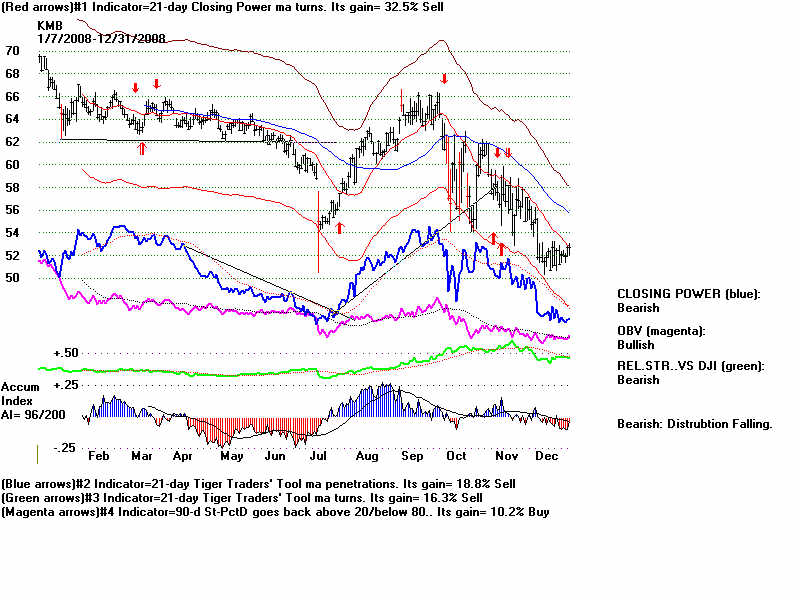
CP>CP MA or CP surpassing its downtrendline.
5/16/2008 EWBC 13.18 AI/200=40
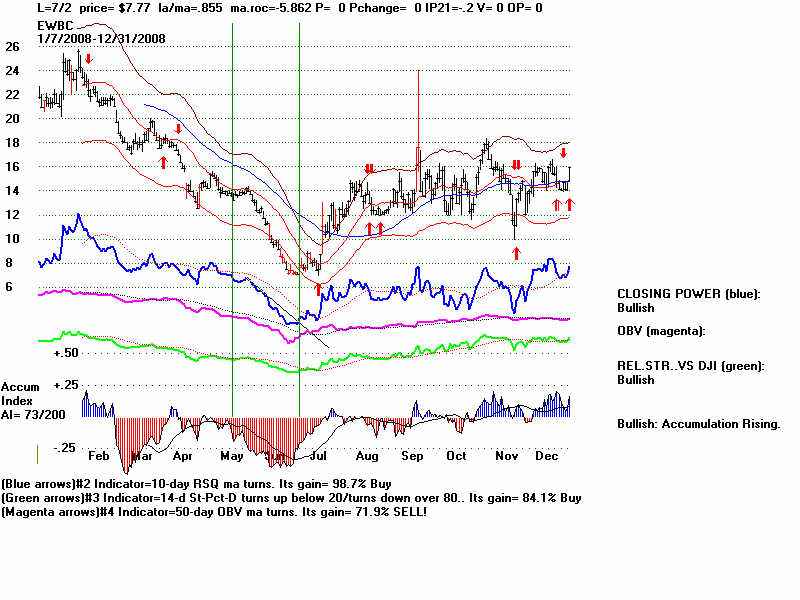
5/23/2008 HZO 10.75 AI/200=71 Classic...Use CP trend-breaks.
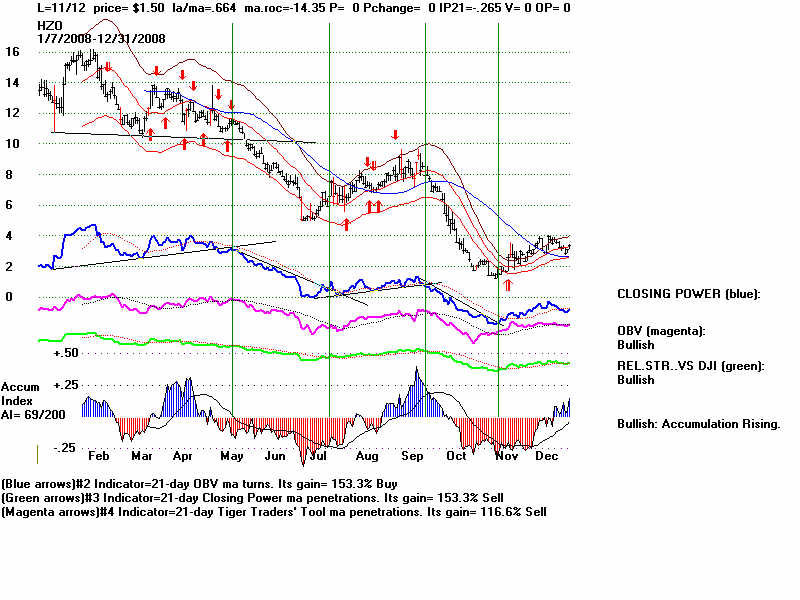
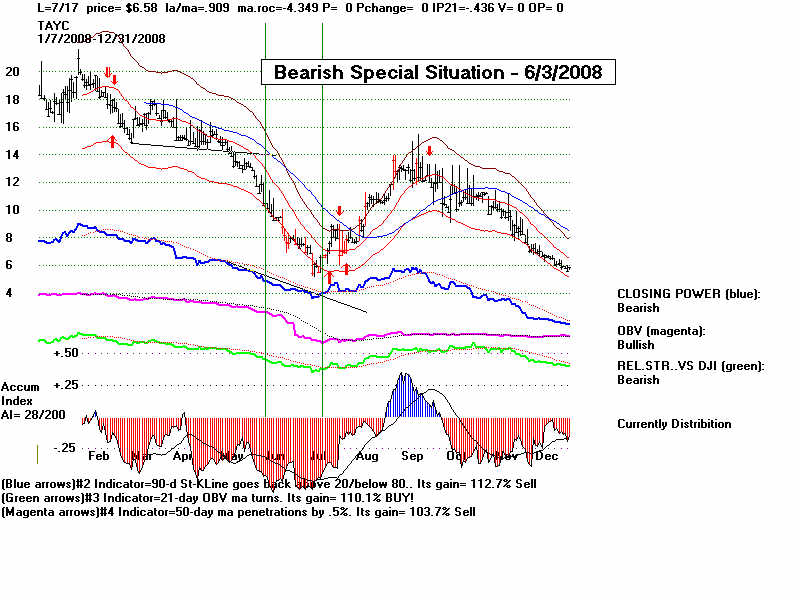
6/3/2008 TAYC 11.71 AI/200=59 Classic...Use CP trend-breaks.
6/6/2008 :LEE 6.70 AI/200=22 Classic high volune, heavy distribution breakdown. This fell to 3.5
and only then rallied with CP/CPMA.
6/13/2008 ABR 13.00 AI/200=35 Classic high volune, heavy distribution breakdown. US CP-trend-breaks.
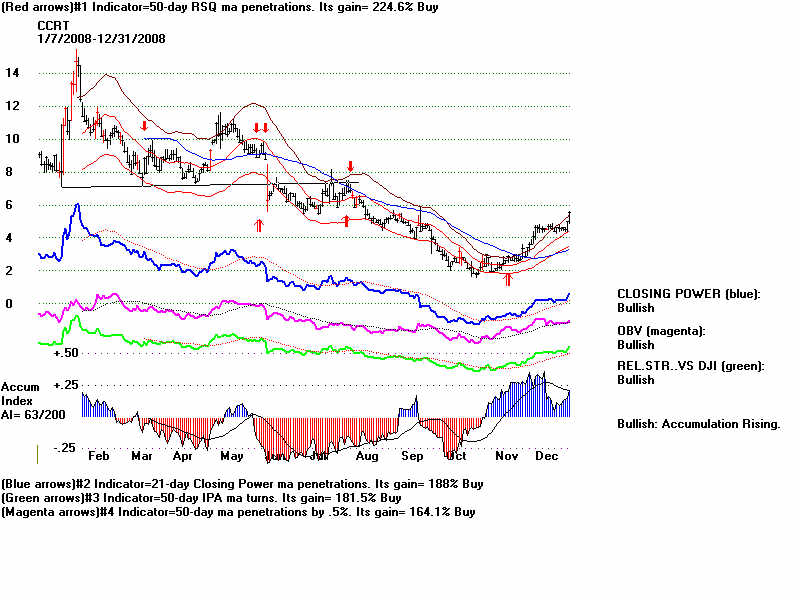
6/10/2008 CCRT 6.30 AI/200=80 Only stubbornly declined.
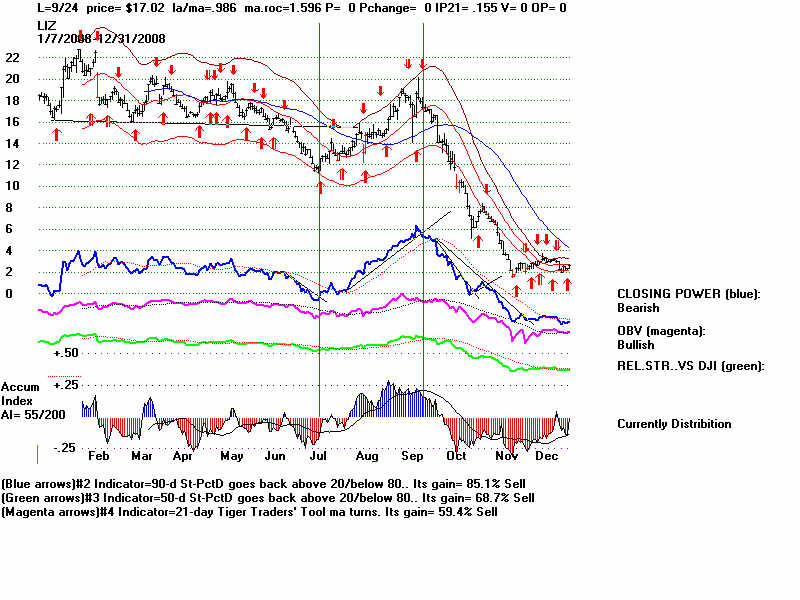
6/11/2008 LIZ 15.50 AI/200=50 Using CP-trend-breaks its false moves were easily mastered.
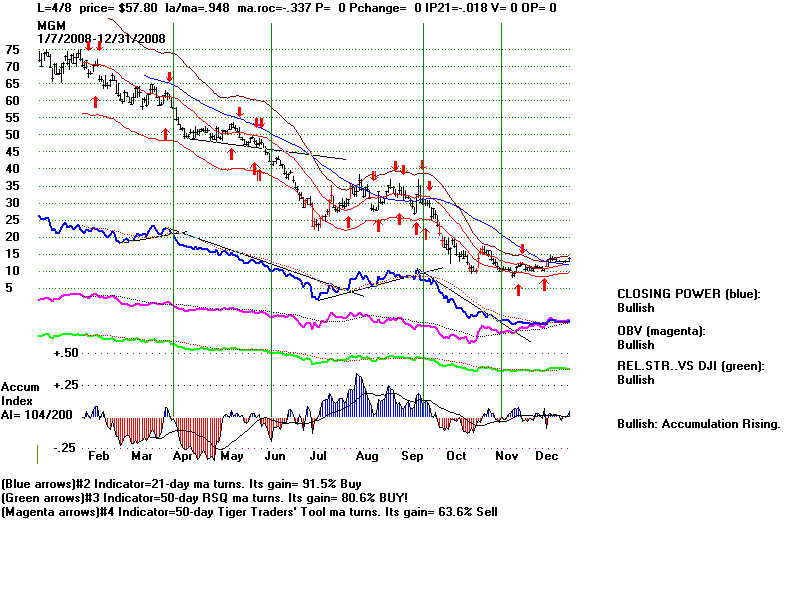
6/12/2008 MGM 41.41 AI/200=67 Using CP-trend-breaks its false moves were easily mastered.
6/19/2008 XMSR 8.61 AI/200=73 went bankrupt I think...
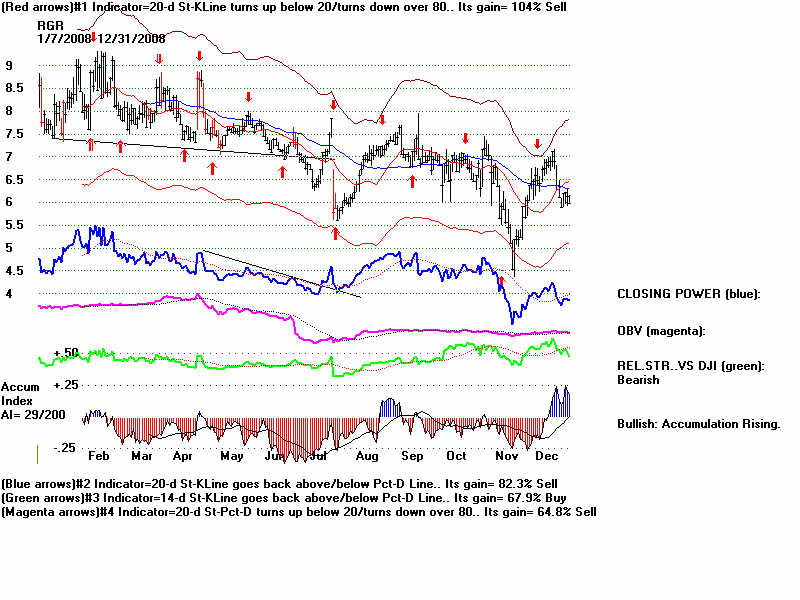
6/20/2008 RGR 7.5 AI/200=39 classic flat bottomed FALSE breakdown abd short-covering rally .
6/20/2008 ABCR 10.5 AI/200=52 no data now.
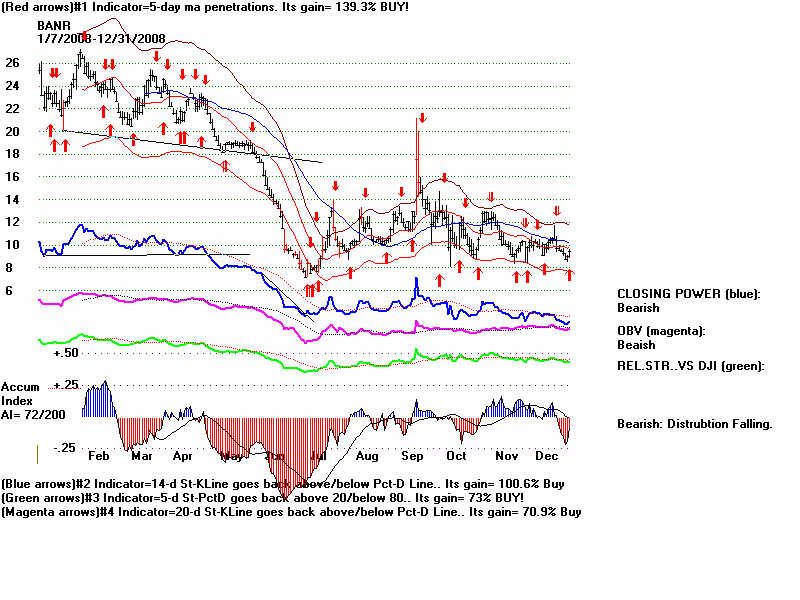
6/20/2008 BANR 10.0 AI/200=54
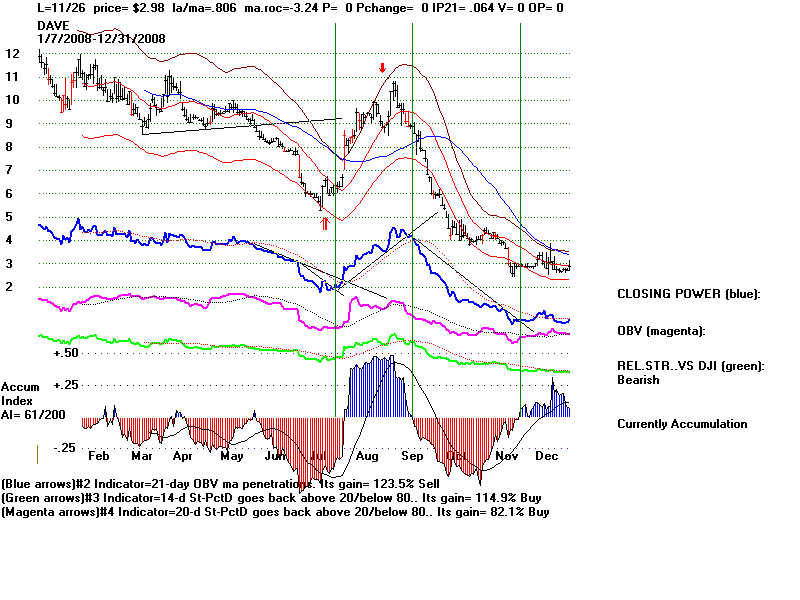
6/26/200 DAVE 7.75 AI/200=29
6/27/2008 HNI 18.27 AI200=67
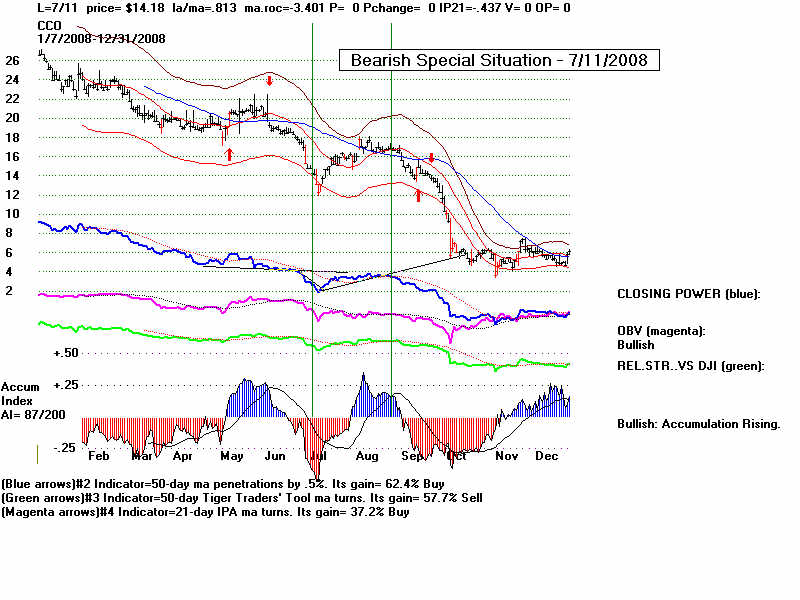
7/11/2008 CCO 14.18 AI/200=70
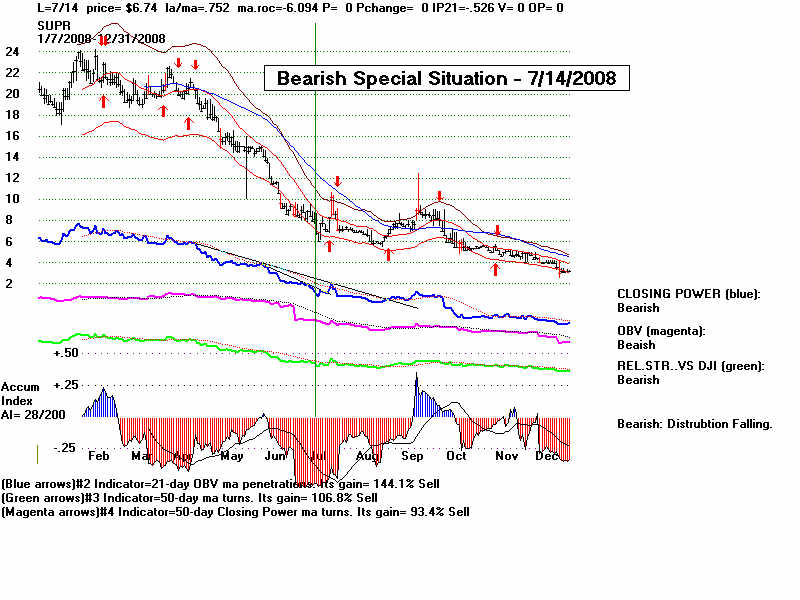
7/14/2008 SUPR 6.74 AI/200=44
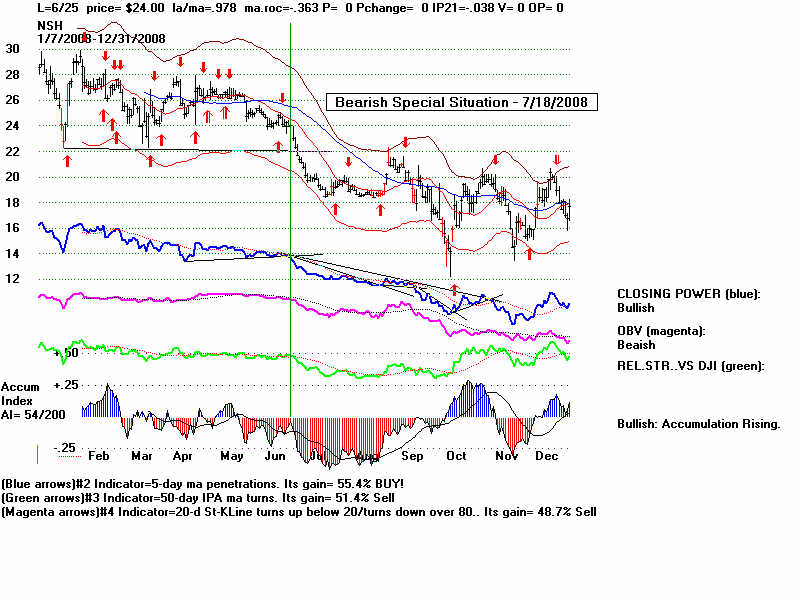
7/18/2008 NSH 18.47 AI/200=161 Closing Power new was better. Use CP trendlines.
8/1/2008 SPAR 5.11 AI/200=35 1-2 day move over CP MA and then CP new low is bearish.
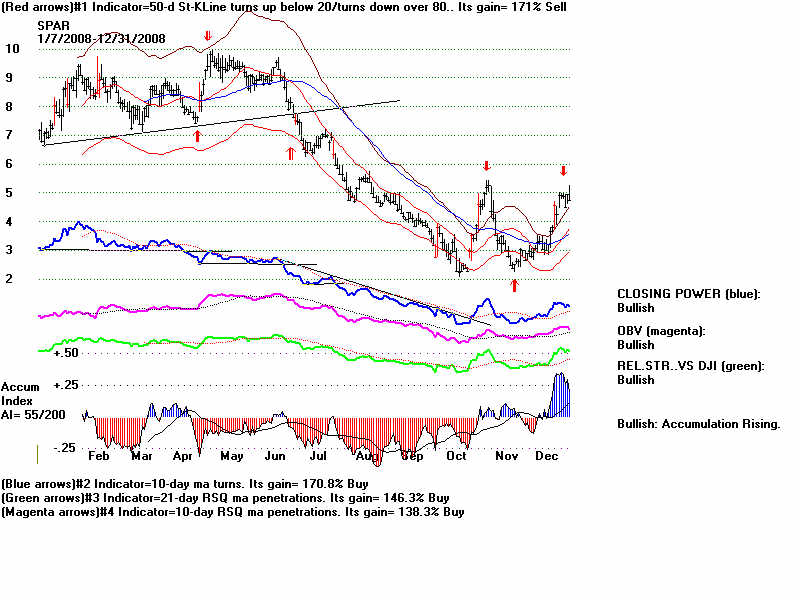
8/7/2008 OFIX 20.61 AI/200=68 Using CP-trend-breaks helpful here.
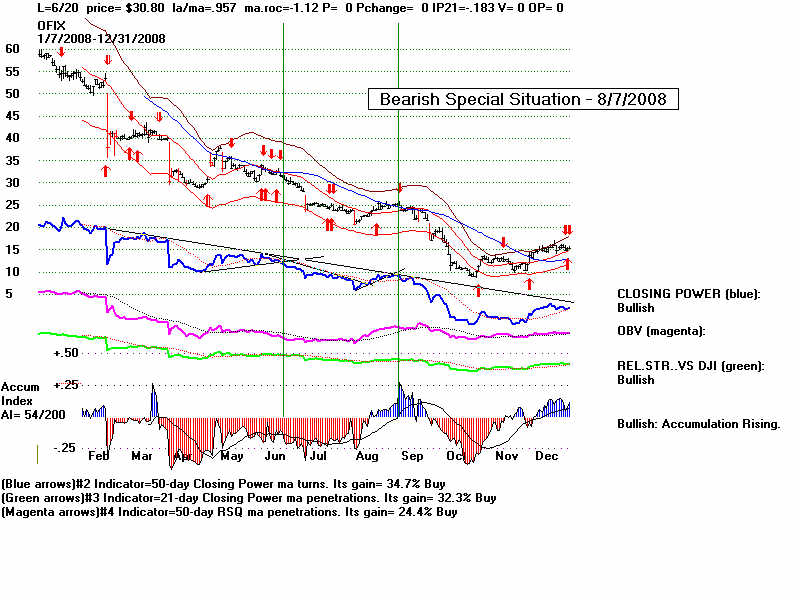
8/8//2008 HMY 8.33 AI/200=111 Gold stock...
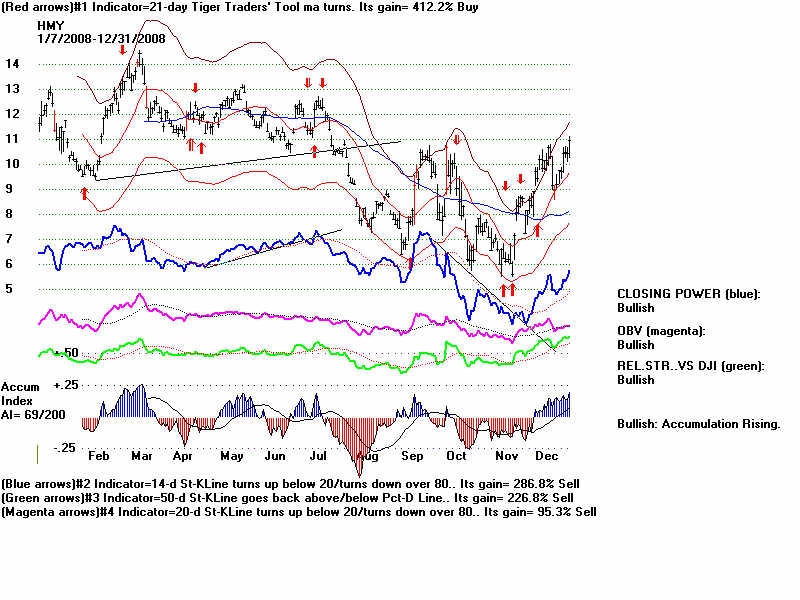
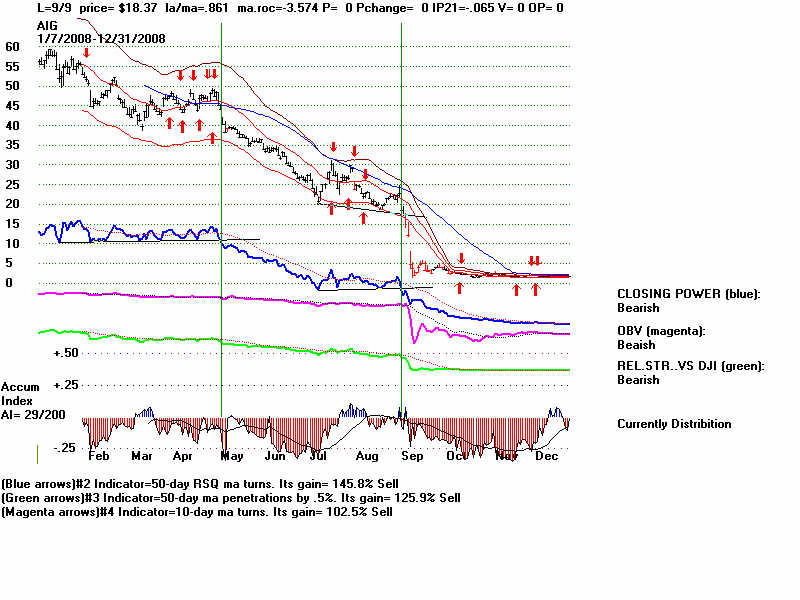
8/28/2008 AIG 19.87 AI/200=39 Classic short sale.
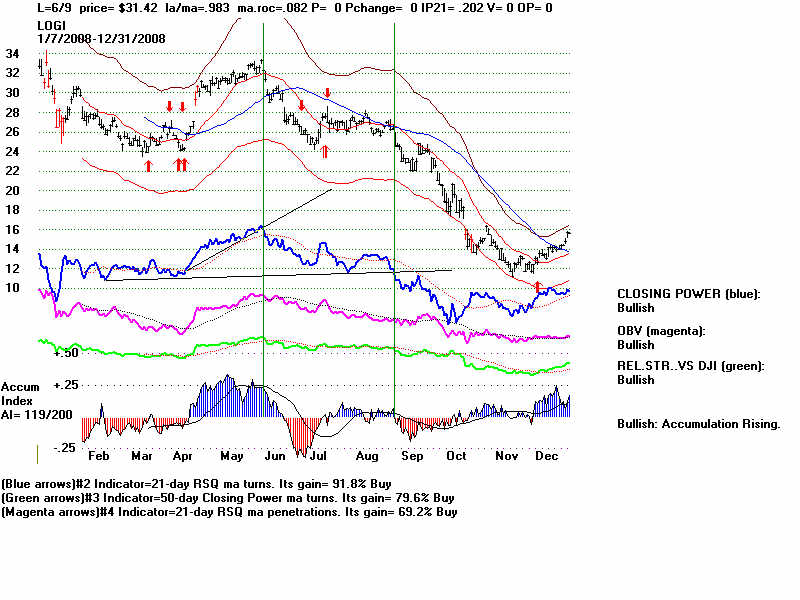
8/29/2008 LOGI 26.69 AI/200=110 red Sell. Classic short sale.
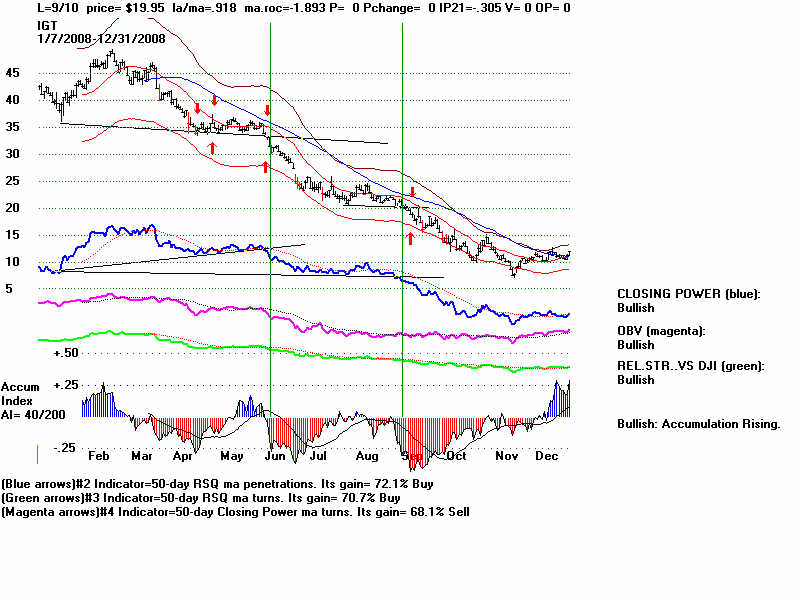
9/4/2008 IGT 20.5 Classic Classic short sale.
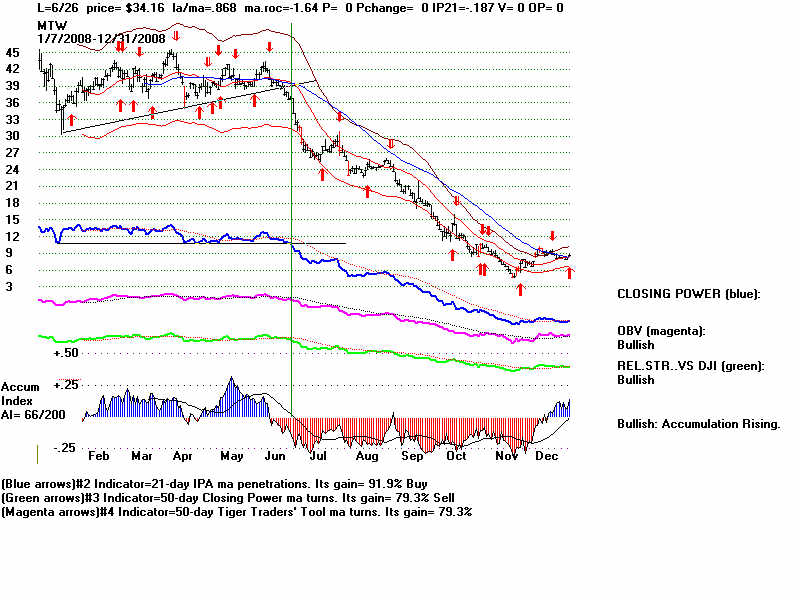
9/5/2008 MTW 21.54 AI/200=102 Classic short sale.
9/12/2008 STXS 13.58 AI.200-88 classic breakdown See chart above.
9/12/2008 ADF 6.26 AI/200=123
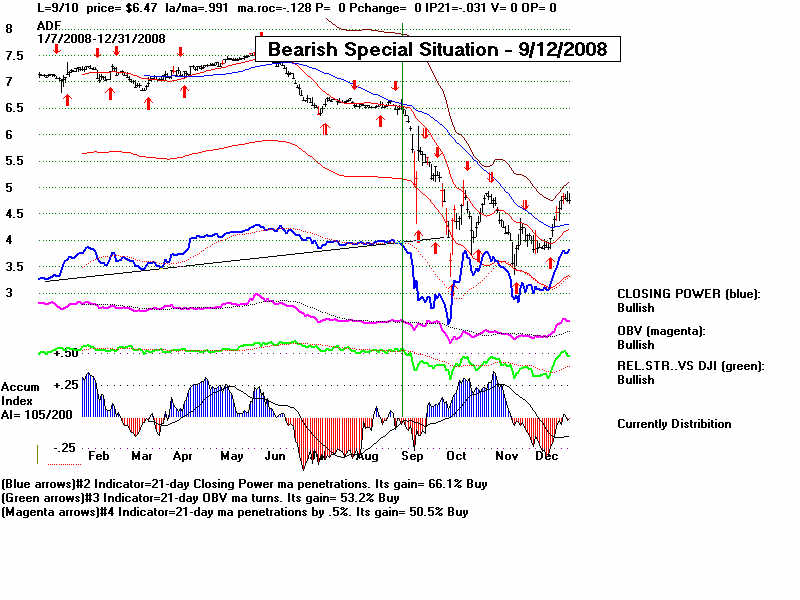
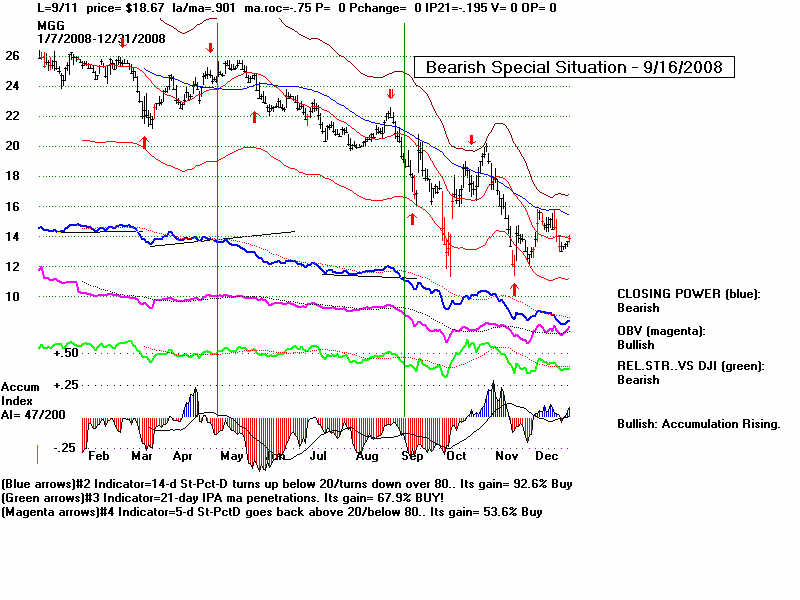
9/16/2008 MGG 17.90 AI/200=27
9/23/2008 PPC 10.26 AI/200=87
9/24/2007 ORBK 9.09 AI/200=69 Classic short sale.
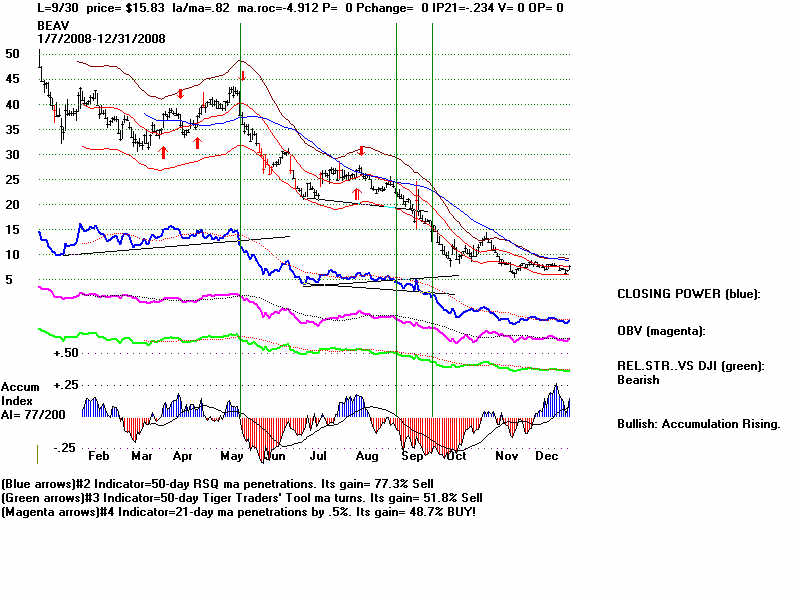
9/26/2008 BEAV 16.89 AI/200=101
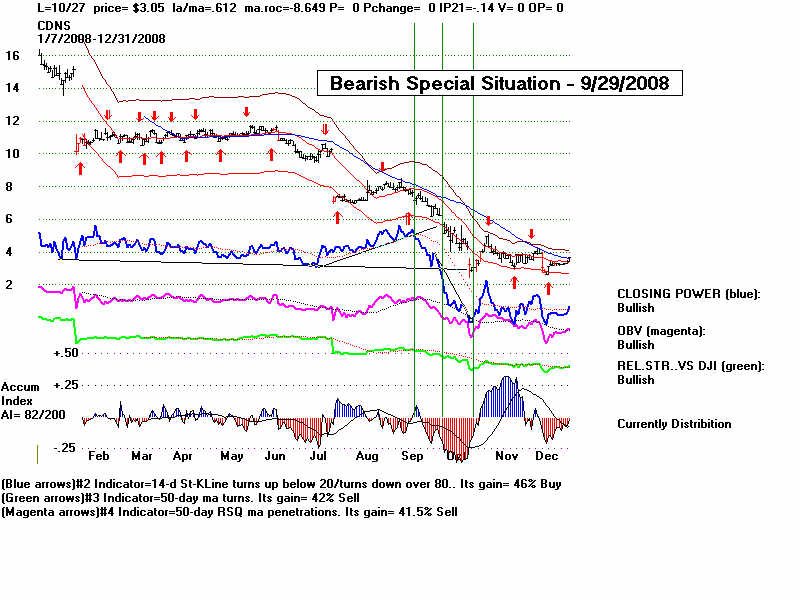
9/29/2008 CDNS 6.20 AI/200=76
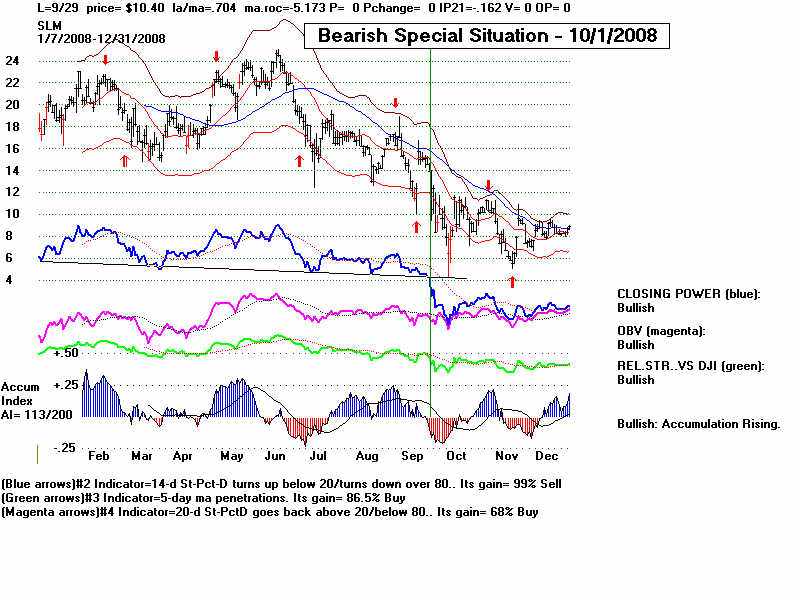
10/1/2008 SLM 8.35 AI/200=115
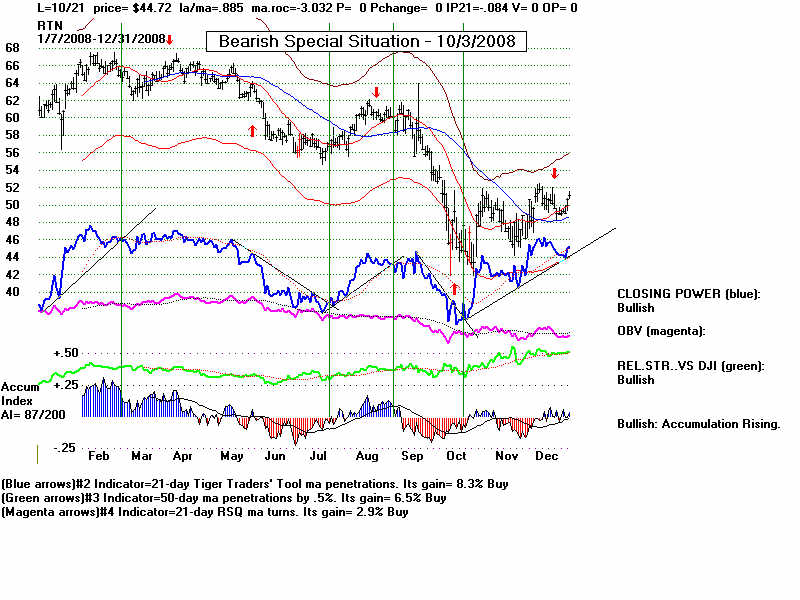
10/3/2008 RTN 53 AI/200=?
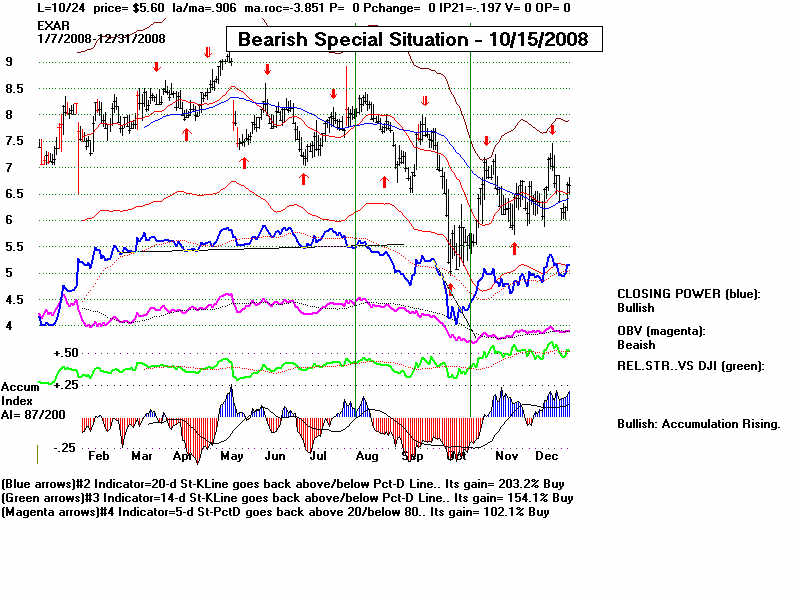
10/15/2008 EXAR 5.88 AI/200=54
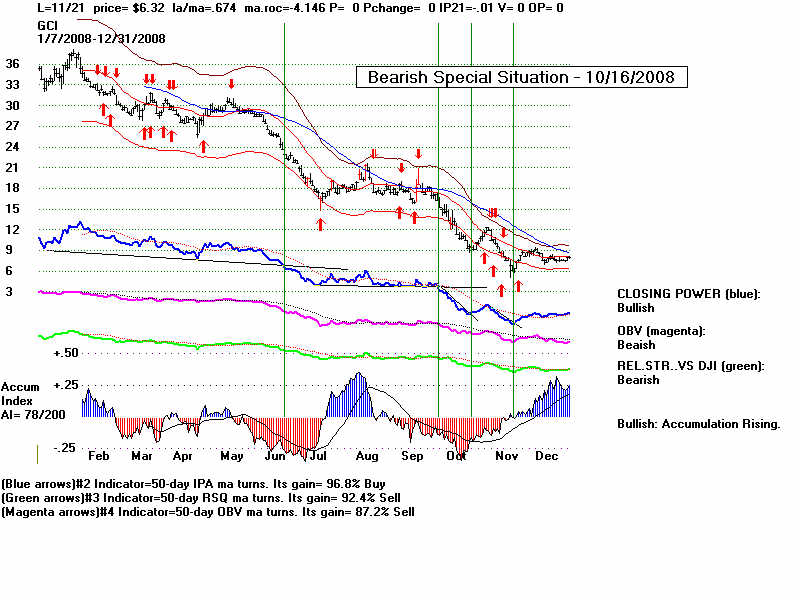
10/16/2008 GCI 10.67 AI/200=87
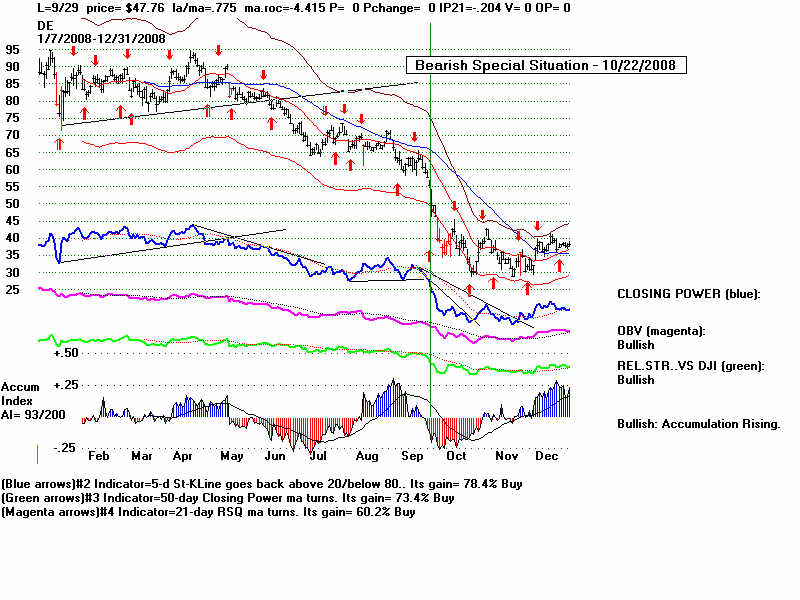
10/22/2008 DE 39.83 AI/200=84
10/24/2008 PAY 9.39 AI/200=102
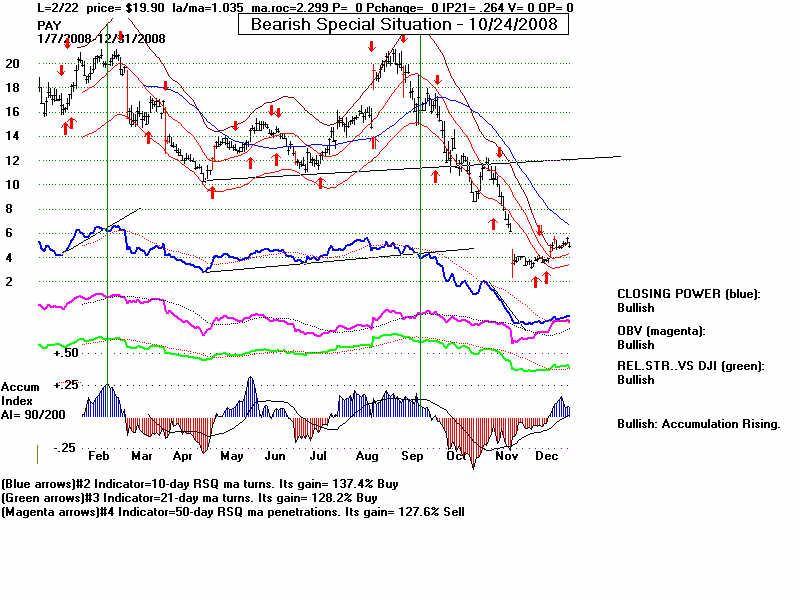