The Crash of 2008 - The Over-Leveraged Monopoly Investment Banks' Panic
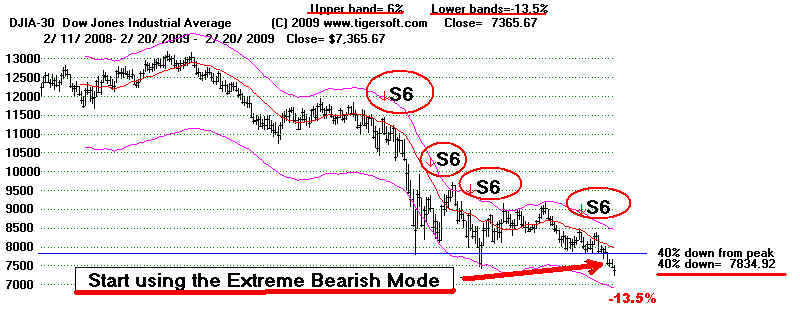
The Crash of 2008-2009 took on the appearance of DJIA declines in the 1930s more than
anything seen from 1942 to mid 2008. Three tell-tale parallels are seen:
1) The DJIA falls more than 40% from its high of the last 10 months.
2) Sell S6 reversals appear. In them the DJI rises more than 2.5% on the
first day and then falls mnore than 2.5% the next day.
3) The optimized lower band around a 210day ma is more than -11.5%.
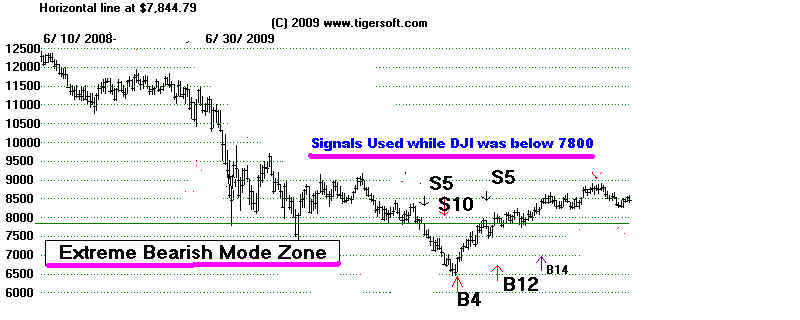
In this extreme bearish environment, we switch to a special Mode to produce the
appropriate signals. When the DJI fell below 7800 in January, we switched on our
Hotline to the Extreme Bearish mode and did not reverse back to the normal mode
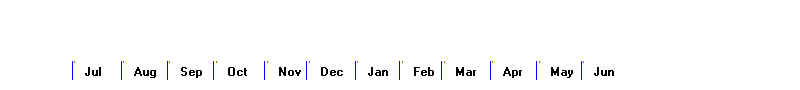
until the DJIA was back above 7800. By choosing to "Superimpose" the appropriate
signals, our chart correctly dislays the normal signals up until 7834 was penetrated
and again when it was penetrated to the upside. For the period of time between February
and March 2009 when the DJI was below 7800 the chart displays the signals gotten
in the Extreme Bearish Mode.

Below are shown the signals in this period produced by the Extreme Bearish mode.
Extreme Bearish Mode