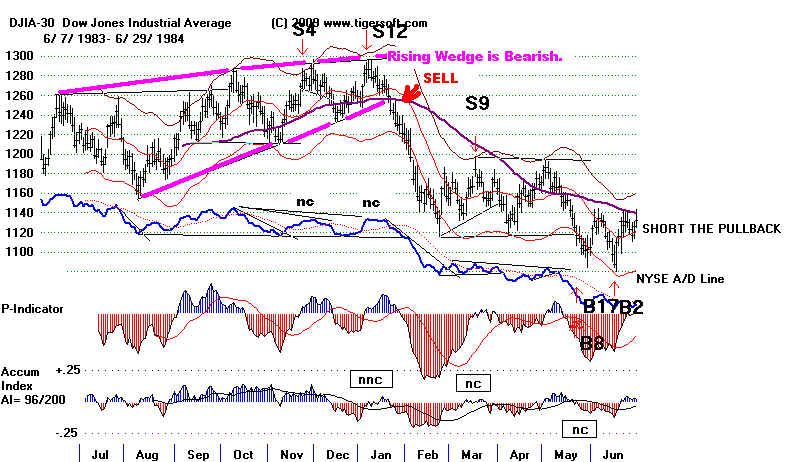
rising wedge patern had set up. The old Peerless programs had produced a
Sell S9 in October, but the new Peerless takes it out, because its conditions
are too liberal). Such major Sells and a bearish wedge often setup up a bigger
decline than to just the lower band.
In these curcumstances, when prices reach the lower 2.5% - 3.5% band, we must
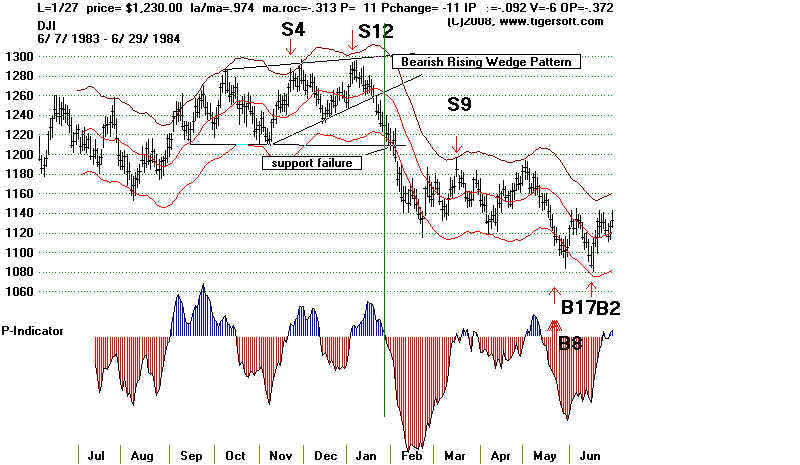
watch developments closely. Sell S9 and S12 signals are very bearish if a key support
level breaks soon after them. Note how the Peerless software lets you put a
vertical line on a chart to show the key values for the specified date. As the DJI
fell to the lower band on January 27th, we see the following key values:
ma.roc = -,313 The annualized rate of change of the 21-day ma was falling
at a 31.3% clip. This is too steep a decline to fight without a Buy Signal.
P= +11 but Cchange = -11 Though the indicator was positive on the test
of th elower band, another day's decline like the last day's would bring it to
0.
IP21 = -.092 The current Accumulation Index was very negative. Accumulators
were not present. The lower band would likely not hold.
OP21 = -.372 (This was a very negative number. Aggressive selling was
very much in evidence.)