10/5/2010
(C) 2010 William Schmidt, Ph.D.

(C) 2009 www.tigersoft.com 858-273-5900 william,_schmidt@hotmail.com PO Box 9491, San Diego, CA 92169
SEE ALSO TIGER INSTRUCTIONS ===> http://www.tigersoft.com/ins2009/
Supplemental Instructions, Our Recommendations: Use Peerless and Our Nightly Hotline.
http://www.tigersoft.com/Starting-Off-With-Tiger/index.html
Very important: On-Line Instructions for TigerSoft's Automatic Buys and Sell.
http://www.tigersoft.com/iskra0123/instructions.htm
Signals: Peerless, TigerSoft Optimized and TigerSoft Fixed Rule
http://www.tigersoft.com/7476/PeerlessvsTiger.htm
Trend Changes, 65-dma and TigerSoft Fixed Rule Buys and Sells.
http://www.tigersoft.com/--2--/Fixed-Rule-Buys-Sells/index.html
Trading Closing Power Trend-Changes
http://www.tigersoft.com/7476/CPPCT-Inst/index.html
Step-by-step Analysis of A Stock: Whether to Buy or Sell It: Examples AAPL 2008 2009
| INSTALLATION AND REGISTRATION FROM TIGERSOFT CD or from EMAILED Links Explore the your CD drive. #1 Find, open and run SETUP.exe Click OK to each question. You may get an error after the programs are installed, at the point where the computer goes to load data in. Don't be concerned. The current data is obtainable below and elsewhere.)IONl To bring your Peerless programs fully up-to-date, please open the following file. #2 Find, open and run winpeer.exe (This is necessary for registration. It installs the older Peerless/TigerSoft version. It is mainly used to see the older Peerless pre-2007 system's signals and to run a few analyses not in the newer Peerless ) . #3 Find, open and run extra.exe #4 Find, open and run PEERLESS.exe ---This has a Mode for showing Signals in the "Extreme Bear Market Mode".. It allows you to see the display to better fill your screen. Newer signals and indicators... #5 Find, open and run Install-Builder.exe #6 OVERRIDE.exe Click and open - This will install stock names to match symbols. #7 PEER04.exe - Peerless Index Data 10/5/2010 #8 STOCKS.exe - Stocks, ETFs, Commodites, Metals, Currencies saved to c:\stocks 10/5/2010 Current DATA Acquisition Go to www.tigersoft.com/55555 Open and run the data-import files you want. Most Popular Data Downloads: PEER04 - This loads in the Peerless Index data.. The others import groups of stock data. STOCKS NASD-100 DJI-30 ACCUMLA ACCUM SECTORS FIDSTKS SP-500.exe ETFS HOTSTKS7 HOTSTKS6 NEWLOWS ELITSTKS AWEEKDAT.exe BWEEKDAT.exe |
| Typical
chart. We want you to be able to see the value of using the key Tiger Closing Power Lines and produce the trading results for them. NEM is a typical example. The rules to use are the same with the newer Tiger-Pro-Power, as applied to SPY since 1999 at this link: http://www.tigersoftware.com/TGR-PRO-POWER-SPY/index.html 1) Watch for well-tested trend-breaks in Closing Power to buy or sell. 2) These trend breaks work especially well after new price highs or lows have not ben confirmed by the Closing Power. 3) Closing Power trend-breaks also work well where a reversal is expected, as at a 65-dma or on the right shoulder peak in a bearish head and shoulders pattern. 4) Closing Power forms its own recognizable patterns, which should be used. 5) Use Closing Power to confirm automatic Buys and Sells. In new software, note how much of the move owes to Professional buying versus Public Buying. Where Public Buying is more important, know that stocks can rise further than would otherwise be expected using Closing Power. Still. the best moves up occur after Professionals become bullish. This is spotted on the right side of the screen and also by watching for a Closing Power trend-break. Consider the automatic messages to the right of the screen. They advise you what the program thinks about the stock and the key internal strength indicators. 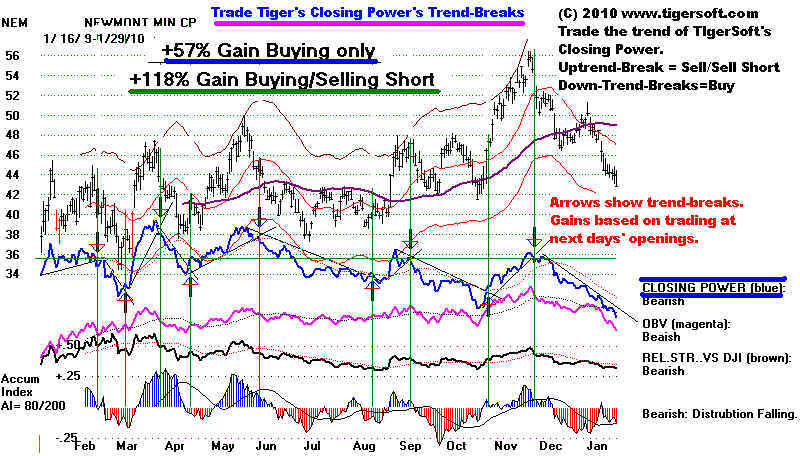
|
Starting Off With TigerSoft
1.) Installation - Follow all the
instructions on the link provided you by TigerSoft.
2) Place the icon for Peercomm on your desk top.
Click Start + All Programs + find Tiger Investment Software
+ with the left
mouse key down drag the Peercomm over to your desk top.
3) Start the TigerSoft programs.
Double-click the left mouse-key pointing to the Peercomm icon.
4.) Set the size of the graph on your monitor for the Peerless-2008(9) charts.
Use
Peercomm + Peerless-2008/9/10 + Run Set Ups + Initial Graph Choices(2) + 550 + 750 + Y + N
+Y
Then use Peercomm +
Peerless-2008 + Run Set Ups + Initial Graph Choices(1) + Y
Thereafter use Peercomm +
Peerless-2008/9/10 (upper button on right).
5) Important - Use this Peerless
program from Peercomm for all charts, signals and
internal strength indicators on the DJI and for stocks.
Use the TigerSoft program mostly
for ranking and flagging operations. If you use it for graphing,
you will probably need to change
the monitor's setting for 600x800.
6) To view the charts selected by hitting TigerSoft from Peercomm,
you will need to more basically
modify the screen resolution settings for your entire computer to
800x600:
MyComputer + Screen Resolution + 800x600
7) Download some stock data from us.
The data now is available at www.tigersoft.com/1119A (This is subject to
change)
Go there with your web-browser or using Peercomm + Internet.
Opening and
executing these data files will place the current data into your computer
in the designated directories.
For purposes of illustration open and execute these data sets.
#1 PEERO4.exe index data
#2 STOCKS.exe
a variety of stocks and indexes.
#3 NASD-100 STKS.-
#4 MAXCP.exe
- Use Bullish screen if you have Power Ranker.
8) Close the Tiger Data page and start Peercomm.
. Peercomm + Select + pick "stocks" or "nasd-100" (or any group, except
"funds"
whose data you have gathered) + OK
USE PEERCOMM + ANALYZE
IF YOU HAVE TIGER
POWER-RANKER
STEPS 9 - 12
9) Back at the
Peercomm screen click
TigerSoft Charts + Run/Setups at the upper left +
Run Nightly Analysis + OK
You can see how quickly the stock data is
analyzed. To speed it up, close other programs
that might be running. The speed
here is also a function of how fast your computer
can read or write files. When done
click OK.
10) Look at the stocks that the computer thinks are most bullish. Here are some
suggestions.
Peercomm + Peerless 2008 + Daily Stocks
+ #12 Bullish or any of the categories in the
middle of the page + OK
For example #8 Recdvol -
highest volume for last 250 days. (Careful. Stocks could be falling.)
---> It is best to
start with #12 Bullish
On 6/1/2009 here is the most bullish stock that pops up.
#14 Toprel - Best performing stocks over last 250 days.
: #15 New highs - stocks making 12 month highs
#21 Both Up - Both Opening and Closing Power are rising.
#23 CloserNH - Closing Power
makes a 65 day high.
#41 IP21ov25 - IP21>.25 (IP21 is the current value of the Tiger
Accumulation Index.)
B10 - new Buy B10 signals.
B12 - new Buy B12 signals.
GRAPHING A SERIES OF STOCKS
USE PEERCOMM +
Peerless-2008/2009 + Daily Stocks + Allstks (in second column)
11) Look at the next stock in a flagged list of stocks.
With the Num-Lock key off, hit 2 (down arrow key) on right
sight of keyboard to go to next stock
in
the a list..
With the Num-Lock key off, hit 8 (up arrow key) on right sight of keyboard
to go to previous stock
in
the a list..
(This is only a small part of all the uses of the Power-Ranker. )
12) Look at any chart in the directory
Peercomm + Peerless 2008 + Daily
Stocks + any symbol in the list +
down-arrow(2) to next stock
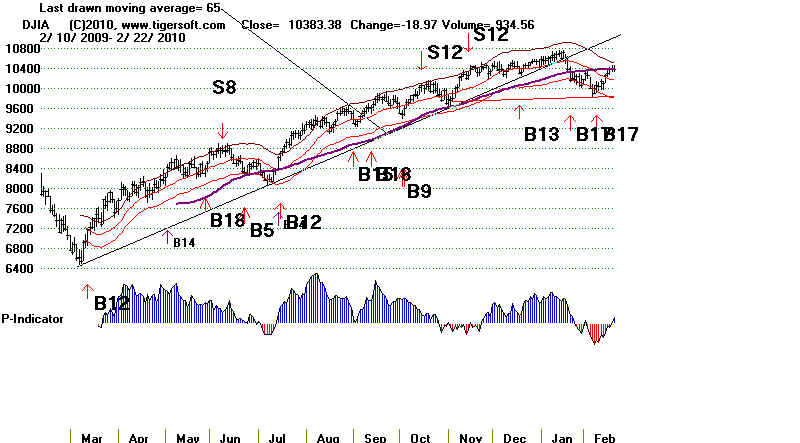
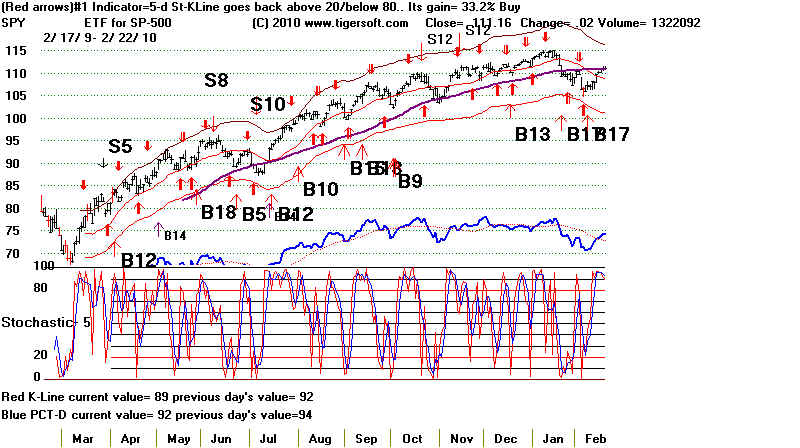
13.) Basic Graph Display - Experiment with all the items in each of
the columns. Read the Help section,
You can always Restore the Original Chart under Operations.
You can simplify the chart
and clear away any indicators or signals using Operations + Restore Simple Bar Chart,
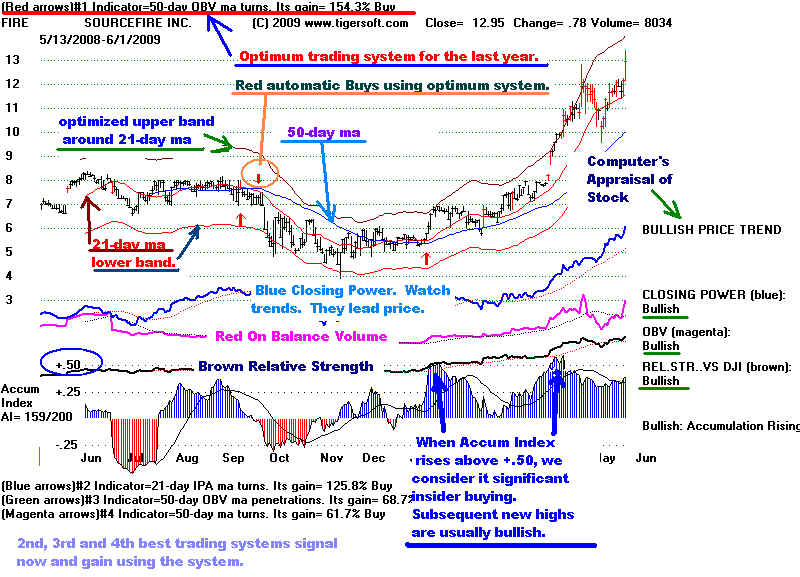
14.) Explanation
of what you see with the basic TigerSoft chart.
Optimized trading system, year's results and current signal at top of chart.
Symbol and company name, Closing price, change and volume.
Automatic Red Buys and Sells
21-day ma (red)
Optimized upper and lower bands to bracket 93% of trading.
Red 21- day ma. A rising 21-day ma is apt to be support. A falling 21-day ma
is apt
to be resistance.
Blue 50-day ma
Red price bars - unusual volume.
Blue Closing Power. Look for trends, trend-changes, Closing Power (CP). moves ahead
of prices to
new highs or new lows, non-confirmations of new highs and new lows.
Closing Power leads prices usually,
Red OBV (aggressive buying or selling line). Compare with prices.
Brown Relative Strength Lines.
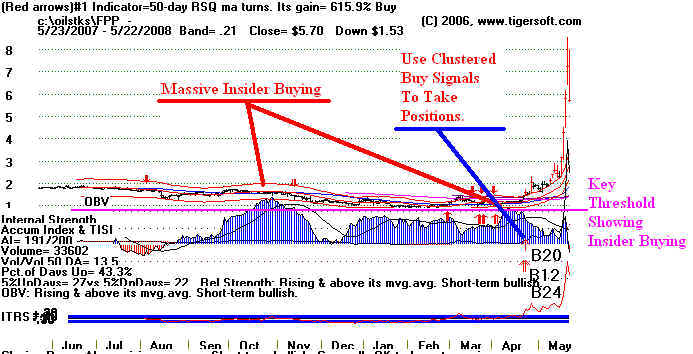
Red and Blue Accumulation Index. Accum.Index moves over +.50 show insider buying.
Look for divergences from price. Negative Red readings with stock at the upper
band are bearish. Blue Positive readings with the stock at the lower band
are bullish. Watch for crossovers by the Accumulation Index above and below
its 21-day ma. We want to see the Accum. Index to be at least +.20 to buy a stock
making a new high.
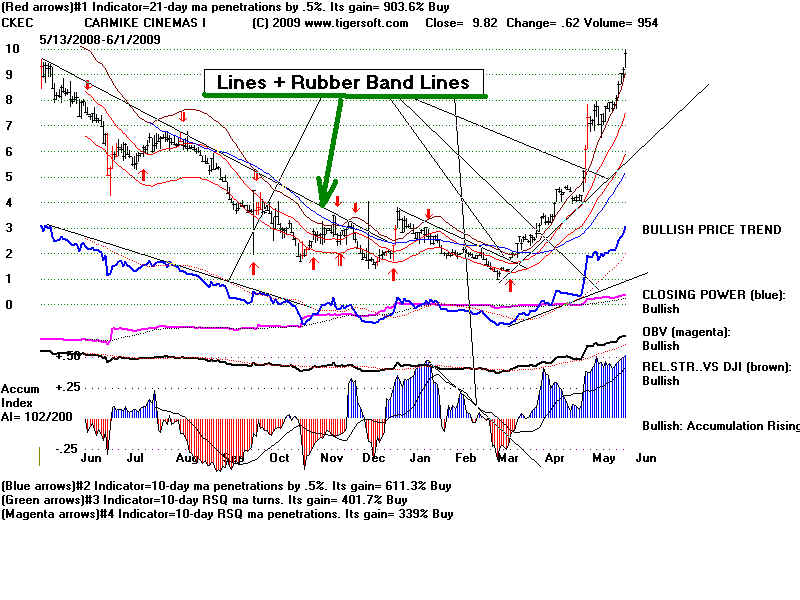
15.) Lines: Rubber Band
Lines and Diagonal Lines are drawn on any TigerSoft chart between
any two points you pick. The diagonal line will show you the price where the
diagonal
line crosses on the last day, Lines that go through 3 or more points are considered
well-tested and more important.
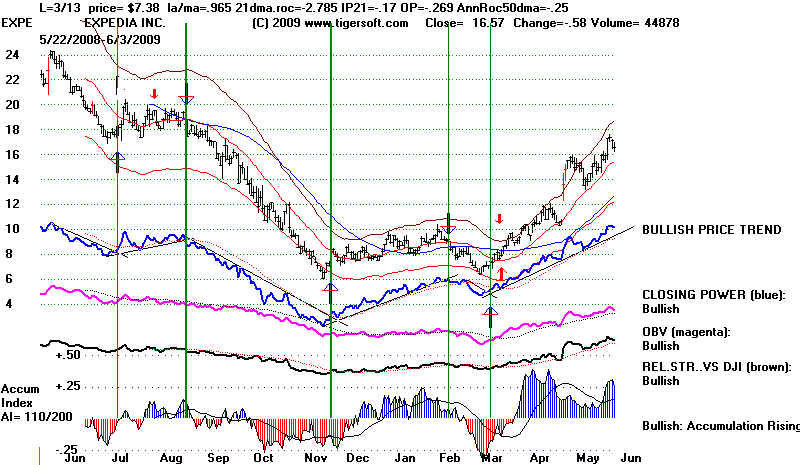
16.
Vertical Lines and Key Values
With a chart on the screen, choose Lines
+ Vertical
This lets you see the key values for any day. You can place buys and sells where
there
are Closing Power trend-breaks or any place you like.
Gains Using Buy and Sell Signals
Based on TigerSoft's Closing Power Trend-Breaks
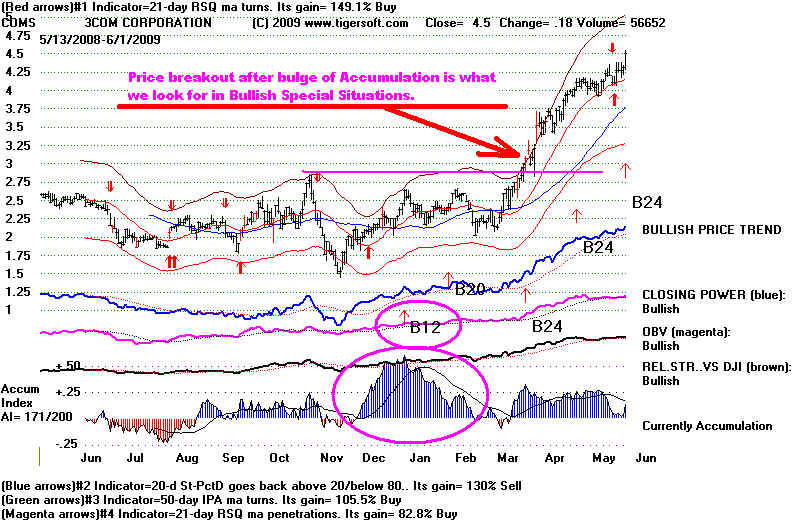
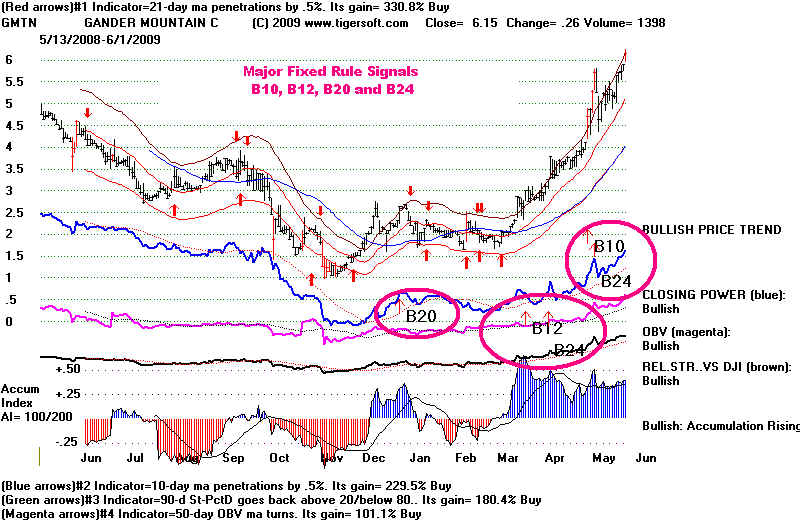
17. TigerSoft Fixed Rule Signals
The most bullish signals for individual stocks are B10s, B12s, B20s and B24s.
These do not appear automatically. They must be requested with a stock chart
already displayed: Signals(1) + (1) Major Buys
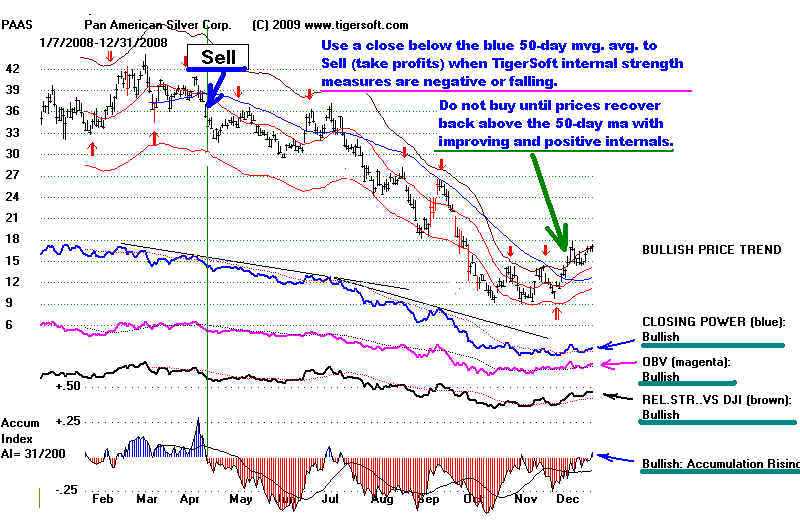
When a high volatility stock drops back below its blue 50-day ma with the
Accumulation Index negative and the Closing Power zig-zagging lower and below
its 21-day ma, we would normally sell, especially if the stock has run up a 25% or
or more from a base. There are many examples of this on our website.
Use the signals under Signals(1) that are appropriate for the trend of the
stock you are watching.
The definition of a signal as well as each of the various indicators can be studied
under Help with a chart on the screen.
Instructions:
Peercomm + Select + nasd-100 + OK
Peercomm + Peerless-2008 + RIMM + Lines + Vertical Lines + Point Mouse Click
for each trend-break.
Operations + What Happens to $10,000
Buying and Selling Short Gain = +335.9% Buying Only = +139.3% Selling Only = 82.2%
Starting with $10,000 and allowing $40 per trade for commissions and slippage.
Initial $10,000 account at end of period would be worth $43,586 from 8/5/2008-6/3/2009
Buys and Sells can be placed Buy / Sell Signals
sets of fixed rules. Use Signals(1) Display User Selected Signal or - 1-19
using Peerless DJI-saved signals Signals(1) - DJI Saved Signals
specific trading systems Signals (2), Signals(3)
single Buy or Sell by location. Lines + Vertical Line (User Set Signal, B28, S28)
With a chart and Buy and Sell signals on the screen, you can see when they occurred
Operations + Trading Results
and what the trading results would have been with $10,000, either trading the day of the signal at
the close or the next day at the opening. Use Operations + What Happens to $10000
20 Indicators
Over the years, we experimented with lots of indicators. The ones we make mose use
of now are TigerSoft's creations:
Closing Power,
Opening Power,
Closing Power Percent,
Accumulation Imdex,
Relative Strength Quotient
IPA
OPct.
250-day-rate of change of 21-day ma = "ANNROC"
See TigerSoft's Unique Tools to Spot Insider Trading
Please do not divulge these indicators to non-Tiger users.
We also use volume and Hoe Granville's On-Balance Volume.
You can see we used fixed interval bands and regression channels a lot.
TigerSoft was the first company to use the simple concept of bands built
a fixed percentage away from a 21-day ma.
Please experiment and see HELP + Indicators' Term Concepts
Here are some more TigerSoft links to explore.
http://www.tigersoft.com/2244/ANSWERS1.htm The TigerSoft Confirmed Trend Is Your Friend
Basic TigerSoft's Rules for Profitably Trading Stocks and Limiting Risks.
Example: 1400% Profit since August
2008. What Could Be Simpler?
Insider Trading: The Mother's Milk of
Wall Street.
Now TigerSoft Let You Legally Trade As
Though You Were An Insider.
Watch The Insiders and The Rest Is Easy.
TigerSoft's
Explosive Super Stocks
Read the The
Tiger Blog
Google a subject, "head and shoulders" for example
and "TIGERSOFT"
There is more than what we
have shown here. If you have questions, please email us
william_schmidt@hotmail.com