Basics of Closing
Power (CP) and Candle Sticks
Applied to SSRI,
PAAS, NEM, NUGT and DUST.
Charts
shown here are regularly on the Tiger Hotline Charts Links.
12/26/2014
---------------------------------------------------------------------------------------------------------------------------------
Regarding
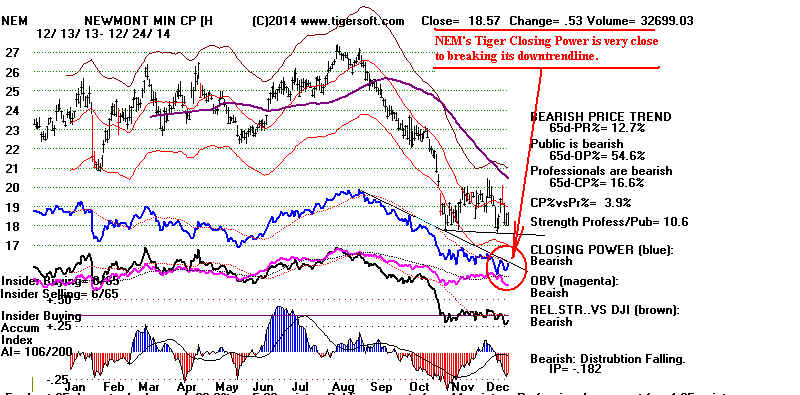
NEM
and NUGT are close to breaking their CP downtrends.
As the Accum Index is red and the 65-dma is falling, a rally
to
only the 65-dma can be predicted as an upside target
if
the CP downtrends are broken.

Tiger
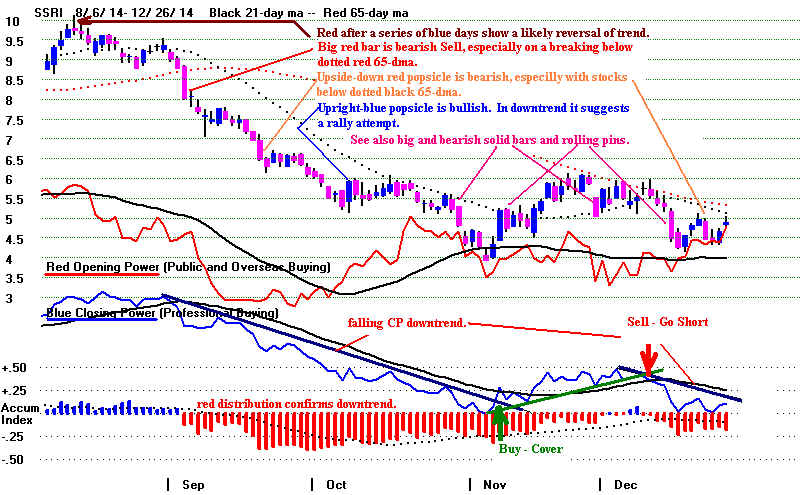
SSRI chart - 12/26
5.4
is most important resistance. It is where (dotted red) 65-dma crosses.
NO
break in CP downtrend.
Accumulation
is still (red) negative.
and
below falling 21-day and 65-dma
Only
(red) Openings and Opening Power are rising and in rising trend.
-------------------------------------------------------------------------------------------------------------------------------
Six Closing Power Rules
It is the
intermediate-trend of the Closing Power that I mostly trust. The only
time this
does not work real well is when the Public and over-seas buyers are
temporarily
dominant. And even then, trading with the Professionals works
satisfactorily.
Really big moves almost never take place against the Closing
Power
trend. So, generally:
Closing Power Usually Is Right
(Opening
Power is more likely to be Wrong if they disagree.)
1
Opening Power Trend Rising + Closing Power Trend
Falling ---> expect lower prices
2
Opening Power Trend Falling + Closing Power Trend
Rising ---> exect higher prices
Breaks in Lengthy and Well-Tested Closing Power Trends
3
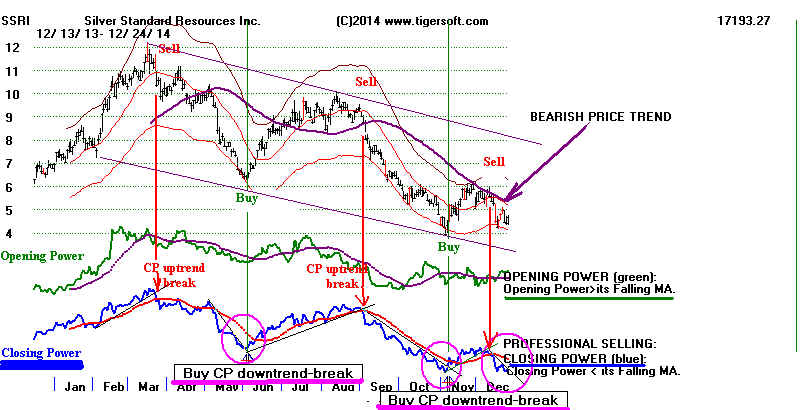
Breaks in well-tested and lengthy Closing Power downtrends are bullish.
SSRI
may soon make a Closing Power downtrend-break. See below.

4
Breaks in well-tested and lengthy Closing Power uptrends are bearish
DUST
might be about to have a CP breakdown. This would be bullish
for
NUGT and mining stocks.

CP: Both Up and Both Down.
In the
short-term, the Closing Power and Opening Power can point in the same direction.
This
indicates the Professionals and the the Public are both net buyers or both net sellers.
This also
usually means the move hast become fast, furious and is reaching a price-climax,
a top or a
bottom. The next direction of prices will be determined by the change
in
direction that the Closing Power takes. So, the BOTH-UP condition is
short-term
very
Bullish. Prices open higher and then go still higher by the close. But this
can only
last a while. The opposite is true to the downside. This is the BOTH-DOWN
situation.
5.
Both Up is short-term bullish until Closing Power breaks its uptrendline.
6.
Both Down is short-term bearish unil Closing Power breaks in uptrendline.
Closing Power
trendbreaks are most reliable when their trendline is well-tested (3x
or more and when
the Closing Power has recently failed to confirm a new price high
or new price low.
7.
The breaking of a well-tested Closing Power downtrendline is particularly
bullish when
Closing Power has failed to confirm a recent low. It is made more bullish
if the
Accumulation Index is positive, the pink OBV Line also did not confirm a
recent low and
the Relative Strength Quotient Line's downtrendline is also being
broken, or
already has been.
8.
The breaking of a well-tested Closing Power uptrendline is particularly
bearish
when Closing
Power has failed to confirm a recent high. It is made more bearish
if the
Accumulation Index is negative, the pink OBV Line also did not confirm a
recent high and
the Relative Strength Quotient Line's uptrendline is also being
broken, or
already has been. .
Candle Stick Charts
Each type
of colored bar in candle sticks has a unique Japanese name and a purported
indication
of strength or weakness.
.
I am mostly
a believer in the value of what I call "big reds" and "big
blues",
"popsicles",
red and blue, either upside down or right-side-up,
"roller
pins" and "hammers". These often appear one after another.
In this
situation, they are more likely to correctly call a reversal of an uptrend.
Candle stick charts show
each days' range of prices and within that,
they show each days' opening and the close. They do not show volume
at all. That's a big limitation because it usually takes rising volume for
prices to eat up overhead supplies of stock at resistance. Often you
will see weekly or monthly candle stick charts. But they have no
value, as I see it.
.
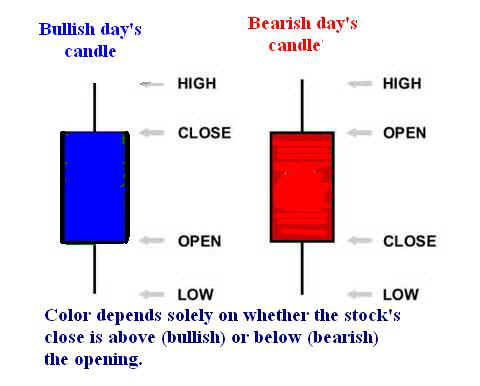
Candlesticks show the price range as the stick and they show the
range between the opening and the close as a box. If the box is
blue In Tiger charts, it means the opening is lower than the close. This
is a positive (bullish day). With Schwab charts, the box will then
be empty, I think. How bullish depends on how far above
the opening, the close is. So a really bullish day would be when
the stock opens down and the turns around and closes at(near) its
highs. Example
High
42.
Close
41.8
Opening 40.
Low
39.75
The opposite type of day is bearish or negative in itself. Here
like SSRI has often done the stock opens high, near its daily high
and then closes near or at its low. Our box from the opening
to the close would be red in color. A Schwab candle stick box would
(I believe) be filled in and black. The stick the box is on would show
the day's high and low. Example.
High
40
Opening 39.97
Close
38.00
Low
37.85
So, the candlestick charts show you patterns of closing above (bullish)
or below (bearish) the opening. This is not apparent to a novice.
But it is important. Openings can be quite deceptive.
Closings are much more important. They reflect the day's full trading by
those who watch the market, the Professionals.
Candle Sticks and Closing Powers
The connection to my Closing Power charting is that I make
cumulative the sum of the differences between openings and closes.
A rising trend would show a series of openings are lower than closes. And
vice verse. The full range is not a factor with my Closing Power.
Now, here is the secret I have found, though there is a whole literature
about different candle-stick formations
The most bullish daily pattern after a long decline would be a very
big blue (or clear - Schwab) box. Suddenly, Professionals are big
buyers again. These I would call; "Big Blues."
The most bearish daily pattern after a long decline would be
a very big red (or filled in - Schwab) box. Suddenly, Professionals
are big sellers. These I would call; "Big Reds"
You will readily see this on most Tiger cande-stick charts.
See how the dominant colors change. My Closing Power
just makes that trend more obvious and shows exactly
when there is a shift.