7/17/2009
From 1990 to 2006, the average gain for each year with these augmented Buy B24
stocks is +36.2%. Others have studied these results and report that if one were
to sell those that drop more than 10% from their purchase price, the returns jump
to nearly 60%. I have not tried to verify this. This chapter lets us look at these
signals in the light of the TigerSoft tools used now in 2009.
The full original study can be seen at
http://www.tigersoft.com/Augented-BuyB24s/index.html
In the study, we simply assume that a stock is held 12 months.
First, here is the basic TigerSoft chart we use now.
Sample 2009 TigerSoft Chart. Note that the right side of the charts are unavoidably
cut off.
Augmented Buy B24s
Back at the beginning of 2007, TigerSoft refined its Buy B24. The
original Buy B24
appears on TigerSoft charts when a new high is made
after the current Tiger Accum-
ulation Index ("IP21") has reached
+.5. By adding additional qualifications, the
Buy B24 becomes rarer, of course, but also more
powerful. Each additional require-
ment brought better average gains for all its
occurrences for the entire period of
1990-2006. A holding period of one year was
used to reckon the gains. The TC-2000
data base was used. Understand that it is very
likely that this testing considerably
under-estimated the gains, since a certain number of
the Augmented B24 stocks were
bought out, and the TC-2000 data base dropped the
data for a company that no longer
exists independently.
After all the testing, the optimal conditions
were determined to be:
1.
The stock first needs to make a 3-month high.
2. The
earlier Accumulation bulge (IP21) must reach +.60
That period of intense insider buying may occur up to 7 months before
the 3 month price high, or it may appear concurrently with the new price high.
3. The
"AI/200" must be between 150 and 200 at time of signal.
AI/200 is a count of the number of days that the Accumulation Index is
is in positive territory over the last 200 days.
4. ITRS
must be in range .0585 -.80 at time of the signal.
ITRS measures relative strength by subtracting the DJIA's 50-day percent
change from the stock's.
5. The
current Accumulation Index (IP21) must be above .37 unless it is above .35
and ITRS>.33
6. OBV must
confirm the high by making a new yearly high.
7. Trading
volume must be at least 1200 shares a day but no more than 1,800,000
8. If
there has been a Buy B24 in the previous 12 months, a new B24 can not
be considered augmented.
It would probably help to require the Closing Power
also be making a new high
for the augmented B24. New software will be
written to use these 9 characteristics.
Several other aspects of the augmented Buy B24 should be
mentioned.
1. Sometimes a
new high that produces a regular Buy B24 soon thereafter
shows a current Accumulation Index well above +.35. As now written, Tiger's
automatic signals only show the first B24. The later "augmentation" is not
indicated automatically, though the levels of the Accumulation Index show
on the chart and the exact value of IP21 for any day can be obtained with the
"vertical line" command.
2. Another important element
is the number of bulges of intense Accumulation
on a one-year chart. While one bulge past +.60 is sufficient to set the stage
for an augmented Buy B24, more such bulges make the stock that much more
bullish, both as an extra vote of confidence from insiders and because more
of the float of the stock becomes tightly held.
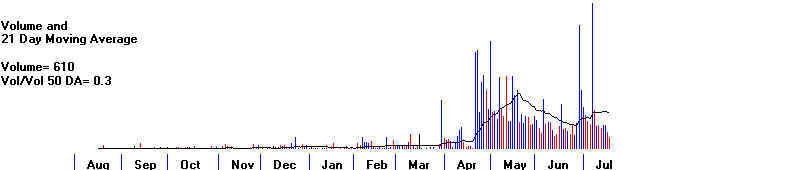
3. Thirdly,
extraordinarily high volume makes a new B24 more bullish. Volume
is needed to move prices. A very big jump shows exceptional demand for the
stocks. This may be occasioned by a news story, or it may not be. When there
is no news, it is more certainly a sign of insider and informed professional
buying.
TigerSoft changes the color of the charts from black to red when volume is
unusually high.
4. Price gaps accompanying a
Buy B24 add bullishness to the picture.
5. Some new highs are more
bullish than others. Breakouts past 3x or 4x
tested flat resistance are more bullish than simply just another new 12 month
high. Breakouts past well-tested longer term resistance, as seen in 5-year
charts are more bullish.
DDRX shows these concepts.
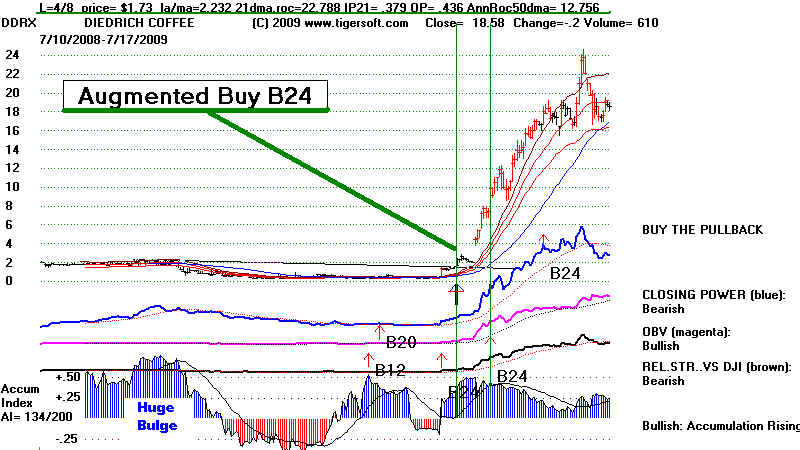
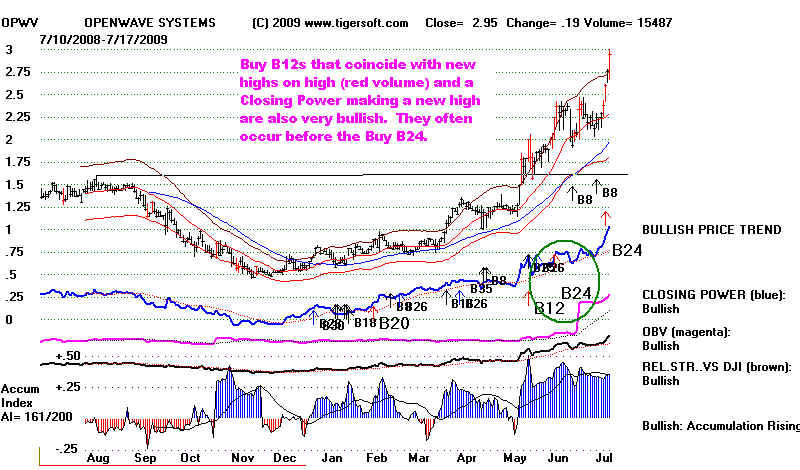
Before continuing, I want to stress that Buy
B12s often precede an augmented
Buy B24. There is nothing said here that should keep you from
buying on a major
Buy B12, especially when the overall market is strong and the
stock is also breaking out
to a 12 month high on unusual (red) volume. In
addition, nested major Buys are also very
important Buys for Tiger users.
We do not need to wait for a 12 month high to
buy an explosive super stock.
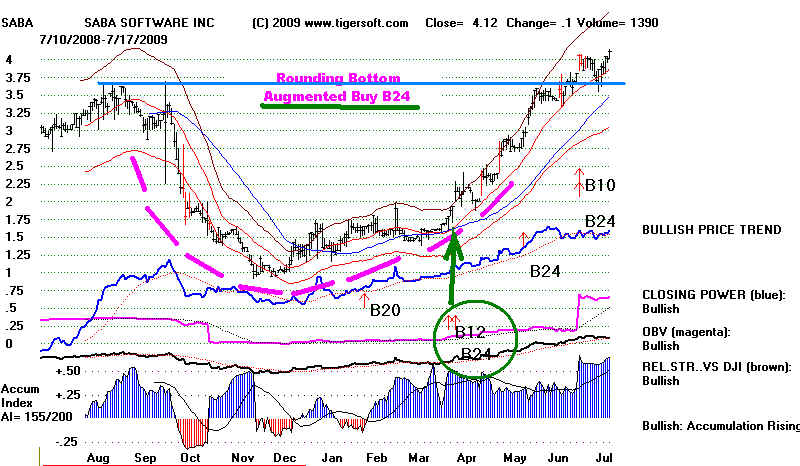
Rounding bottoms are common among stocks that
are not actively traded. The
combination of a Buy B12/augmented B24 works
especially well in a strong
market (steeply rising A/D Line) when prices are
substantially below the 12 month
high. Try to pick stocks that have
considerable headroom, that is they are way
below their 12 month high. And instead of
automatically taking profits at the old
highs, if the internals are good, give the stock a
chance to score a Buy B10
breakout to a new high. That re-establishes the
upturned.
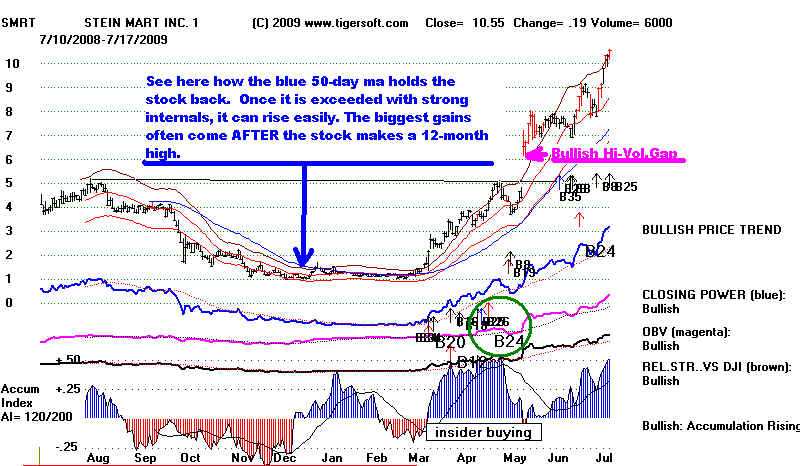
Another caveat. Though we would prefer to buy
stocks showing AI/200 scores higher
than 140, everything has to be considered. In the
case of SMART below, big buyers
were clearly waiting for the stock to get back above its
blue 50-day ma to buy. As soon
as the overall market gloom lifted the stock advanced above
the 50-DMA and the insider
buying started. The bulge of Accumulation above +.50
shows this. And such buying is
very bullish when followed by strong upwards price action
by the stock. Clearly insiders
were buying and were not eager to take profits. Such
an interpretation is born out by
Yahoo's statistics on insider buying in SMRT. There
are no insider sales in this period
and lots of buying of 100,000 shares are more.
See http://finance.yahoo.com/q/it?s=SMRT
| 22-Jan-08 | STEIN JAY Officer |
111,400 | Direct | Automatic Purchase at $4.15 - $4.3 per share. | $471,0002 |
| 17-Jan-08 | STEIN JAY Officer |
237,100 | Direct | Purchase at $4.23 - $4.3 per share. | $1,011,0002 |
| 16-Jan-08 | STEIN JAY Officer |
240,000 | Direct | Purchase at $4.18 - $4.28 per share. | $1,015,0002 |
| 16-Jan-08 | STEIN JAY Officer |
60,000 | Direct | Purchase at $3.83 - $4.17 per share. | $240,0002 |
| 15-Jan-08 | STEIN JAY Officer |
100,000 | Direct | Purchase at $3.75 - $3.89 per share. | $382,0002 |
| 14-Jan-08 | STEIN JAY Officer |
135,500 | Direct | Purchase at $3.60 - $3.98 per share. |
| 11-Jan-08 | STEIN JAY Officer |
500,000 | Indirect | Acquisition (Non Open Market) at $0 per share. | N/A |
| 11-Jan-08 | STEIN JAY Officer |
1,000,000 | Indirect | Disposition (Non Open Market) at $0 per share. | N/A |
AUGMENTED B24s ARE POWERFUL
The average gain
for each year with these stocks is +36.2%. Others have
studied these
results and report that if one were to sell those that drop more than 10%
from their
purchase price, the returns jump to nearly 60%. I have not tried to verify this.
The full
study can be seen at http://www.tigersoft.com/Augented-BuyB24s/index.html
In this study, we
simply assume that a stock is held 12 months.
| Year
Avg.Gain Winning Trades Losing
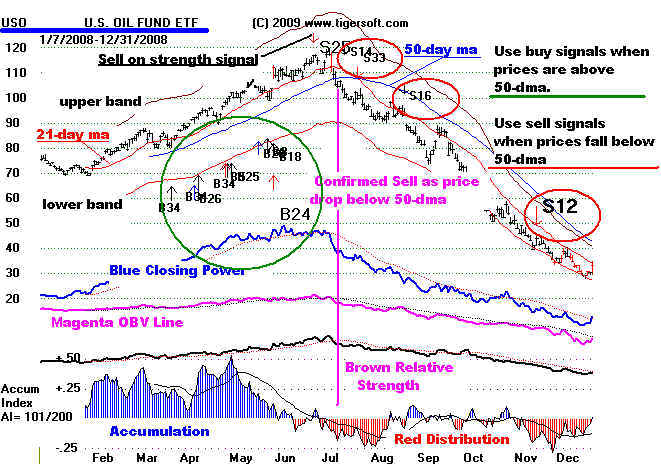
Trades Gains>100% Losses<-30% 1990 + 44.7% 3 1 1 1 1991 + 29.6% 10 4 2 1 1992 +56.6% 9 4 2 0 also a +91.8% gain 1993 +14.0% 11 9 3 1 1994 +10.0% 5 4 1 1 1995 +37.5% 12 4 2 2 1996 +34.2% 13 7 2 0 also a +93.8% gain 1997 + 7.3% 11 8 0 3 also a 91.9% and 87.3% gains 1998 -13.6% 1 6 0 1 1999 +175.6% 1 1 1 0 2000 +40.4% 4 2 1 1 2001 + 1.0% 10 10 0 2 2002 +19.0% 10 6 2 3 2003 +58.4% 38 6 9 2 also 3 over +80% 2004 +40.9% 18 7 3 2 2005 +23.9% 26 7 2 1 2006 +27.2% ----------------------------------------------------------------------------------------------------------- +36.2% 182 86 31 21 Also 2007 incomplete but there were a number of stocks that did very well. 2008 The super stocks in this year were the penny oil stocks until the bubble burst. 2009 Many, many low-priced stocks qualified here and did superbly. If there has previously been a Buy B24 (augmented or not in the prior year), a new Buy B24 cannot be considered augmented. The earlier B24 signifies that insiders have already taken substantial positions. As a result, the stock may already have seen its price ripen to the point where they may take profits long before the point where a year has passed since the latest B24. See the charts of GHM to show this. April and June saw regular B24s in the chart of GHM below. The second GHM chart displays a November Buy B24 that could not override the bearish weakness in the declining (blue) Closing Power. 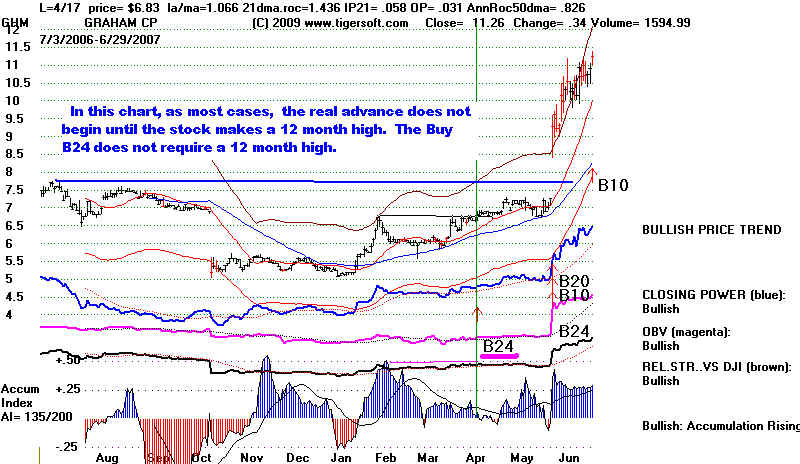 BUY SELL 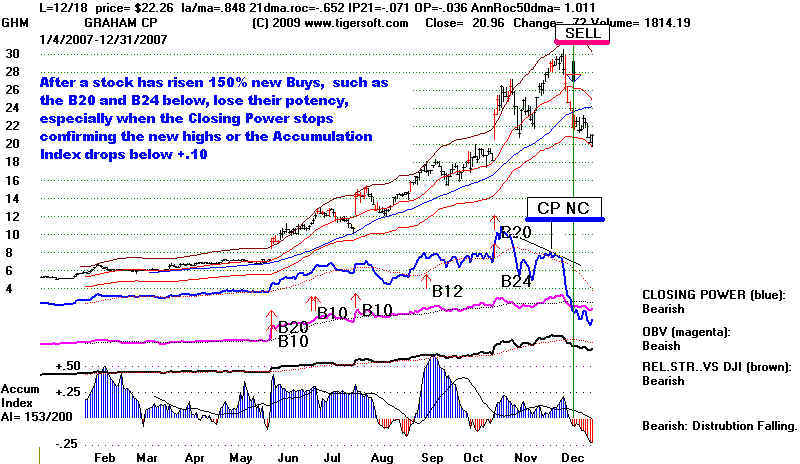 The average gain of +36.2% is so high because of a small number of stocks that rose hundreds of percent. The conclusion one might draw from this is to buy and hold a handful of such stocks for a year. I think that is no longer a desirable conclusion. That worked well in the go-go years of hyper-speculation in the late 1990s and between 2003 and 2007. But, it is too risky now. 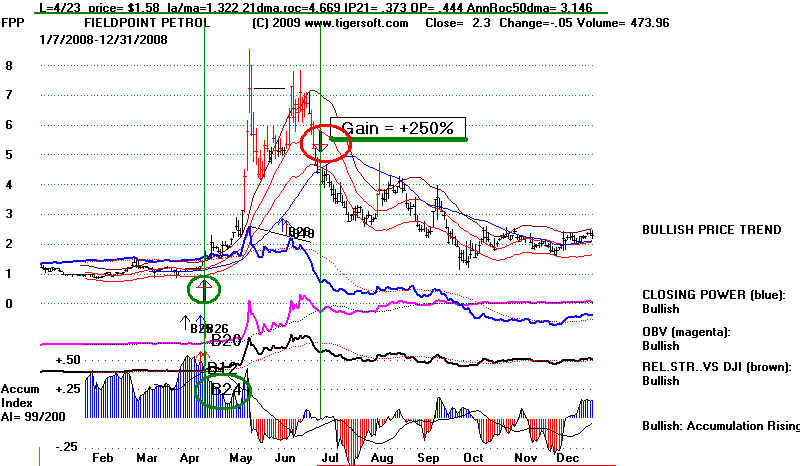 The collapse of low priced energy stocks in 2008 show that one must be prepared to sell earlier than simply holding for one year. Using the 50-day ma as a place to use a closing stop loss is still the best single approach. Adding the requirement that the Accumulation index either be negative or the Closing Power be below its 21-day ma when the stock closes below the 21-day ma is the basic recommendation here. You can see how helpful this was in the second chart below - in the case of GTE. Note that here we are taking profits on a penetration of the 50-day ma even when the Accumulation Index is still positive if the Closing Power is weakening very significantly. The first chart shows a case of a new high made with the older Buy B24. The stock makes a new high after a bulge of the Accumulation Index above .50, but not .60. In addition, the current Accumulation ("IP21") was only .203, not above .35, as required by the augmented Buy B24. 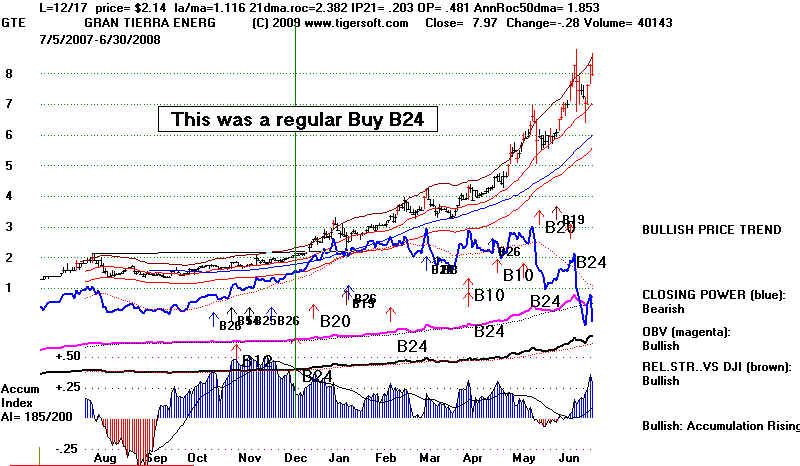 Buy @ 2.14 See - Tiger Blog "King Coal's Super Stocks. TigerSoft's Charts Spotted Them Early-On." http://www.tigersoftware.com/TigerBlogs/6-3-2008/index.html Before GTE turned down, the blue Closing Power became very weak. The stock's move past 8 to a new high was widely unconfirmed by the blue Closing Power. This signified that professional selling was already widely outweighing professional buying. In this condition, when the stock closed below its 50-day ma, Tiger users should have take profits. Sell @ 5.87 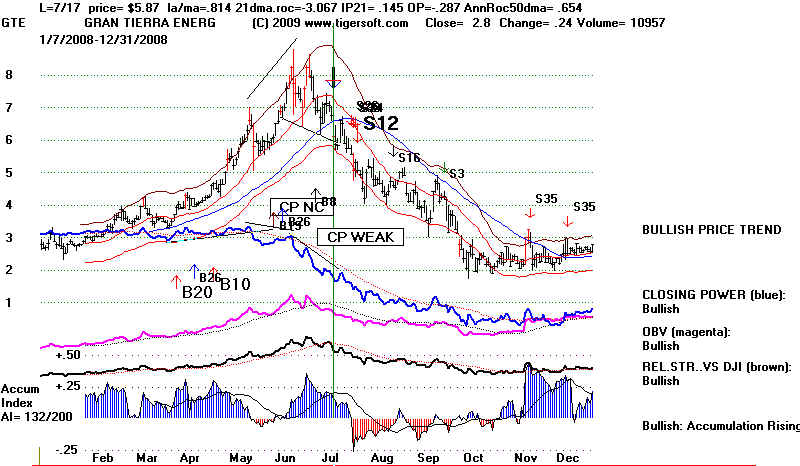 After an augmented Buy B24, expect the stock to rise steadily. The data from 1990 to 2006 shows that biggest gains often come between the 6th and the 12th month after the first augmented Buy B24. But we do not want to be bound by such expectations. In FPP (below), the stock leapt 300% in a month. I'm pretty sure taking profits after a 300% gain in a month would test well. If you did not sell, see how the next rally saw the Accumulation Index drop into negative territory. Seeing that, one might well have decided to take profits. I can't show what happened to FPP below at this point because it has stopped trading, but we can guess it sold off badly with most other stocks in the second half of 2008. 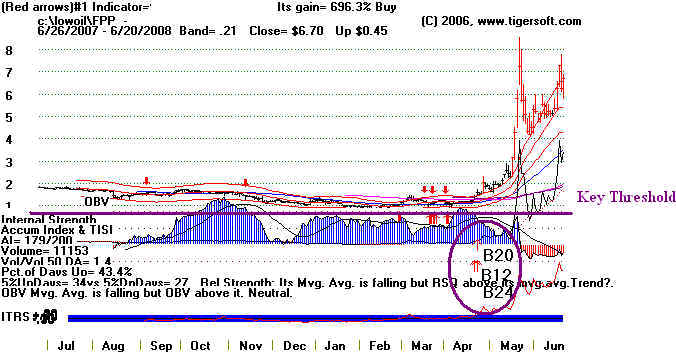 Stocks under $2.00 a share behave similarly to higher priced stocks. And they offer a trader with limited funds an excellent way to learn proper trading techniques. There is one important difference. Many very low-priced stocks go to sleep for long periods. Using TigerSoft signals and indicators will let you avoid getting caught in most, but not all of these stocks' periods of dormancy. TigerSoft's Power Ranker easily lets you spot stocks coming alive with particular buy signals and other key characteristics, like prices making a 12 month high or unusual volume.. 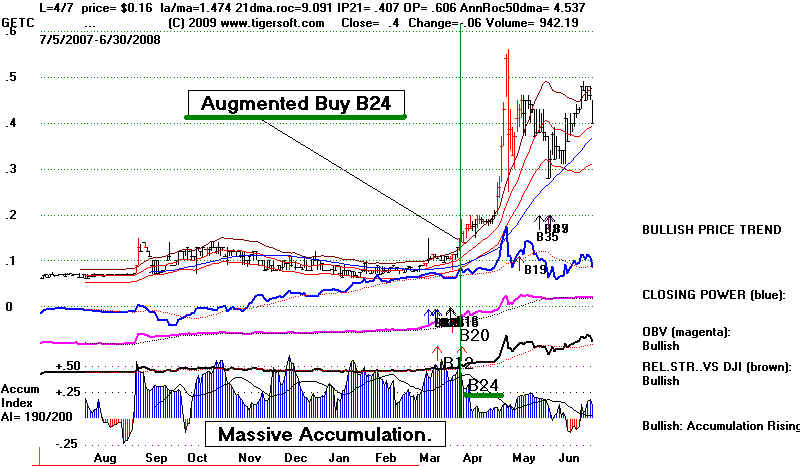 BUY @ 0.16 When the stock drops below its 50-day ma with a swooning (blue) Closing Power and a negative Accumulation Index, it is time to take profits. SELL @ 0.41 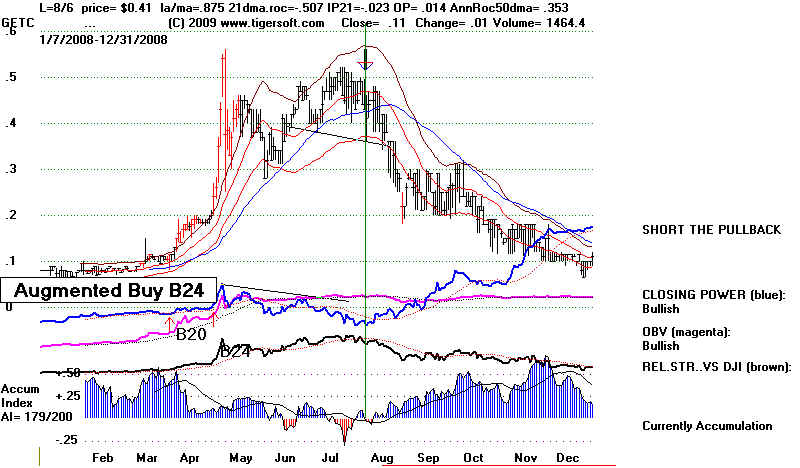 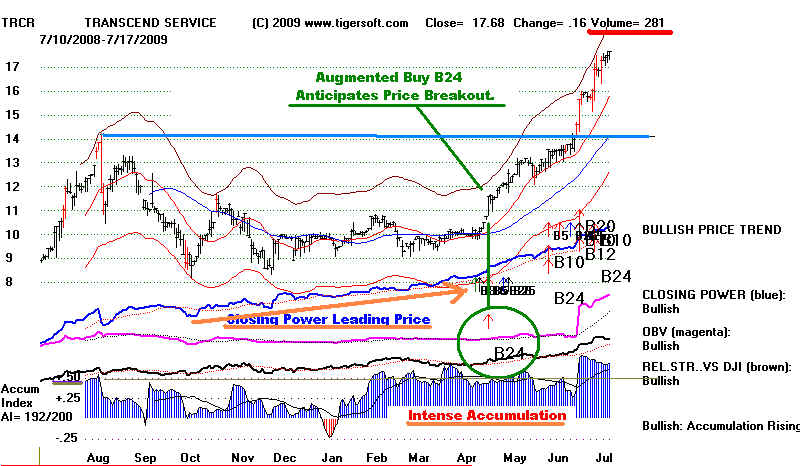 Below are some more cases of augmented Buy B24s. . -------------------------------- 2008 ------------------------ 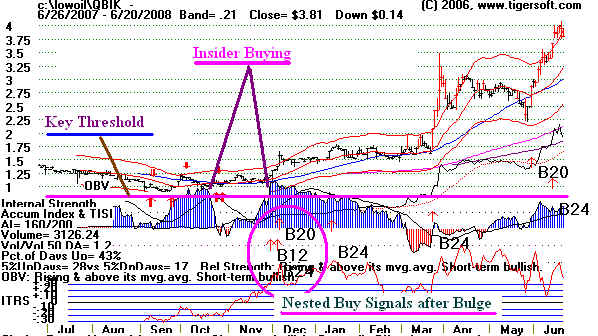 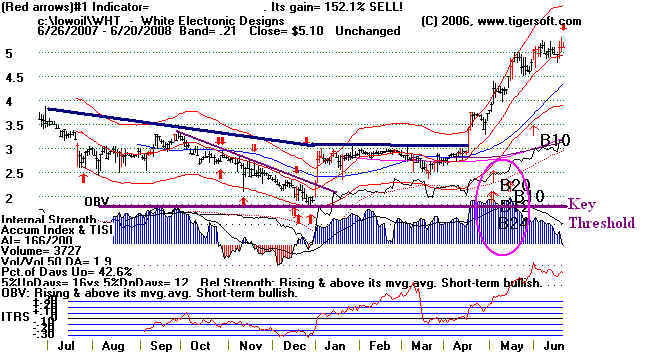 |
--------------------------------
2009 ------------------------ See how Closing Power made a new high ahead of prices. This is typical in an "explosive super stock". It is not in itself a reason to Buy. But it does enhance the attractiveness of a stock under consideration.  You will often find that augmented Buy B24s are thinly traded stocks. Buying these carefully in smaller amounts. Also consider buying them at the opening when their Closing Power is very strong. 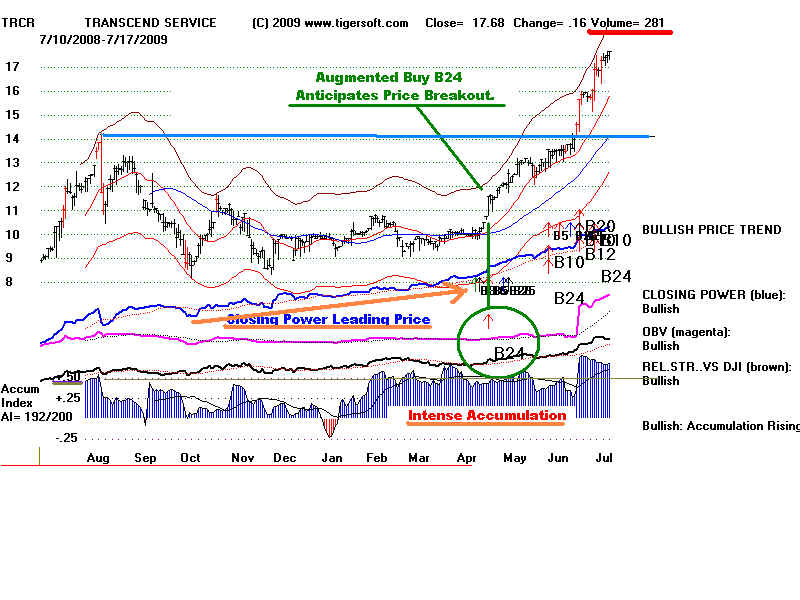 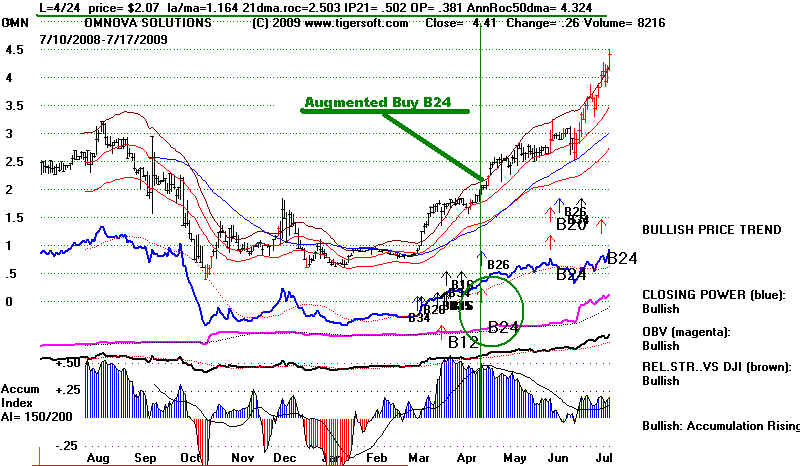 |