

TigerSoft and Peerless Daily
Hotline
www.tigersoftware.com/9933Hot
(C) 1985-2014
William Schmidt, Ph.D. www.tigersoft.com
All rights strictly reserved.
Tiger
Software 858-273-5900
PO Box
22784 San Diego, CA 92192
Email william_schmidt@hotmail.com
On Thursday

-----------------------------------------------------------------------------------------------------------------------
Previous Hotline - http://tigersoftware.com/2233HL/index.html
6/25/2013-9/1/2014
http://tigersoftware.com/112211-H/index.htm 11/22/2013-3/20/2014
http://tigersoft.com/1111-HL/index.html
10/22/2013-11/21/2013
Past Hotline Predictions
http://tigersoft.com/-HL42013/index.html
http://www.tigersoft.com/-2GBL13HL/index.htm
----------------------------------------------------------------------------------------------------------------------
PLEASE...Sharing this hotline address with
non-subscribers is a violation of our contract
with you and a violation of copyright laws. I
work hard for you. Respect that effort!
---> To
renew this Hotline, order
here $350 (check) - $360(Visa/MC)
www.tigersoft.com/-2GBL13HL/index.htm
--------------------------------------------------------------------------------------------------------------------
A Guide
To Profitably Using The Tiger Nightly HOTLINE
Peerless Signals: 1915-2013
New Peerless
Signals and DJI Charts - version 7/4/2013
1965 1965-6
1966
1966-7
1967
1967-8
1968
1968-9
1969
1969-70
1970
1970-1
1971
1971-2
1972
1972-3
1973
1973-4
1974
1974-5
1975
1975-6
1976
1976-7
1977 1977-1978
1978 1978-79
1979
1979-80
1980
1980-1
1981
1981-2
1982
1982-1983
1983
1983-1984
1984 1984-1985
1985 1985-1986
1986
1986-1987
1987
1987-8
1988 1988-9
1989
1989-90
1990 1990-1
1991
1991-2
1992
1992-3
1993
1993-4
1994
1994-5
1995
1995-1996
1996
1996-7
1997
1997-8
1998
1998-1999
1999
1999-2000
2000
2000-1
2001
2001-2
2002
2002-3
2003
2003-4
2004
2004-5
2005
2005-6
2006
2006-7
2007
2007-8
2008
2008-9
2009
2009-10
2010
2010-11
2011
2011-12
2012
2012-2013
Background and New Studies
Announcement:
1 The On-Line Explosive Stocks
is finished.
2 The
On-Line Killer Short
Sales book is also finished, but
will be
re-edited this coming week.
I call your attention now to the many new concepts and
the considerable new research in them: For example:
1) A very good New Tiger Buy B12 for Low Priced Stocks (1)
2) After Red high volume reversal days use CP uptrend-breaks.
3) Buy the stocks the Federal Govt wants you to buy. (1)
4) 100-Day Power Rankings... (1)
5) Using Closing Power Hooks after Buy B26s and B20s. (1)
6) How A Stock Reacts to Its Earnings Report Is Very important. (1)
7) TigerSoft Major Buy Signals' Combinations
Which are most Powerful? Reliable? (1)
8) Augmented Buy B20s' Independent Success Rate. (1)
9) What factors warn a rising 65-dma will not hold? (2)
10) The classic cluster of technical characteristics that commonly appear
in the 23 stocks falling 70% or more in the deep pullback of 2011. (2)
Purchase each all new book by CC for $42.50 or send a check
for $37.50 to me: William Schmidt, 5970 Gullstrand St., San Diego, CA 92122.
Introduction to
Tiger/Peerless Buys and Sells.
new
Sept 2014 Peerless Buy and
Sell Signals
Different Types of
TigerSoft/Peerless CHARTS, Signals and Indicators
Documentation for
TigerSoft Automatic and Optimized Signals.
How reliable support is the
DJI's rising 200-day ma?
SPY Charts since 1994:
Advisory Closing Power S7s, Accum. Index, 65-dma, Optimized
Signals.
"The Jig Is Up": Calling
September and October Tops.
A Keynesian's Warning Signs.
4/7/2014 Advisory Pink Closing Power
S7s at ETF at top since 1994
1994 1996 1997 1998 1999
2000 QQQ SPY
DIA 2002
2007
2008
SPY 2011 2013-2014
Tiger Buy and Sell Signals: New 2014 Research:
These are randomly chosen groups.
but clearly we need to back-test them in more years.
You can replicate or do similar studies yourself
for other signals and/or other years.
9/1/2014 - 2014 Tiger B19s -
Steady rallying and no pullbacks below the 21-day ma.
9/2/2014 - 2014 Tiger B17s on 14As taken
alphabetically
9/3/2014 - 2014 Tiger B17s on 60 Biotechs taken
alphabetically
9/4/2014 - 2014
Tiger B18s on all "R" stocks taken alphabetically
9/8/2014 - 2014
Tiger B20s - Conclusion: Use Closing Power trendbreaks in aftermath.
9/8/2014 - 2014
Tiger B16s - Conclusion: Use mostly when LA/MA
under 1.05.
9/11/2014 - 2014 Tiger B15s - Conclusion: Certain conditions improved the results dramatically.
9/12/2014 - 2014
Tiger B25s - Conclusion: 87.5% success rate when
other internals are positive.
9/15/2014 - 2014 Tiger B25s - Best conditions for using B25s with somewhat higher RSX
capitalization stocks.
9/16/2014 - New Tiger
Closing Power Take-Off Buy Signal in 2014: 14s, QQQ, DJI-30 and ETFs
9/17/2014 - New
Tiger Closing Power Take-Off Buy Signal: 2009A-s
9/18/2014 - New
Tiger Closing Power Take-Off Buy Signal: 2010A-s
9/21/2014 - New
Tiger Augmented Sell S8s: DJI-30 - 2014
Requiring S8s to show Negative CP%-Pr and IP21<+.15 produced a 70% success rate
in a rising market. for DJI-30 stocks and big ETFs.
9/24/2014 - Tiger
Sell S14s: They make price breakdowns very bearish.
The New 2014 Peerless.exe Software has now been posted on the Elite Stock Professional
Page.
---> To Older Hotlines
Lines
Announcements
NEW S17 Peerless update has been posted on Tiger Elite Stock Professionals' Page.
It includes new Tiger signals showing most reliable tests of 65-dma, a Buy B2
and a Sell S2. Also in it
is a Buy B13 and S13 to show Closing Power spikes.
NEAR65.exe on Data Page
The Tiger Data page
now offers a night download of the stocks that have
closed within 1% of a 65-dma. We want to see which way stocks are jumping.
We also want to find stocks perfectly poised to take off or collapse. Here the
Closing Power trend reversals are important.
Lots of factors affect whether a stock will hold or whether
it will fail on a test
of the 65-dma. I think the Closing Power Percent - Price Percent using their
65-day highs and lows is one of the best predictors. More on this in the
coming nights. The current CP%-Pr% is shown to the right of the graph.
This update is $95 if you do not have a subscription to
the Elite Page. If you
purchased the B20 update a few weeks ago, I will send you the link to this
update on Wednesday.
-------------------------------------------------------------------------------------------------------------------------------------------------------
Additional Peerless Indicators:
65-day ma Percent Data for
Different Sectors
Steep breadth downtrend-lines were
broken today.
But only Bonds, Utilities, DJI stocks and
Beverages show a majority of their stocks above the 65-dma.
Net Idosc on DJI, QQQ, SP-500 and Russell-1000
(very short-term)
The NID fell today for the stocks
in QQQ, SP-500 and Rus-1000 despite the big rally.
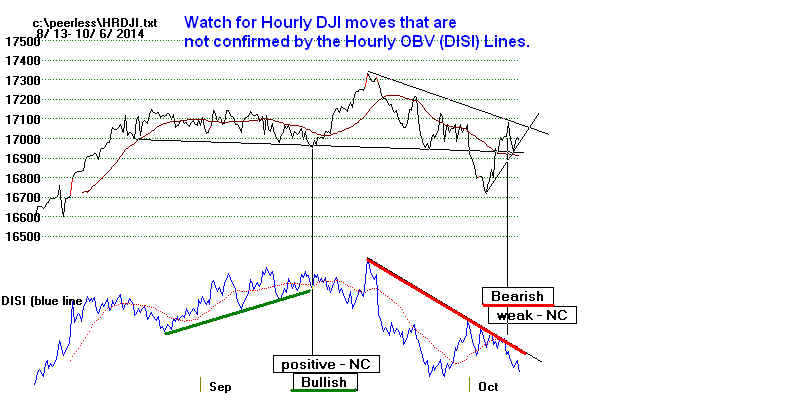
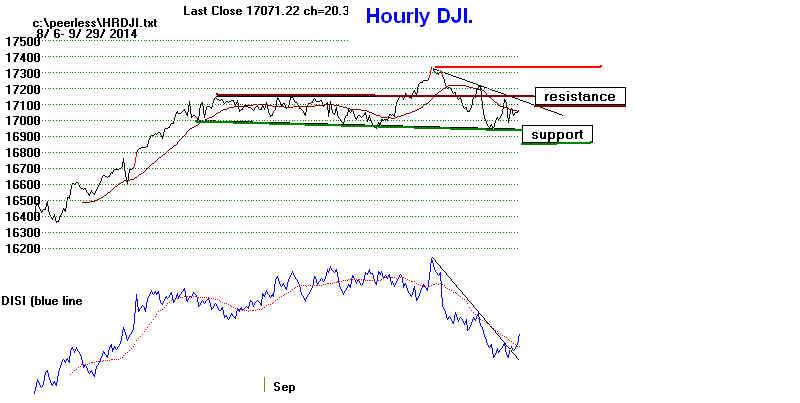
Hourly DJI (very short-term)
The DISI (OBV Line) is still
downtrending.
NIGHTLY HOTLINES
10/8/2014
The Two-Day Reversal today was Bullish.
Who wants
to fight the Fed? Buy IBB, but wait on buying
the other
ETFs. The pattern of wild Closing Power
fibrillations may not be broken. We need to see the
Bears'
response to this rally.
Key Values
16994 la/ma=.997 21-dmaROC= -.014 P = -290 P-ch = 172
IP21 = -.011 V = -.126 OPct= -.003 65-d UpPct = .005
A New 2-Day Turn-Around Buy B19?
Today's fine two-day turn-around did not generate a Peerless Buy signal.
No Buy B19 was given here because the DJI closed a little too close to
the 21-dma and showed an Adv/Decl Ratio of 4.0, which was less than
the 4.74 level required of Buy B19s. In addition, the previous day's A/D
Ratio was only .297. It needed to be less than .211 to get a Buy B17.
Still, who wants to fight the Fed? The Fed as a whole clearly
wants to
give investors every confidence that they will not be raising rates soon,
that investors will be warned in a timely and a transparent way when this
is going to happen, that they consider a Dollar that runs away on the upside
does too much harm to US manufacturing to allow and that they need
much more good Jobs' Data to believe the US economy is safely on a growth
path. Clearly, the Fed is on the side of keeping stocks rising. They
do not want a potential October melt-down.
So, what can we say about today's reversal? When we
test A/D
Ratio parameters that bracket what we saw today, we do find this
could easily be made into a good Buy signal, except that all
but one of the 10 test-B19s occurred before 1960. The only real
paper losses came when this test-B19s occurred in the Summer.
See Table 1. 5 of the 10 would have gained more than 9% on
the DJI. So, why fight the Feds?
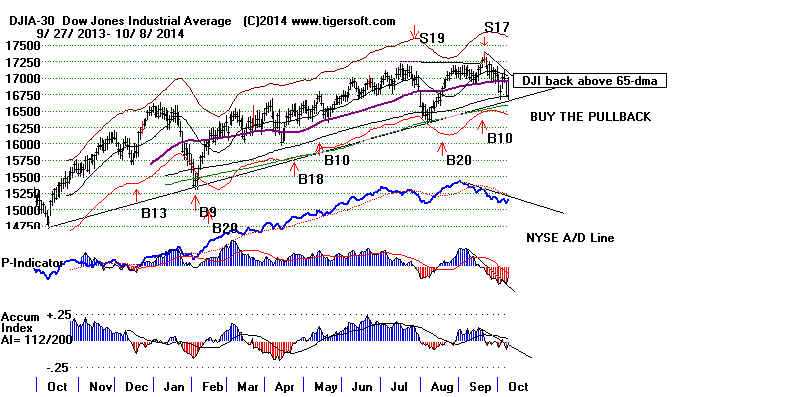
My judgement is that after a few days' hesitation here at 17000, at the
DJI's 21-day ma and flat 65-day ma, the NYSE A/D Line will probably
break its downtrend and the DJI will rally back up to its resistance at 17200
where it will fall back again. Since 70% of all stocks are still
below their 65-day ma,
the Hourly DISI remains weak and
the Net IDOSC actually fell today for the
stocks in the QQQ, SP-500
and Russell-1000, I would expect a pullback and some
re-grouping, although IWM did break its Closing Power's
downtrendline.
Above its CP>its CP%-Pr%
IP21 Automatic
65-dma 21-day ma
Signal
DIA
No
no -17%
-.009 Red Sell
CP is below its wildly fibrillating downtrend.
QQQ
Yes
yes -7.5%
.088
.............. CP caught in its own trading range
SPY
No
no -6.9%
+.026 Red Buy
CP is below its wildly fibrillating downtrend.
IWM
No
no +1.9% -.116
Red Buy CP broke its steep downtrend slightly.
IBB
Yes
yes
-0.4% +.137 Red
Buy CP broke its downtrendline.
-----------------------------------------------------------------------------------------------------------------------------------
> To Key Index and Leading Stock Charts: DJI, SP-500, etc.
Peerless DJI Chart SPY Chart NASDAQ Chart QQQ
Chart
IBB Chart
IWM Chart
Hourly DJI-OBV Hourly-MVM0735
FAS-3x Financials IBB-Biotechs
-----------------------------------------------------------------------------------------------------------------------------------
-->58 +44 MAXCP stocks Bullish MAXCP Stocks (11/8/2014)
--> 221 -173 MINCP stocks Bearish MINCP Stocks (11/8/2014) Bearish
plurality
--> 21 +12 New Highs on NASDAQ
93 -86 new lows.
Bearish plurality
--> 27 +15 New Highs on NYSE 56 -90 new lows.
Bearish plurality
-----------------------------------------------------------------------------------------------------------------------------------
Buy IBB
Buy some of the Bullish MAXCP stocks and holding short
the Bearish MINCP stocks as long as they stay below their
falling Closing Power. I would wait for the Closing Power
downtrends to be more clearly broken to do any buying in the
major market ETFs. IBB is more bullish than any of these.
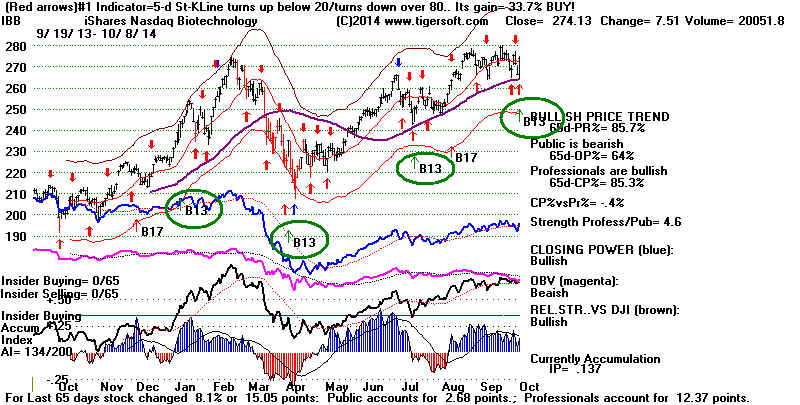
I would buy IBB. See it below. It also shows a
new Tiger Buy B13.
Today its Closing Power took the biggest leap upwards in last
65 trading days. See how well two earlier Tiger Buy B13s worked
in buying IBB.
IBB
Table
1 What happens when yesterday's and today's Advances/Declines Ratio
are similar to that of yesterday and today. Yesterday's A/D Ratio must
between .25 and .35 AND today's A/D Ratio must be between 3.5 and 4.5
3/3/1933
Rose from
53.8 to 108.7 on 7/10/1933 Superb
signal. No paper loss
.966 -1.509
-71 11 -517 -.013 -239 -.059 -.092
Bear Market bottom.
---------------------------------------------------------------------------------------------
3/19/1935 Rose from
98.3 to 116.6 on 5/16/1935 Superb
signal. No paper loss
.970 -.75
-120 1 -669 -.114 -200 -.091
-.026 On-Going Bull Market
---------------------------------------------------------------------------------------------
6/1/1938 Rose 110.6 to
144.9 on 7/25/1938 Superb signal.
No paper loss
.968 .052
-45 29 -237 -.036 -57 -.07
-.147 Bear Market Ending.
---------------------------------------------------------------------------------------------
7/19/1944 Fell from 148
to 143.6 on 9/7/1944 3% Paper Loss before
rallying to the upper band.
.994 -.032
39 8 209 .008 0 .137 .074 On Going Bull
Market
---------------------------------------------------------------------------------------------
9/15/1944 Rose from 144.1. to
152.3 on 12/15/1944 6+% Gain. No paper loss
.986 0.260
23 1 126 -.096 -3 -.191 -.007
---------------------------------------------------------------------------------------------
11/26/1945 Rose from
188.2 to 205.8 on 2/4/1946 9+% Gain. No
paper loss
.997 .126
103 42 469 .145 106 .018 .153
---------------------------------------------------------------------------------------------
7/31/1947 Fell from
183.2 to 175.1 before rally back to upper band at 185.3 on 10/20/1947
.997 .188
88 -6 367 .053 53 .17 .085 +1% Gain. 4.5% Paper Loss
---------------------------------------------------------------------------------------------
10/17/1952 Rose from
267.3 to 293.8 on 1/5/1953 9+% Gain.
1.5% Paper Loss
.987 -.137
-68 -6 -250 -.036 -163 -.216 -.033
---------------------------------------------------------------------------------------------
8/20/1959 Fell from
655. to 618.2 on 9/21/1959 A head/shoulders
pattern intervened.
.986 -.168
-63 20 -186 -.038 -364 .052 .036
6.0% Paper Loss
---------------------------------------------------------------------------------------------
10/28/2008 Rose from
9065.12 to 9319.83 on 11/3/2008 and then fell to 7552.29 on 11/20/2008
.997 -.014
-290 172 -290 -.011 -126 -.003 .005
3+% Gain. No paper loss
--------------------------------------------------------------------------------------------
Table 2 below shows that the 10/3/2014 rebound had a weaker breadth ratio than
any of the 18 rebounds that
took the DJI back up to the upper band or higher since the
bear market bottom in March
2009. That the next day saw the DJI decline is not inconsistent
with a rally to the upper
band, but it occurred only in 3 of the 18 earlier rebounds.
For the 10/8/2014 rebound to look
more like the other successful rebounds below,
the DJi will need to rally on
10/9/2014.
Table 2
------------ Big DJI Reversals
Following Declines --------
NYSE A/D
DJI Daily
Jumps Next Day
up down Ratio
---------------------------------------------------------------------------------------------------------------------------
10/8/2014 2551 638
4.00 16719.39
to 16994.22
10/3/2014 2124 1035
2.05
16801.05 to 17009.69 16991.91 Rally Failed.
8/8/2014 2397 773
3.10
16368.27 to 16553.93 16569.98
2/6/2014 2345 776
3.02
15440.23 to 15628.53 15974.08
10/10/2013 2557 450
5.68 14702.98
to 15126.07 15237.11
9/9/2013 2464 615
4.01
14922.50 to 15063.12 15191.06
6/25/2013 2493 820
3.04
14659.56 to 14760.31 14910.14
11/19/2012 2696 356
7.57
12588.31 to 12795.96 12788.51 hit 13350.96
6/6/2012 2691 377
7.14
12127.95 to 12414.79 12460.96
10/6/2011 2607 474
5.50
10939.95 to 11123.33 11103.12 hit 12231.11
8/11/2011 2832 228
12.42 10719.94 to
11143.31 11269.02
6/28/2011 2457 605
4.06
12043.56 to 12188.69
12261.42
3/17/2011 2232 819
2.72
11613.3 to
11744.59 11858.52
12/1/2010 2403
676 3.55
11006.02 to 11255.78 11362.41
9/1/2010 2668
431 6.19
10014.72 to 10269.47 10320.1
7/7/2010
2689 447
6.02
9743.62 to 10018.28 10138.99
6/10/2010
2731 405
6.74
9899.25 to 10172.53
10211.07
11/5/2009
2495 537
4.64
9802.14 to 10005.96
10023.42
7/13/2009
2565 498
5.15
8146.52 to 8331.68
8359.49
3/10/2009
2936 225
13.05
6547.05 to 6926.49 6930.40 |
|
-------------------------------------------------------------------------------------------------------------------------------------------------------
OLDER HOTLINES
-------------------------------------------------------------------------------------------------------------------------------------------------------
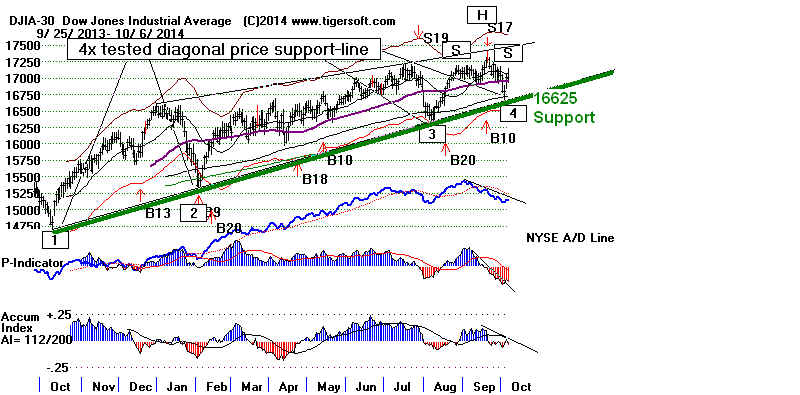
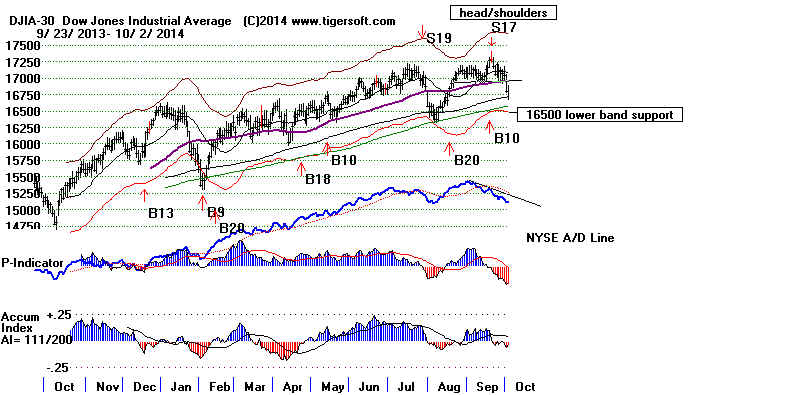
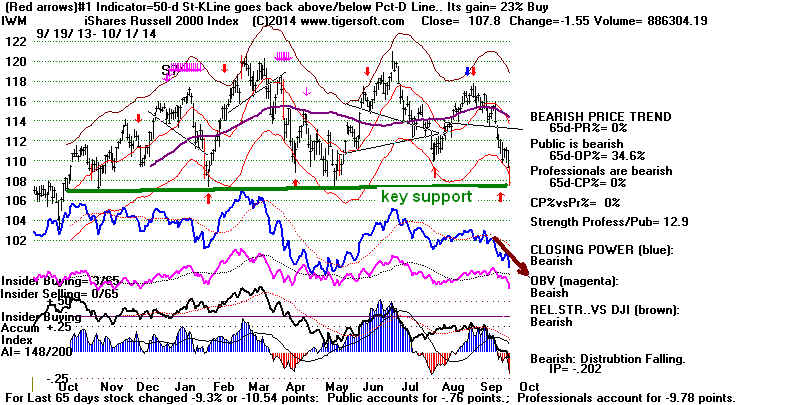
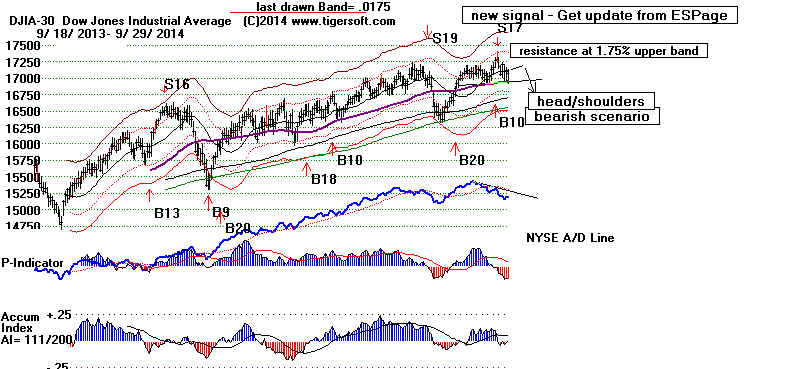
10/7/2014
The Sell S17 and lop-sided DJI head/shoulders pattern normally
promise a test of the lower band. Today's sell-off was occasioned
by heavy institutional and Professional Selling. That is about 200
points lower. We much watch now to see if the DJI
can hold above
its well-tested uptrendline. This crosses at 16624, or 95 points lower.
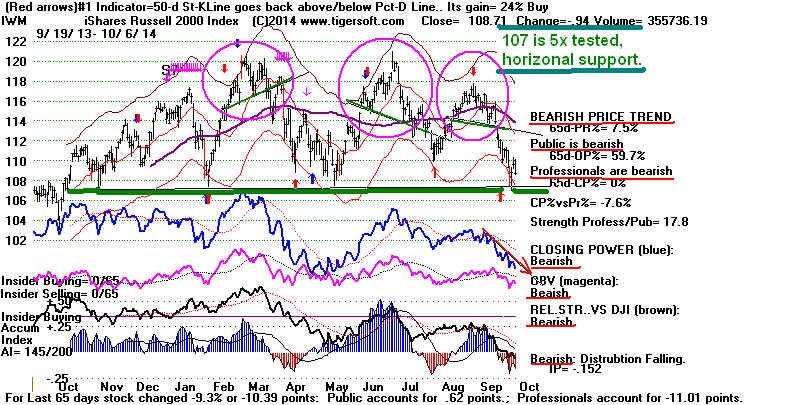
As we feared, the Russell-2000 could not bounce up from its
well-tested
flat support. Because it is October and because there are so many
leveraged vehicles for short sellers to apply theri trade on down-ticks,
I think it would be dangerous to try to call a market bottom here.
Today's weakness caused a majority of the DJI stocks to break
below the support of their 65-dma. About 79% of ALL stocks are
now under that key support level. The major market ETFs; Closing Powers
are all in downtrends. The Hourly Down-Volume has bearishly picked
up and Down-Hour Volume is now leading the DJI lower. The
Russell-2000 and IWM penetrated their well-tested horizontal
support. Now the SP-500 and DJIA are testing their price uptrend-lines.
I would think these will need to be thoroughly challenged before
there can be much of a rally. Until the Closing Powers break their
downtrends, I would expect lower prices.
How Can The Economy Hold
Up
Now That The Big Boys Starting To Panic?
It is said that the big boys are now in a
great hurry to get out of the market
and some are
selling short. And I read that 95% of SP-500 profits
are being used to buy back shares of stock rather than invest in
a business expansion. This is a recipe for big trouble. With the
shrinking middle class holding off on more and more big purchases
and the working class living pay check to pay check, only small businesses
and Government can keep the economy going. Republicans don't
believe in Goverrnment stimulus and Democrats have utterly forgotten
how to teach Keynesian economics to the electorate. So, everything
now depends on small business. Let's hope the next Jobs Report
stays strong. But now we are hearing of big corporate lay-offs
again. Hewett
Packard just announced today it will lay off 56,000 workers.
That will definitely hurt next month's Jobs numbers. The recent declines in
the stocks of Ford, Boeing, Caterpillar and United Technologies
are so
steep (because of the rising Dollar and weaker demand globally), I can't
see how they, too, will not be forced to layoff tens of thousands of workers.
And, as I showed this weekend here, negative Job Growth and lower
profits are what seem to set off bear markets.
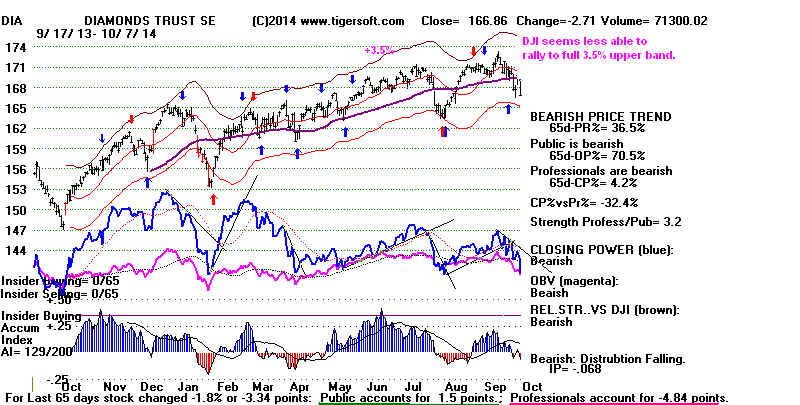
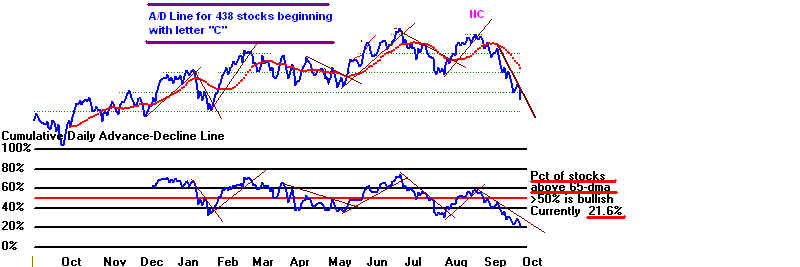
The DJI (DIA), the Falling Closing Power
and the Falling A/D Line for all the "C" Stocks.
Lest we trust too much that the absence of Sell S9s can save the market,
I need to remind readers that Sell S9s are based on the NYSE A/D Line
falling way behind the DJI. But with interest rates so low, bond funds and
dividend stocks on the NYSE have gotten an extraordinary lift for years.
Even now with the market falling, bond funds have turned up. Low interest
rates reflect not just loose monetary policy but a lack of demand for Money,
in a weak economy,
Such forces have artificially boosted the A/D Line ever since
2009. What we need now to do is to be aware of how much weaker the
average common stock is than the DJI-30. We can remedy this.
If we plot the DJI on top and, say, the A/D Line on the bottom for,
all the stocks beginning with "C", for example, we see that a growing bearish
divergence is taking shape between the DJI stocks and most other stocks.
If we also allowed S9s based on such breadth divergences when the DJI
tagged only the 1.75% band, we would have seen a Sell S9 two weeks ago
instead of a Sell S17. I think we will have to start watching for such
bearish divergences.
The good news is that this divergence only became glaring several
weeks ago. In 1929, 1987, 2000 and 2007-8, the A/D Line lagged
the DJI for 6 or more months before a final top was reached.
-----------------------------------------------------------------------------------------------------------------------------------
> To Key Index and Leading Stock Charts: DJI, SP-500, etc.
Peerless DJI Chart SPY Chart NASDAQ Chart QQQ
Chart
IBB Chart
IWM Chart
Hourly DJI-OBV Hourly-MVM0735
FAS-3x Financials IBB-Biotechs
-----------------------------------------------------------------------------------------------------------------------------------
-->14 -4 MAXCP stocks Bullish MAXCP Stocks (11/7/2014)
--> 394 +58 MINCP stocks Bearish MINCP Stocks (11/7/2014) Bearish
plurality
--> 9 -3 New Highs on NASDAQ
179 +75 new lows.
Bearish plurality
--> 12 -5 New Highs on NYSE 146 +111 new lows.
Bearish plurality
-----------------------------------------------------------------------------------------------------------------------------------
-------------------------------------------------------------------------------------------------------------------------------------------------------
OLDER HOTLINES
-------------------------------------------------------------------------------------------------------------------------------------------------------
10/6/2014 "When the foundation weakens enough,
even the penthouse will
come down."
This Monday's failure to continue Friday's rally suggests there are a lot of big
Sellers who urgently
want out of this market. I don't know why, but
we should fear that
they have good reasons for selling so hurriedly.
A Test of the 3.5% lower band appears likely.
Octobers are notorious
for bringing violent declines: 1929, 1930, 1932,
1933, 1937, 1941,
1957, 1967, 1971, 1973, 1977, 1978, 1979, 1987, 1989,
1997, 2000, 2002 and
2008. We should be careful now. Each of these
years saw a drop of
more than 10% from September to an October low.
Simply knowing this, I
have suggested being fully hedged with
Bearish MINCP short sales.
If IWM and the
Russell-2000 break their well-tested flat support, the sell-off will
surely accelerate.
The presence of so many minor head and shoulders patterns
in IWM's chart is a
bearish warning that there are serious cracks in the
market.
GTAT's sudden bankruptcy today will surely scare some tech
investors. Add to
that: all our measures of internal strength are bearish on the IWM
chart below. Last
but not least, Professionals are selling to the Public.
Sell S9s and S12s Are Not
The Only Peerless Sells We Should Heed.
Though we have not had
any of the Sell S9s or S12s that usually end a bull market,
we certainly have had
plenty of warnings that there might have to be a test
of the lower band, with
perhaps a 33% chance that it will drop even more.
The first warning was
the Sell S17. Though S17s
are only September Sells,
S17s are based on a
concept that we also use with Tiger, namely that big drops in IP21
for stocks are bearish
(Tiger S17) just as big leaps up are bullish. (B17). The
next warning was the
head/shoulders pattern, which showed the DJI was too weak to form a
symmetrical right
shoulder. The third was the relative narrowness of Friday's
rally and the fourth
was the failure of the DJI to follow-through to the upside today,
as usually happens on
rebounds that lead to prices rallies to the upper band.
(See Table 2 below.)
Presently, the Hourly DJI shows that volume was badly
missing on the current
rally. (See Box 2 Below.) The Closing Powers for the key
ETFs are all falling.
Finally, our Tiger Net IDOSC refused to rally on Friday and
fell more deeply into
negative territory today. (See Table 3 below.)
-----------------------------------------------------------------------------------------------------------------------------------
> To Key Index and Leading Stock Charts: DJI, SP-500, etc.
Peerless DJI Chart SPY Chart NASDAQ Chart QQQ
Chart
IBB Chart
IWM Chart
Hourly DJI-OBV Hourly-MVM0735
FAS-3x Financials IBB-Biotechs
-----------------------------------------------------------------------------------------------------------------------------------
-->18 -13 MAXCP stocks Bullish MAXCP Stocks
(11/6/2014)
--> 326 +70 MINCP stocks Bearish MINCP Stocks (11/6/2014) Bearish
plurality
--> 12 -8 New Highs on NASDAQ
72 +28 new lows. Bearish plurality
--> 17 -7 New Highs on NYSE 35-17 new lows.
Bearish plurality
-----------------------------------------------------------------------------------------------------------------------------------
Calling
Major Tops in Stocks and Key ETFS.
Today GTAT "suddenly" filed
for bankruptcy. There
were lots of warnings signs. And we should study these
because they will appear over and over again, as more
and more stocks top out while DJI maintains the
appearance that all is well on Wall Street.
1) Watch for Bearish Head/Shoulders Patterns.
2) Watch for S14s (Institutional Dumping.
3) Watch for S13s (Biggest Closing Power Declines in 65-trading days)
- See also the Tiger Candle-stick charts for BIG RED DAYS
- Especially bearish if they occur as 65-dma is penetrated.
4) Watch for S17s (Big IP21 drops.)
5) Watch for pattern of Closing Power weakness (S7 warnings) and then
break in 65-dma.
6) Watch for Sell S2s (Failures of prices to get past or stay above falling S65-dma)
Example: GTAT - Apple
sapphire supplier GT Advanced files for bankruptcy 10/6/2014
|
BOX 2 - Hourly DJIA
 |
Table
2 below shows that the present (10/3/2014) rebound had a
weaker breadth ratio than
any of the 18 rebounds that
took the DJI back up to the upper band or higher since the
bear market bottom in March
2009. That the next day saw the DJI decline is not inconsistent
with a rally to the upper
band, but it occurred only in 3 of the 18 earlier rebounds.
Table 2
------------ Big DJI Reversals
Following Declines --------
NYSE A/D
DJI Daily
Jumps Next Day
up down Ratio
---------------------------------------------------------------------------------------------------------------------------
10/3/2014 2124 1035
2.05 16801.05 to
17009.69 16991.91
8/8/2014 2397 773
3.10
16368.27 to 16553.93 16569.98
2/6/2014 2345 776
2.02
15440.23 to 15628.53 15974.08
10/10/2013 2557 450
5.68 14702.98
to 15126.07 15237.11
9/9/2013 2464 615
4.01
14922.50 to 15063.12 15191.06
6/25/2013 2493 820
3.04
14659.56 to 14760.31 14910.14
11/19/2012 2696 356
7.57
12588.31 to 12795.96 12788.51 hit 13350.96
6/6/2012 2691 377
7.14
12127.95 to 12414.79 12460.96
10/6/2011 2607 474
5.50
10939.95 to 11123.33 11103.12 hit 12231.11
8/11/2011 2832 228
12.42 10719.94 to
11143.31 11269.02
6/28/2011 2457 605
4.06
12043.56 to 12188.69 12261.42
3/17/2011 2232 819
2.72 11613.3 to
11744.59 11858.52
12/1/2010 2403
676 3.55
11006.02 to 11255.78 11362.41
9/1/2010 2668
431 6.19
10014.72 to 10269.47 10320.1
7/7/2010
2689 447
6.02
9743.62 to 10018.28 10138.99
6/10/2010
2731 405
6.74
9899.25 to 10172.53
10211.07
11/5/2009
2495 537
4.64
9802.14 to 10005.96
10023.42
7/13/2009
2565 498
5.15
8146.52 to 8331.68
8359.49
3/10/2009
2936 225
13.05
6547.05 to 6926.49 6930.40 |
Table 3
Interpreting the Net IDOSC
as A Day-to-Day Predictor of DJIA
The Tiger Net Idosc for the DJI predicts the next day or two in the DJI by
using simple
rules when the DJI appears to be in a trading range or locked
inside its normal
3.5% bands.
You must each day
consider:
(1) whether the Net IDOSC rises or falls from the previous day as the DJI does.
By itself, this suggests that the DJI will continue to move in the same direction
another day. This more reliably predicts a rally the next day if the NID is
positive.
It more reliably predicts a decline the next day if the NID is negative.
(2) whether the Net IDOSC moves in a direction contrary to the daily direction of
the DJI. By itself, this weakly predict the DJI will
reverse directions
on the next day to be of use. In these cases, we need
also to see a negative NID
to predict a decline or a positive NID to predict a rally. A movement by NID
for two or more days that is contrary to the DJI's price movement also predicts
a reversal.
(3) whether the Net IDOSC moves in a direction contrary to the daily direction of
the DJI AND is NEGATIVE when the
DJI advances or is POSITIVE
when the DJI declines. This rule has special force when the DJI has reached
the 1% upper band or higher or the 1% lower band or lower.
(4) A reading of -26 or lower shows an oversold condition and predicts a rally
in a day or two. Oppositely, a reading of +26 or higher shows an overbought
condition and predicts a decline in a day or two.
(5) Do not use these rules when the DJI shows unusual upwards or downwards
momentum.
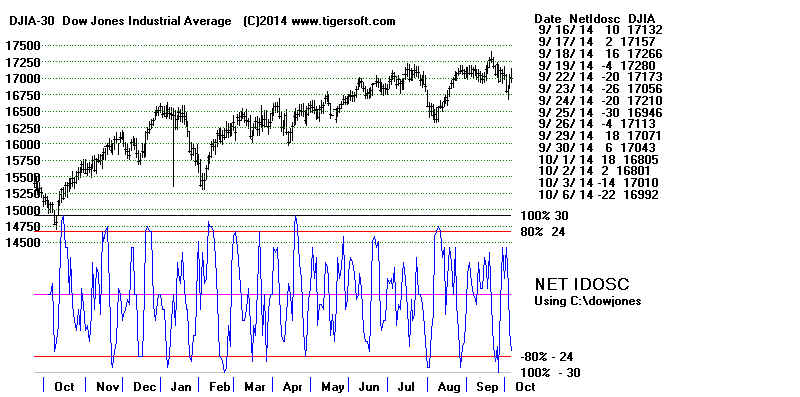
Illustration - Net Idosc from 9/16/2014 to 10/16/2014
11 good predictions of next day.
2 bad predictions of next day.
9/16/2014 17132 + 10
9/17/2014
17157 +2 NID falls but is still
positive. Rule #2
9/18/2014 17266
+16 NID rises. Rally to continue. Rule #1
9/19/2014 17280 -4 Contrary to price rise, NID falls and is negative.
Very bearish. Rule #3
9/22/2014 17173 -20 NID falls and is negative. Decline to
continue. Rule #2
9/23/2014 17056 -26 Oversold bounce predicted. Rule #5
9/24/2014 17210 -20 Contrary to price rise, NID falls and
is negative.
Very bearish. Rule #3
9/25/2014 16946 -30 Oversold bounce predicted. Rule #5
9/26/2014 17113 -4 Contrary to price rise, NID falls and is negative.
Very bearish. Rule #3
9/29/2014 17071 +18
Rally predicted using Rule #3. BAD PREDICTION.
9/30/2014
17043 +6 Falling NID. Decline likely
to continue. Rule #1
10/1/2014 16805
+18 Rally predicted using Rule #3. BAD PREDICTION.
10/2/2014 16801
+2 DJI
falls but NID remains positive. Predicts rally.
10/3/2014
17010 -14 DJI
rallies but NID turns negative. Very bearish. Rule #3
10/6/2014
16992 -22 Falling NID. Decline likely to
continue. Rule #1
|
-------------------------------------------------------------------------------------------------------------------------------------------------------
OLDER HOTLINES
-------------------------------------------------------------------------------------------------------------------------------------------------------
10/3/2014
The rebound Friday will
probably allow the DJI to go back up
to its recent highs. It is doubtful unless breadth and the hourly
up-volume improve from Friday's pace that other indexes will be
able to get back to their peak. Peerless has not given a reversing
Buy signal, but a good rally based on how oversold the Invested MKDS
was at Thursday's close is a 75% probability, I reckon.
Our Stocks' Hotline suggests staying short many of the Bearish
MINCP stocks. But I would cover the most recently shorted
Bearish MINCPs and those down 20% or more in recent decline.
Buy some of MAXCP stocks. IBB looks like the best major
market ETF. Its Closing Power and Relative Strength Lines
are still rising.
The up-trend of the Dollar coupled with the very good Jobs Report should
help the DJI avoid an October Massacre. The strength in the DJI will
continue to camouflage just how weak many other segments of the
market are. Eventually, the NYSE A/D Line's divergence from the
DJI will give us Sell S9s. Right now, the DJI must quickly destroy
its lopsided head/shoulders pattern by getting past 17200. It is not
clear that it will be able to do this.
Can We Trust Friday's Reversal?
We've gotten used to expecting good rallies like Fridays to mean a
major market rally back to new highs. This reversal was on little
more than 2:1 to the upside on the NYSE. But very good breadth
with a 3:1 ratio of NYSE Advances to Declines may still follow.
Since 2009, we have always seen such ratios jump above 3.0 when they
started rallies to the upper band. If a 3:1 ratio does not follow,
I would expect a narrow rally. In addition, the DJI, SP-500,
NASDAQ and QQQ will struggle to make new highs. See Table 1 below.
Become An Expert on Jobs' Reports.
Friday's Job Report was quite bullish. Even though, we
mostly look
at technicals, we should follow the Job Report numbers closely. With
real wages and interest rates holding steady, corporate profits
must be expected to rise when so many non-agricultural workers
are hired, as the Job Report suggests. Follow these numbers
using the tables supplied by the US Dept of Labor. I will post
them here. http://tigersoftware.com/PeerlessStudies/JobsR/index.html
In the Jobs' numbers, we want to take note of the changes up
or down
from the month before and the year before. As you
go over
this data, you will start to see how often the Job Report leads
the stock market. In Feb. 2004 (44), the bull
market's rally ended
for 7 month, only to resume again as the very fine October
2004 (346) Jobs' numbers were released. We got a
Peerless S9
only a few days after the very weak May 2006 (23)
Jobs' Report.
See below the deterioration in 2007, especially in October 2007 (2).
Then in February 2008, the numbers turned negative (-86).
By the Summer, they were terrible. More recently, last
December showed a sharp drop to 84. Small wonder,
Peerless
gave a Sell at the end of the year when the Santa Claus rally
was so weak. The recent weakness may be attributed to
the preliminary August 180 figure.
This was well below the
previous month and the same month a year earlier.
Net Change in US Non Agricultural Employment by Month
(000s)
| Year |
Jan |
Feb |
Mar |
Apr |
May |
Jun |
Jul |
Aug |
Sep |
Oct |
Nov |
Dec |
|
| 2004 |
161 |
44 |
332 |
249 |
307 |
74 |
32 |
132 |
162 |
346 |
65 |
129 |
|
| 2005 |
134 |
239 |
134 |
363 |
175 |
245 |
373 |
196 |
67 |
84 |
337 |
159 |
|
| 2006 |
277 |
315 |
280 |
182 |
23 |
77 |
207 |
184 |
157 |
2 |
210 |
171 |
|
| 2007 |
238 |
88 |
188 |
78 |
144 |
71 |
-33 |
-16 |
85 |
82 |
118 |
97 |
|
| 2008 |
15 |
-86 |
-80 |
-214 |
-182 |
-172 |
-210 |
-259 |
-452 |
-474 |
-765 |
-697 |
|
| 2009 |
-798 |
-701 |
-826 |
-684 |
-354 |
-467 |
-327 |
-216 |
-227 |
-198 |
-6 |
-283 |
|
| 2010 |
18 |
-50 |
156 |
251 |
516 |
-122 |
-61 |
-42 |
-57 |
241 |
137 |
71 |
|
| 2011 |
70 |
168 |
212 |
322 |
102 |
217 |
106 |
122 |
221 |
183 |
164 |
196 |
|
| 2012 |
360 |
226 |
243 |
96 |
110 |
88 |
160 |
150 |
161 |
225 |
203 |
214 |
|
| 2013 |
197 |
280 |
141 |
203 |
199 |
201 |
149 |
202 |
164 |
237 |
274 |
84 |
|
| 2014 |
144 |
222 |
203 |
304 |
229 |
267 |
243 |
180(P) |
248(P) |
|
|
Table 1 shows that the present (10/3/2014) rebound had a weaker breadth ratio than any of
18 rebounds that took the DJI back up to the upper band since the bear market bottom
in March 2009. That the next day saw the DJI decline is not inconsistent with a
rally
to the upper band, but it occurred only in 3 of the 18 earlier rebounds.
Table 1
------------ Big DJI Reversals
Following Declines --------
NYSE NYSE Ratio DJI Daily
Jumps Next Day
up down
10/3/2014 2124 1035
2.05 16801.05 to
17009.69 16991.91
8/8/2014 2397 773
3.10
16368.27 to 16553.93 16569.98
2/6/2014 2345 776
2.02
15440.23 to 15628.53 15974.08
10/10/2013 2557 450
5.68
14702.98 to 15126.07 15237.11
9/9/2013 2464 615
4.01
14922.50 to 15063.12 15191.06
6/25/2013 2493 820
3.04
14659.56 to 14760.31 14910.14
11/19/2012 2696 356
7.57
12588.31 to 12795.96 12788.51 hit 13350.96
6/6/2012 2691 377
7.14
12127.95 to 12414.79 12460.96
10/6/2011 2607 474
5.50
10939.95 to 11123.33 11103.12 hit 12231.11
8/11/2011 2832 228
12.42 10719.94 to
11143.31 11269.02
6/28/2011 2457 605
4.06
12043.56 to 12188.69
12261.42
3/17/2011 2232 819
2.72
11613.3 to
11744.59 11858.52
12/1/2010 2403 676
3.55
11006.02 to 11255.78
11362.41
9/1/2010 2668 431
6.19
10014.72 to 10269.47 10320.1
7/7/2010
2689 447 6.02
9743.62 to 10018.28
10138.99
6/10/2010 2731 405
6.74
9899.25 to 10172.53
10211.07
11/5/2009 2495 537
4.64
9802.14 to 10005.96
10023.42
7/13/2009 2565 498
5.15
8146.52 to 8331.68
8359.49
3/10/2009 2936 225
13.05
6547.05 to 6926.49 6930.40 |
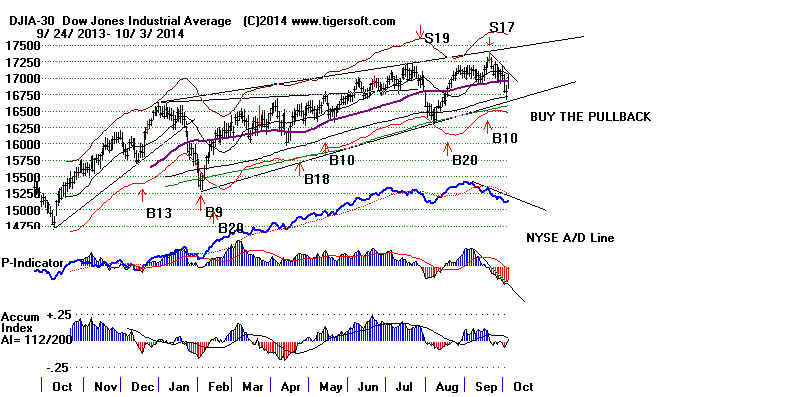
Watch The Breadth Indicators
for the Broader Market.
There is no new Peerless Buy signal, despite the big jumps in
in the DJI from its uptrend, in the SP-500
or SPY from their rising 30-week
(149-day ma)) or the Russell-2000 from its well-tested
support.
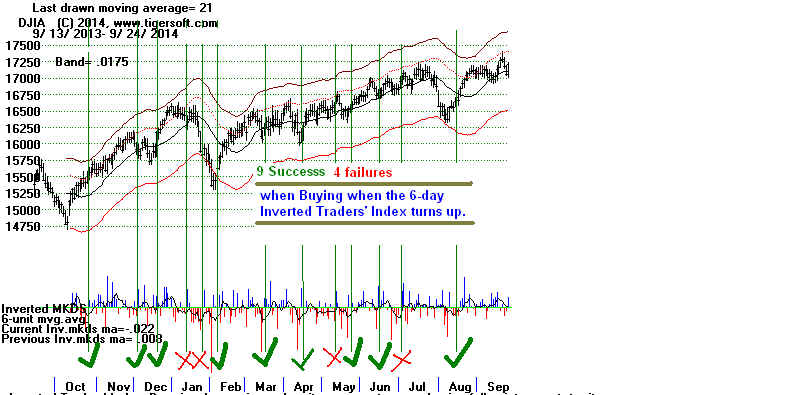
A good trading bounce does, however, occur 75% of the time
since 2009 when the 6-day ma of the Tiger Inverted Traders Index
reaches a deeply oversold condition, such as occurred on Thursday
night.
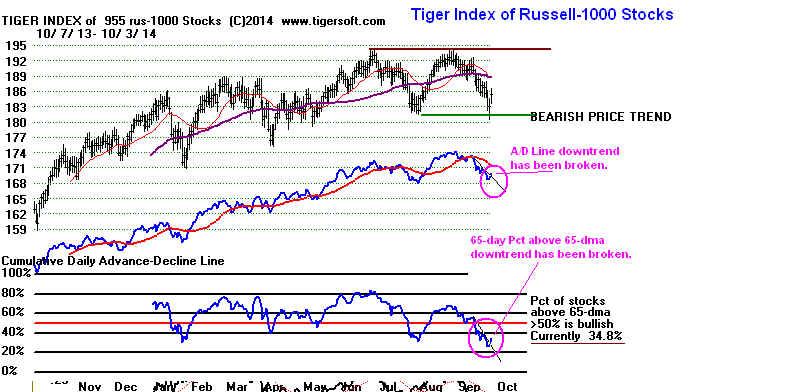
The problem now for the bulls is that the recovery must extend to
stocks other than blue chips and defensive stocks. One way we may
watch to see if the recovery broadens is to watch IWM. See below
how the key breadth downtrends for the Russell-1000 have been
slightly broken. These are its A/D Line and the Pct above 65-dma.
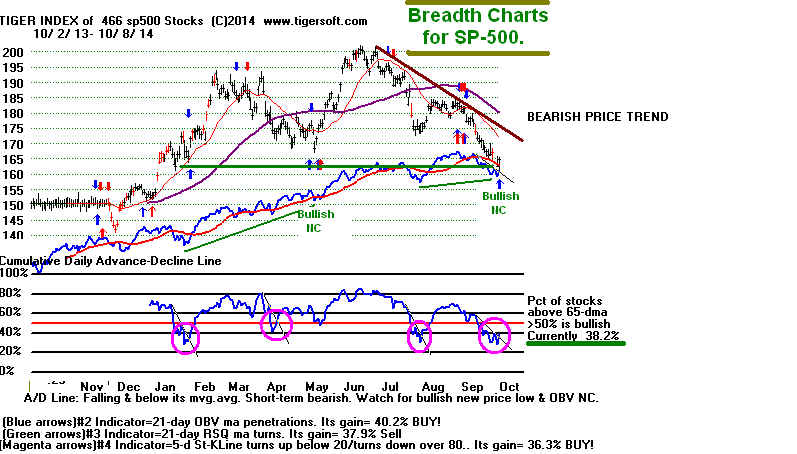
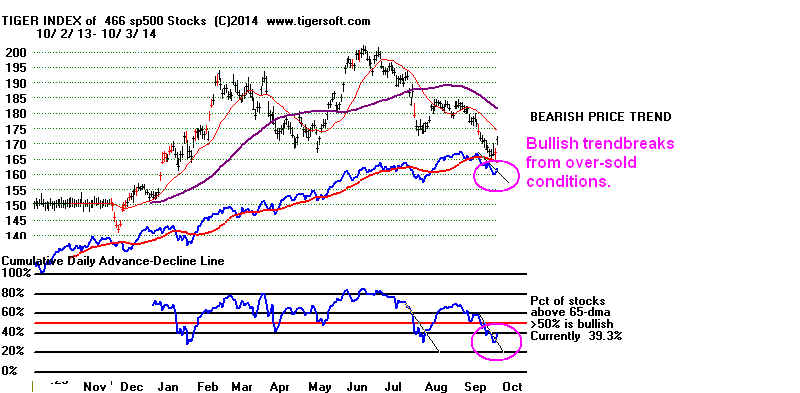
The same thing is true for the SP-500 stocks. See this in the second
chart below.
-----------------------------------------------------------------------------------------------------------------------------------
> To Key Index and Leading Stock Charts: DJI, SP-500, etc.
Peerless DJI Chart SPY Chart NASDAQ Chart QQQ
Chart
IBB Chart
IWM Chart
Hourly DJI-OBV Hourly-MVM0735
FAS-3x Financials IBB-Biotechs
-----------------------------------------------------------------------------------------------------------------------------------
-->31 +10 MAXCP stocks Bullish MAXCP Stocks (11/3/2014)
--> 256 -95 MINCP stocks Bearish MINCP Stocks (11/3/2014) Bearish
plurality
--> 20 +4 New Highs on NASDAQ
34 -33 new lows. Bearish plurality
--> 24 +19
New Highs on NYSE 52-28 new lows.
Bearish plurality
-----------------------------------------------------------------------------------------------------------------------------------
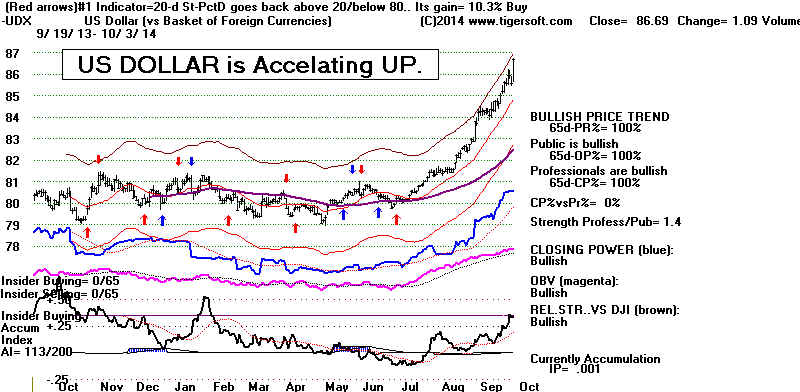
The Strong Dollar Plays Favorites
The Big Banks love the stronger Dollar. JPM and GS reflect that
in the DJI-30. The Dollar's advance buttresses New York's
position as the center of international finance. It brings in the money
of the very Rich from overseas to make investments that are Dollar
denominated. Banks, blue chips and bonds are biggest beneficiaries.
Meanwhile, foreign ETFs are likely to drop even further.
But the DJI's strength will not lift all stocks, especially
those
being hurt by the advance of the Dollar, most notably the
weakest MINCP stocks, especially those in Natural
Resources,
Foods, Gold, Silver and Coal. Oil as a commodity looks better internally,
but the great strength in the Dollar will likely continue to suppress
oil and gas stocks, too. This will help Transportation stocks just
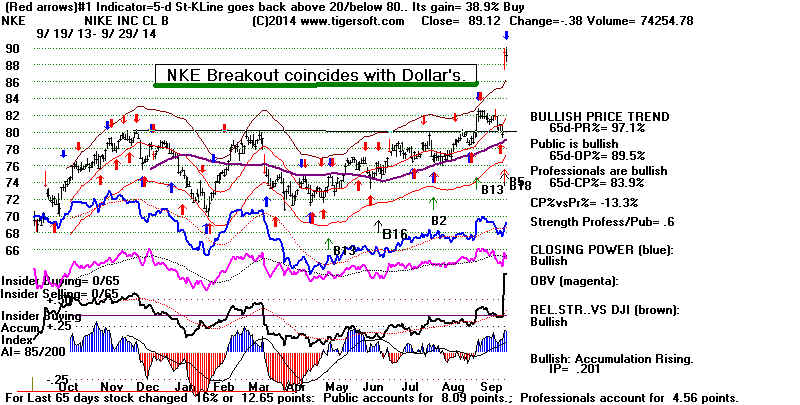
as the Rising Dollar helps importers, like WMT, HD and NKE
in the DJI and may hurt CAT and BA,
as manufacturing exporters.
Many of our Bearish MINCP short sales continued to plunge
despite Friday's recovery. As long as their Closing Powers
are falling, we will stay short them.
More DJI stocks benefit than are hurt by the stronger Dollar,
as long as Deflation, Over-Production and Under-Consumption
don't bring a Depression, as in the 1920s. Traders will want to
buy the DJI stocks mentioned above when their Closing Powers
break downtrend-lines.
------------------------------------------------------------------------------------------------------------------------------------------------------
OLDER HOTLINES
-------------------------------------------------------------------------------------------------------------------------------------------------------
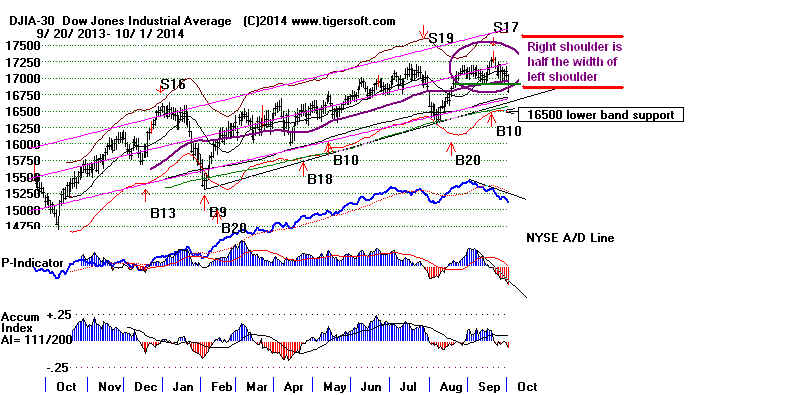
10/2/2014
The new Peerless Sell S17 and the half-sized right
shoulder H/S pattern
argue that there will be more new lows, and no reliable bottom probably
until the DJI reaches the lower band or quite possibly not until another
month has passed. The percentage of all stocks below their 65-dma did
improve today, but this statistic is in a downtrend for all the larger
groups of stock, other than DJI-30 and Bonds. See today's
65-day ma Percent Data.
Foreign ETFs remain very weak. This
suggests a world-wide economic slow-down, which helps make Deflation
a much bigger risk than Inflation.
Today Japan announced that they would start supporting the Yen.
This
hurt Japanese car exporting firms' stocks. It also finally stopped the
Dollar's rally. This may put a new dynamic in the
market. So, too would some
new liberal assurances by the Fed tomorrow after the the Jobs Report
is released. But right now, all the trendslines point downward.
-----------------------------------------------------------------------------------------------------------------------------------
> To Key Index and Leading Stock Charts: DJI, SP-500, etc.
Peerless DJI Chart SPY Chart NASDAQ Chart QQQ
Chart
IBB Chart
IWM Chart
Hourly DJI-OBV Hourly-MVM0735
FAS-3x Financials IBB-Biotechs
-----------------------------------------------------------------------------------------------------------------------------------
-->21 +5 MAXCP stocks Bullish MAXCP Stocks (11/2/2014)
--> 351 MINCP stocks Bearish MINCP Stocks (11/2/2014) Bearish
plurality
--> 16 +9 New Highs on NASDAQ
67 new lows. Bearish plurality
--> 5 New Highs on NYSE 80 new lows.
Bearish plurality
-----------------------------------------------------------------------------------------------------------------------------------
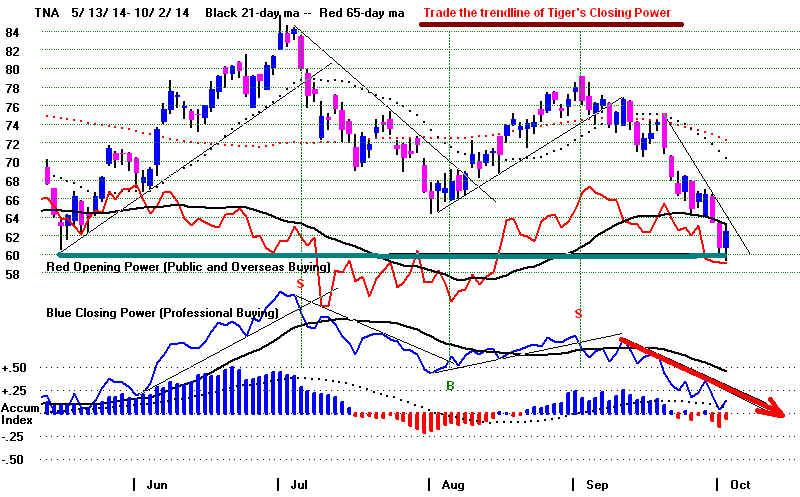
When Peerless Shifts To A Sell,
Sell Short the weakest ETFand/or a handful of the
most Bearish MINCP stocks.
Then sit back and relax and wait for the Closing Power downtrends
to be broken, even when the stock you have shorted has fallen 30%
or more in a few weeks or days.
By watching the Closing Powers and heeding their trend changes we should
be able to stay in tune with the best trends the market gives us to trade. With a
Peerless Sell signal, we want to switch to shorting the weakest major market
ETF where its Closing Power is already in a downtrend or else where
a Closing Power trend has just been broken.
Then we wait. We simply let Professionals tell us when to cover. When they
switch
and become significant buyers, the Closing Power downtrend will be broken.
This is when we should cover. Sometimes, it's a little late or early. But
seeking perfection will only lead to frustration and losses in the market.
The breaks in the ETFs' Closing Power will also tell us about the state
of the general market and which direction it will probably take.
In our case now, we want to be looking at the charts of, IWM or TNA
(the 3x leveraged IWM). They have a three or four times tested flat support
that now has been reached. A rally back upwards would become very likely
if the Closing Powers break their uptrends. At that point, it is not safe to
stay short.
Weak Stocks Go Down A Lot Faster and Further
Than The Weakest ETFs
The same Closing Power rules apply to the Bearish MINCP stocks we pick
to hedge. Our 2x-3x/week Tiger Stocks' Hotline will be watching the
Closing Power downtrends in the stocks we shorted.
If the stock has fallen a long ways down, we should work with steep Closing
Power downtrends.
Below are the charts for the biggest gaining short sales for the past few weeks.
They represent about half the stocks chosen to sell short. Many of these gains
were excellent. I present them to try to convince some of you to consider
selling short our Bearish MINCP stocks, especially when they look as ugly
as these did when we shorted them. As you can see our timing was, by no
means perfect. But they kept falling. This is because both Professionals and
Insiders were heavy sellers. This is the beauty of the nightly "Bearish
MINCP"
stocks. It makes shifting to an increasingly net short position is very easy
when hedging. I think it would be a strategic mistake not to take
advantage
of this simple and effective Tiger shorting strategy.
Recent Stock Hotline Short Sales
====================================================================================
OLDER HOTLINES
====================================================================================
10/1/2014
Lower Prices Are Expected.
The DJI's completed head and
shoulders pattern adds to the bearishness and predicts that
a bottom may be 5 to 8 weeks away.
Today the DJI fell through the neckline in a head and shoulder pattern.
This H/S pattern features a half-sized right shoulder. Its right shoulder
is less than half the duration of its left shoulder. This suggests the market
was too weak to even complete a symmetrical head/shoulders pattern.
The history of such patterns is distinctly bearish. Bottoms are not made
for 3 to 8 weeks. Such patterns in September are particularly bearish.
in 6 of the 9 cases, the DJI fall more than 8%. This new information
adds to my own bearishness. It calls for more short selling and holding
fewer long positions. Our Bearish MINCP stock
shorts all are in various
stages of panic now. Institutions and insiders are dumping them across
the board. Look for multiple Tiger Sell S14s now.
Keep in mind that our theory is that head and shoulders patterns
reflect
some new bearish information has surprised Wall Street and stock
prices must quickly make downward adjustments.
DJI Head/Shoulders with "Half-Sized" Right Shoulders
9/19/1930 229 to 174 in 6 weeks.
-24.1%
7/21/1944 146.8 to 142.9 in
7 weeks. -2.7%
6/26/1950 213.9 to 187.5 in
3 weeks. -12.3%
5/18/1951 250.1 to 242.6 in
6 weeks. -3.0%
5/21/1965 922 to 840 in 5
weeks. -8.9%
9/22/1971
894.55 to 797.97 in 8 weeks. -10.8%
9/1/1987
2610.97 to 1738.74 in 7 weeks. -33.4%
8/3/1990 2809.65 to 2365.10
in 8 weeks. -15.8%
5/18/2006 11128.29 to
10706.14 in 4 weeks 3.8%
Less than 25% of all stocks are above their 65-dma; the key ETFs'
Closing Powers made minor news and are downtrending; the NYSE
A/D Line is falling and we are operating under the new Peerless Sell S17,
which in all 4 of its previous cases brought a DJI decline down to the
3% lower band. The DJI made a 30-day low. Because the duration of
the right shoulder above 16900 was only 4 or 5 days, the pattern is
far from being a perfect head/shoulders pattern.
The percentage of Russell-1000 stocks below their 65-dma is now
26.1%. This is the lowest percentage this year.
Without a new Peerless Buy signal, a break in the A/D Line
downtrend or the Closing Power downtrends, Id suggest waiting
and seeing if there will be more weakness. The ETF for the
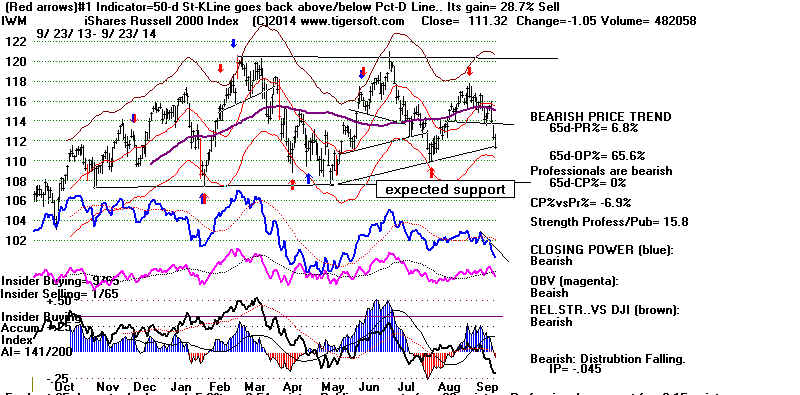
Russell-2000 has now fallen to a support level that has held on
four previous tests over the last 12 months. We should watch
this Index to see if the small caps as well as the Foreign ETFs
lead the market, including the DJI, SP-500 and NASDAQ still
lower.
-----------------------------------------------------------------------------------------------------------------------------------
> To Key Index and Leading Stock Charts: DJI, SP-500, etc.
Peerless DJI Chart SPY Chart NASDAQ Chart QQQ
Chart
IBB Chart
IWM Chart
Hourly DJI-OBV Hourly-MVM0735
FAS-3x Financials IBB-Biotechs
-----------------------------------------------------------------------------------------------------------------------------------
-->16 -27 MAXCP stocks Bullish MAXCP Stocks (too few)
--> 494 MINCP stocks Bearish MINCP Stocks (11/1/2014) Bearish
plurality
--> 7 -16 New Highs on NASDAQ
171 new lows. Bearish plurality
--> 5 -12 New Highs on NYSE 184 new lows.
Bearish plurality
-----------------------------------------------------------------------------------------------------------------------------------
-------------------------------------------------------------------------------------------------------------------------------------------------------
OLDER HOTLINES
-------------------------------------------------------------------------------------------------------------------------------------------------------
10/1/2014 70% of all stocks are below their 65-dma. I believe we have
weakening market conditions that seem consistent with
the Sell S17 , the declining A/D Line and the still falling Pcts. of
Stocks above their 65-dma. Time Warner Cable's internet
service was out from 5PM to 3:AM. They should have problem
fixed soon.
-------------------------------------------------------------------------------------------------------------------------------------------------------
9/29/2014
The new Peerless Sell S17
still warns us that the 65-dma support may
still breakdown for the DJI. But today's reversal was impressive. So, a
retest of 17150-17200 seems likely. The Closing Powers are still caught
in extended trading ranges. There still are more than 70% of all stocks below
their 65-dma. Down volume was proportionately still higher than up volume.
The NYSE A/D Line is still in a downtrend. And if the DJI does stall out
at the upper 1.75% upper band, it would look more and more like a bearish
head/shoulders pattern.

-----------------------------------------------------------------------------------------------------------------------------------
> To Key Index and Leading Stock Charts: DJI, SP-500, etc.
Peerless DJI Chart SPY Chart NASDAQ Chart QQQ
Chart
IBB Chart
IWM Chart
Hourly DJI-OBV Hourly-MVM0735
FAS-3x Financials IBB-Biotechs
-----------------------------------------------------------------------------------------------------------------------------------
-->43 +30 MAXCP stocks Bullish MAXCP Stocks (9/29/2014)
--> 117 -120 MINCP stocks Bearish MINCP Stocks (9/29/2014) Bearish
plurality
--> 23 -3 New Highs on NASDAQ
58 +9 new lows.
Bearish plurality
--> 17 -1 New Highs on NYSE 88 +43 new lows. Bearish
plurality
-----------------------------------------------------------------------------------------------------------------------------------
Schizophenia Is Not Usually A Constructive Condition.
This remains a market of multiple personalities. A
handful of breakouts get the
bulls' full attention and money, just as bears remain happy driving the weakest
MINCP stocks still lower. Adding to the schizoid
aspect of the market
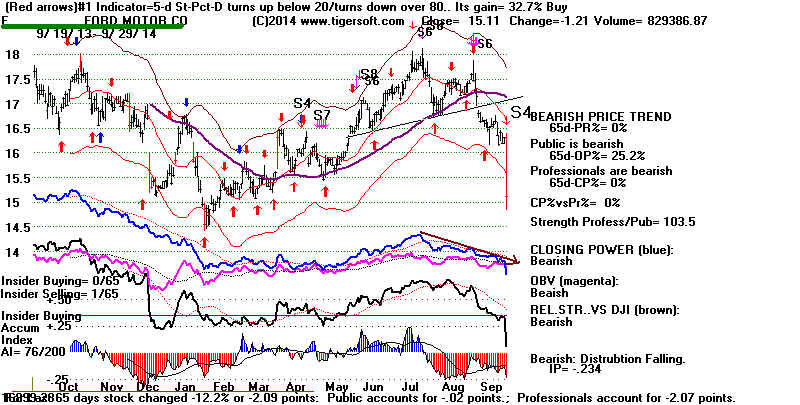
is how the rising dollar helps and hurts different stocks. US manufacturers
like Ford are getting hit hard, but retailers like Nike love how much cheaper their
imports are. I fault both the President and the Congress for neglecting
what's left of American manufacturing. Since neither the Dems nor the Republicans
take up trade issues, nothing is present now to prevent the divide between
US manufactures and US importers from getting still bigger.
 |
 |
I also don't see any reason why the market's internal chasms will dimminish anymore
than will the Grand Canyon sized class chasms that reduce consumer buying
power but have sent many stocks soaring. Meanwhile, the DJI is the
third personality here. Its narrow price range might mislead a casual onlooker
into thinking that all is calm and quiet in the US or in the world of international
finance,
but the collapse of Foreign ETFs is a warning. In 1929, the DJI was the
last to peak.
The DJI is stuck in an unusually narrow trading range between 16880 and 17300.
Watching the Hourly DJI bounce around reminds me of a
ping-pong game between equally
matched players. This can be entertaining and profitable, however. See below
how
our Net Idosc program run against the 30-DJI stocks can make this narrow trading
much more interesting.
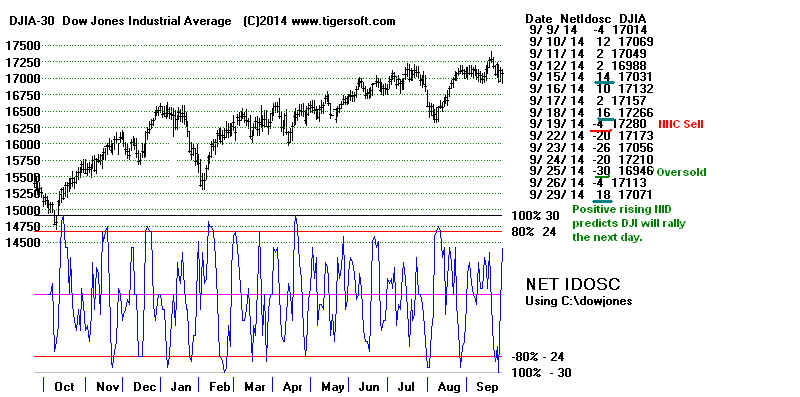
Daily Net Idosc on DJI-30
The Tiger Net Idosc (NID) oscillator here has a maximum oversold reading of -30
and overbought reading of +30 when applied to the DJI-30. New highs with
negative Net Idosc readings are bearish. New lows with a positive Net Idosc
are bullish. Watch also how changes of day-to-day direction usually lead price
movements, upwards if NID is positive and downwards if NID is negative.
This indicator works best when the market trades relatively narrowly. I will start
posting it with the other graphs each night.
===================================================================================
OLDER HOTLINES
===================================================================================
9/26/2014
The new Peerless Sell S17
still warns us that Friday's 168 point rally does not prove
that the 65-dma will hold. In fact, the DJI may even
be forming a reversing
and bearish head/shoulders pattern. The 2007 Peerless gave a Sell, too,
based on the A/D Line NC. Right now the NYSE A/D Line
is still
downtrending. None of the Closing Power trends of the key major market
ETFs line is rising. (See SPY, DIA,
QQQ and IWM.) The 6-day Inverted Traders'
Index did turn up, but not visibly.
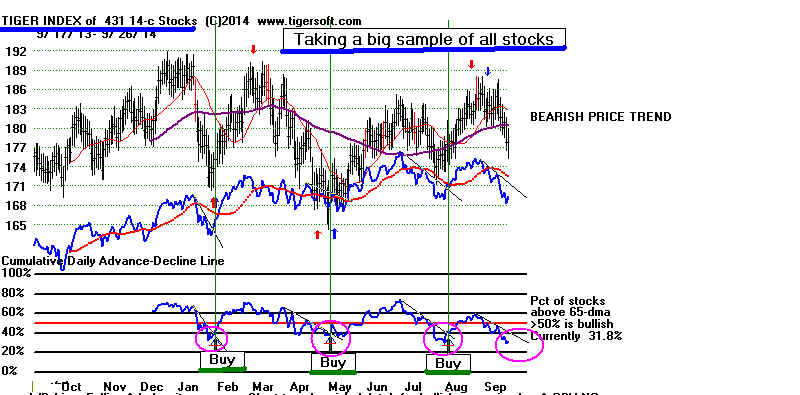
The broad market is still much weaker than the DJI or the SP-500.
Our data still show that less than 30% of
all the A-Z stocks are above their 65-dma.
And, very important, the A/D Lines for these A-Z directories are all still falling.
See the 14-C stocks' A/D Line further below. The downtrends of the Percent of stocks
above the 65-dma are still intact for all the A-Z directories. Their numbers
are still low, so we have no assurance that a bottom has been made. This
data also shows that Friday's recovery did not generally bring improvements
above levels of a week ago.
Compare the current Over 65-day Percent Line with those earlier this year and
those in 2009, 2010, 2011, 2012 and 2013 for the sampled C-stocks. This letter's
stocks are believed to be representaive, not special. It was simply chosen
because it has more than 400 stocks in it and so is a large sample.
Can The Rally Continue?
Volume was lower on Friday's turn-around than on the day before. But
Nike's good earnings go to show that there's still plenty of life left in blue
chips reporting good earnings. As long as earnings are rising, bull markets
like this tend to keep rising. See a new study I
found on earnings and market tops.
See how earnings peaked before the 1990, 2000 and 2007 tops. Earnings
are still rising now.
It does seem that the Republicans may win big in the mid-term elections. This would
almost certainly bring a celebration on Wall Street. In turn, this could give
bull market a chance to make a strong start in the normally bullish third
year in the 4-year Presidential cycle.
But right now, the NYSE A/D Line is still downtrending. It's risky to fight
a Peerless Sell signal when the Closing Powers and the A/D Line are falling.
Our stocks' Hotline remains hedged. Let's be patient here.
-----------------------------------------------------------------------------------------------------------------------------------
> To Key Index and Leading Stock Charts: DJI, SP-500, etc.
Peerless DJI Chart SPY Chart NASDAQ Chart QQQ
Chart
IBB Chart
IWM Chart
Hourly DJI-OBV Hourly-MVM0735
FAS-3x Financials IBB-Biotechs
-----------------------------------------------------------------------------------------------------------------------------------
-->13
MAXCP stocks Bullish
MAXCP Stocks (9/26/2014)
--> 239 +22
MINCP stocks Bearish MINCP Stocks (9/26/2014) Bearish
plurality
--> 26 +12 New Highs on NASDAQ
49 -9 new lows. Bearish plurality
--> 18 +2 New Highs on NYSE 45 -14 new lows.
Bearish plurality
-----------------------------------------------------------------------------------------------------------------------------------
-------------------------------------------------------------------------------------------------------------------------------------------------------
OLDER HOTLINES
-------------------------------------------------------------------------------------------------------------------------------------------------------
9/25/2014
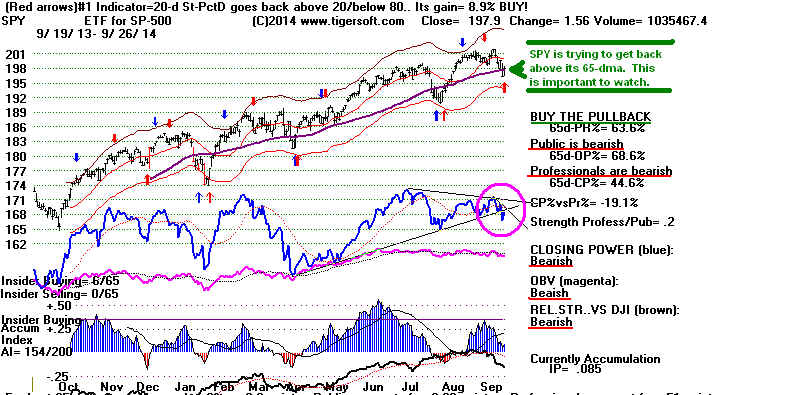
The new Sell S17 seems to be working.
The DJI has now
reached its rising 65-dma. If this mvg.avg. were likely to
bring a good rally, Peerless would have issued a Buy B11.
A bounce from the oversold condition is likely, but it may
only produce a right shoulder in a DJI head and shoulders'
pattern. Note that the SP-500 did break its 65-dma and
SPY's Closing Power has decisively broken its uptrend
and so its CP is considered in a bearish downtrend. Less
than 40% of the SP-500 stocks are
above their 65-dma
Selling
on Rosh Hashanah and Buying on Yom Kippur is
generally a very good strategy when the high holidays begin
between September 20th and September 26th.
DJI
1971 -2.7%
1976 -3.1%
1979 -2.3%
1987 + 2.1
1990 -4.1%
1995 -0.5%
1998 -0.7%
2006 +1.4%
The Broader Market Worsened
Compared to Two Days Ago.
We have reached over-sold territory according to our 6-day
inverted traders Index but all the key internal strength indicators
for the DJI are still declining. What is worse? Only 27%
of all the stocks that we follow
are above their 65-dma. The DJI
will have a hard time holding up when almost all the sectors we
follow now have a majority of stocks below their 65-dma.
There are some remaining pockets of strength. If they cave in,
only very quick action by the Fed can hold up the market.
Our Hotline will suggest doing more selling and shorting tonight.
Our existing short sales should just be held.
Note the Falling Internal Strength Indicators.


The Institutional Dumping
Has Started To Include The Blue Chips.
I warned that there were mounting signs of instutional dumping
as well as professional shorting. Institutions and traders did not
even give Wednesday's 0.9% rally any chance to continue higher.
They started unloading shares right from today's beginning.
Why are they in such a hurry to get out of the market?
What do they know that has not yet become public knowledge?
Has the Fed leaked to the big bankers and their friends that
it plans to wait and watch more numbers come in before providing
any more stimulus?
With the bull market now 5 years and 6 months old, a lot of folks
simply do not want to take a chance, especially since 74.8% of all the stocks
we track are now below their 65-dma. Personally, I fear Deflation and a Fed
that has no more ammunition to fight off a severe recession
a lot more than I fear the Russians or even ISIS.
If the DJI rallies with little company except the "BigFidel", the Big Bios
and some big soda pop companies, it will only be postponing a much
bigger decline.
-----------------------------------------------------------------------------------------------------------------------------------
> To Key Index and Leading Stock Charts: DJI, SP-500, etc.
Peerless DJI Chart SPY Chart NASDAQ Chart QQQ
Chart
IBB Chart
IWM Chart
Hourly DJI-OBV Hourly-MVM0735
FAS-3x Financials IBB-Biotechs
-----------------------------------------------------------------------------------------------------------------------------------
-->10 -14 MAXCP stocks Bullish MAXCP Stocks (9/25/2014)
This is a a market environment in which professionals remain very nervous.
--> 351 +134
MINCP stocks Bearish MINCP Stocks (9/25/2014) Bearish
plurality
--> 10 -4 New Highs on NASDAQ
91 +33 new lows. Bearish plurality
--> 7 -9 New Highs on NYSE 125 +66 new lows. Bearish plurality
-----------------------------------------------------------------------------------------------------------------------------------
Two-Day Dow Reversal Down.
Back in the Summer of 2008, I back-tested worse two day reversals'
statistics than we just saw and came up with the Sell S13. This turned
out to be a signal that would appear in super bear markets, 1929-1932
or in the very steep declines of 1987 and 2008-9.
What happens after a two-day reversal like we have just seen
where the statistics are not so extreme and are similar to what we
have just seen. I searched for all the cases where the DJI rose .9%
on the first day and fell more than 1.5% on the second day. In addition,
the first day had to have a breadth (NYSE advances/declines) ratio of
1.45 or moreand the second day had to have a breadth ratio of .25 or
lower. As the DJI closed today .9% below the 21-day ma, I also
screened out all cases where the LA/MA was below .974 or above 1.1.
The study came up with 12 cases where the market had had such a
two-day reversal. In 8 cases a short seller would have made money
selling short but in 4 instances he would have lost. In Septembers,
bear market declines followed the type of two day reversal we
have just seen. The IP21 (current Accummulation Index) now
stands at a moderately negative -.035. There were 5 two-day
reversals with the IP21 between -.001 and -.05. In 3 instandes
the trader would have made money selling short and in two
cases, he would have lost money.
Date
LA/MA IP21 Result
9/25/2014 .991
-.035
(Good = tradeable decline, Bad = market rallied significantly.)
-----------------------------------------------------------
5/13/1929 .999 -.099 316.5 to 293.4 good
11/27/1933 1.005 -.025 95.8 to 103.39
bad
3/12/1936 .995 -.037
153.1 to 150.4 and then up bad
11/6/1944 .997 +.042 168.9 to 163.6 LB good
11/6/1980 .988 -.278 935.41 to 932.42 to 1000 bad
11/1/2007 .978 +.021 13567.87 to 12743.44 good
9/9/2008 .977 -.049 11230.73 to 8451.19 good
9/22/2008 .974 +.061 11015.69 to 8451.19 good
10/30/2009 .984 +.045 9712.73 rose immediately bad
(rose on successful testing of 65-dma)
5/4/2010 .988 +.045 10926.77 to 9816.49 good
6/1/2011 .979 -.033 12290.14 to 11897.27 good
9/28/2011 .981 -.002 11010.9 to 10655.3 good
-------------------------------------------------------------------------------------------------------------------------------------------------------
OLDER HOTLINES
9/24/2014
A Tale of Two
Markets and Two Programs. Peerless predicts the DJI,
but can warn of the troubles we now see in the broader market. TigerSoft
can focus on finding the weakest stocks to short now, just as
it picked the strongest not too long ago.
Internals remain weak, despite the DJI rally. Keen resistance should
be expected at 17300-17350 unless breadth and volume improve
markedly. ETF traders may want to consider the operative Peerless
signal to be the new Sell S17, but with only 3 previous cases, I
would not be surprised if the leading ETFs rallies continue somewhat
higher. That is why I would watch the Closing Powers.
My general suggestion is for ETF traders to pick the strongest/weakest
ETF for longs/shorts with the highest volatility they are comfortable with and
use the Closing Power trends. The
gains with FAS and IBB for the last
year are about 50%!
Right now, only IBB has made a Closing Power
new high. IWM is still in a downtrend. The
Closing Powers for DIA, SPY
and FAS remain locked in narrowing triangles.
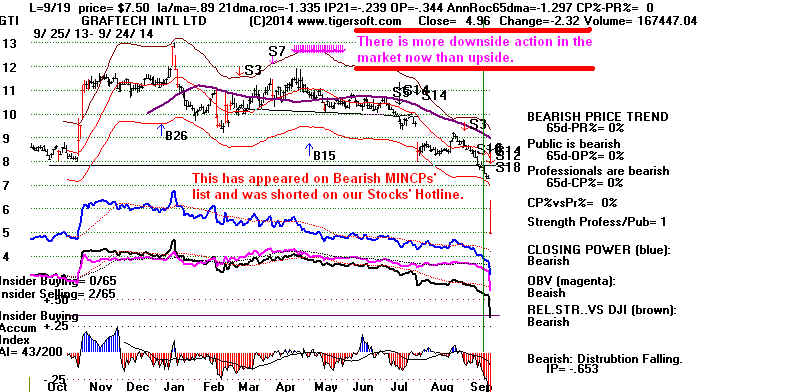
The Broader Market Remains Very Weak
The Bearish MINCP stocks far outnumber the Bullish MAXCP stocks.
Professionals did not rush to cover these heavily shorted
stocks. Less than 35% of
all stocks are above their 65-dma. More
and more stocks are being "dumped" by institutions. We can
define dumping as having a series of Tiger Sell S14s. This signifies
a big jump in down-day volume. More and more stocks show
steady red distribution, as defined by an AI/200 score below 70.
More and more lesser known stocks look GTI below. Here's
how we found this stock to short a few days
ago.
-----------------------------------------------------------------------------------------------------------------------------------
> To Key Index and Leading Stock Charts: DJI, SP-500, etc.
Peerless DJI Chart SPY Chart NASDAQ Chart QQQ
Chart
IBB Chart
IWM Chart
Hourly DJI-OBV Hourly-MVM0735
FAS-3x Financials IBB-Biotechs
-----------------------------------------------------------------------------------------------------------------------------------
-->24 +12 MAXCP stocks Bullish MAXCP Stocks (9/24/2014)
This is a a market environment in which professionals remain very nervous.
--> 217 -125
MINCP stocks Bearish MINCP Stocks (9/24/2014) Bearish
plurality
--> 14 +2 New Highs on NASDAQ
58 new lows. Bearish plurality
--> 16 +7 New Highs on NYSE 59 -58 new lows. Bearish plurality
-----------------------------------------------------------------------------------------------------------------------------------
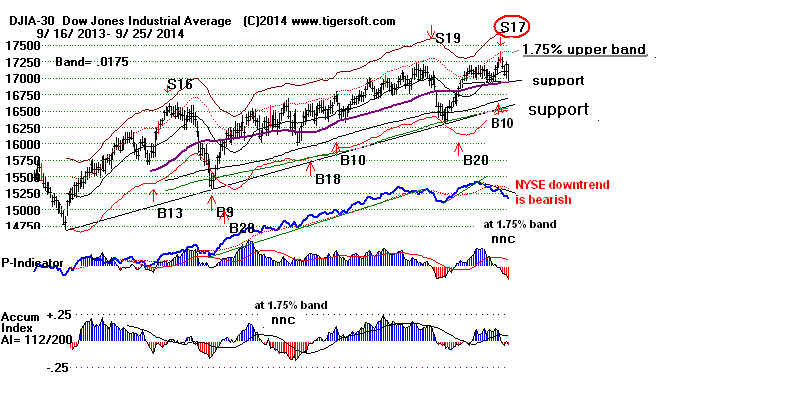
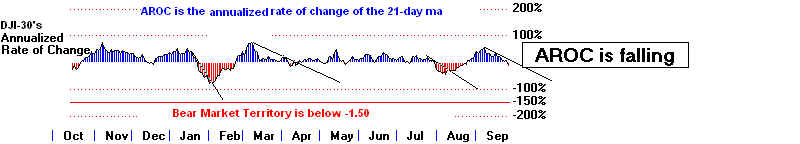
DJI's Technicals
Today's relief rally has take the DJI up to within 101 points of its
previous hourly DJI high. Expect resistance to become significant
at the DJI's 1.75% band. We've seen the DJI's upside volatility
narrow in the last year or two. When the 21-day ma ROC (annualized
rate of change has been below 52%, there is a strong likelihood that
computerized programmed Sell programs will kick in and stop the
DJI's rally when its hypothetical reaches 1.75%. See the chart
below.
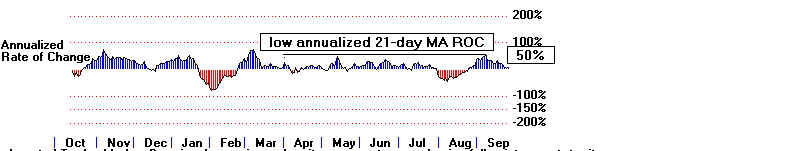
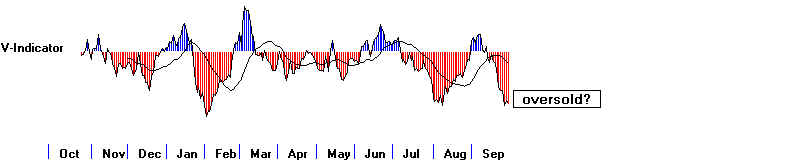
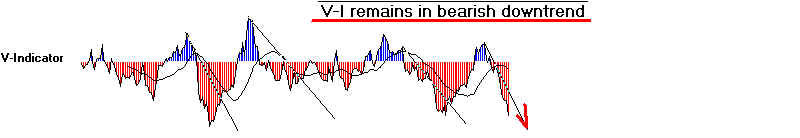
The narrowing upside volatility away from the 21-day ma
prevents Peerless from giving its usual good sell signals
at the 2.2%-3.5% upper bands when the P-I, IP21 or V-I
are negative or nearly so.
This is an important reason why trading ETFs with the
Peerless Sell signals has become much less profitable
than in the past. We can remedy this by:
(1) carefully choosing the best ETFs for the trend we expect,
(2) using Closing Power trend changes,
(3) watching for big "red popsicles" on the ETFs' Tiger candle-stick charts,
(4) using bands about half the width we would ordinarily use and
(5) watching the 6-day Tiger Inverted Traders' Index for turns upward
when it is below 0 for good short-term buys on tests of support,
the 21-day ma and the normal lower bands.
See a new study today:
Trading ETFs with Peerless and Tiger
in The Current Market Environment.
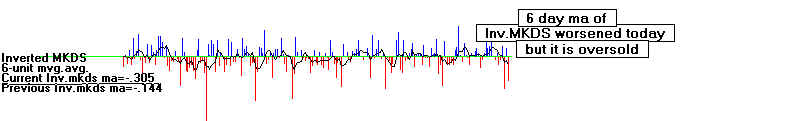
On sell-offs, watch the Peerless 6-day Traders' Index (MKDS)
for turns up at the 21-day ma and at other support
levels from a negative (oversold) condition. Interestingly,
today's rally did not come with any improvement in the
inverted MKDS. Down volume did not decrease today
relative to the ratio of declines to advances on the NYSE.
====================================================================================
OLDER
HOTLINES
9/23/2014
After a brief relief rally, another 3% to
4% DJI decline is likely. It is not
clear that the DJI will be able to stay above its rising 65-dma at 16950, about
105 points lower. Secondary stocks continue to sell off. Stay hedged,
with some of the Bearish MINCPs and avoid holding long positions that
break their 65-dma after forming head/shoulders, or show accompanying
negative IP21s or negative Closing Power% - Price%. Be particularly
wary of breakdowns when the stock shows big red popsicles using
Tiger's candle-stick charts, ones that are larger than any blue bar
for a long time. (See yesterday's hotline for examples.)
-----------------------------------------------------------------------------------------------------------------------------------
> To Key Index and Leading Stock Charts: DJI, SP-500, etc.
Peerless DJI Chart SPY Chart NASDAQ Chart QQQ
Chart
IBB Chart
IWM Chart
Hourly DJI-OBV Hourly-MVM0735
FAS-3x Financials IBB-Biotechs
-----------------------------------------------------------------------------------------------------------------------------------
-->12 -6 MAXCP stocks Bullish MAXCP Stocks (9/23/2014) This is a a market environment
that professionals are very nervous in. Their buying is much curtailed despite the
weakness..
--> 342 +24
MINCP stocks Bearish MINCP Stocks (9/23/2014) Bearish
plurality
--> 12 New Highs on NASDAQ
92 new lows. Bearish plurality
--> 9 New Highs on NYSE 117 new lows. Bearish plurality
-----------------------------------------------------------------------------------------------------------------------------------
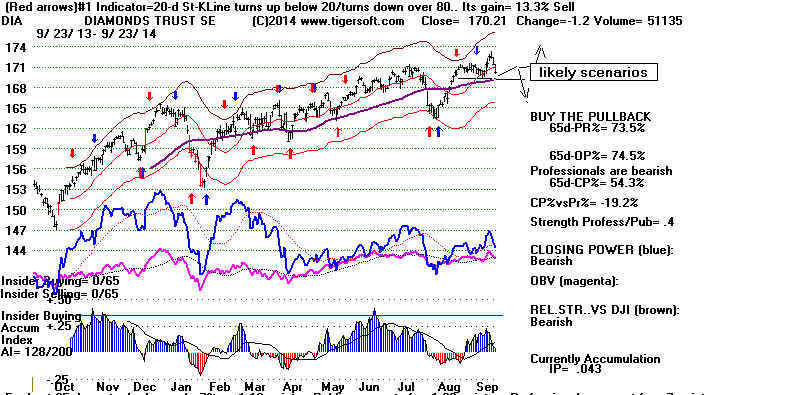
DIA's Closing Power's uptrend has been violated following a non-confirmation. We may
see the DIA rally up to a potential right shoulder in a new head/shoulders pattern.
IWM is much weaker. Its Closing Power has made new lows and must plumb,
I think, lower for support.
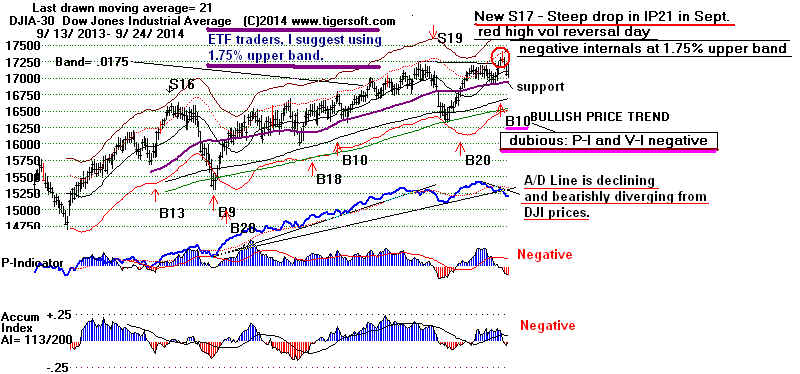
The DJI's Technicals
The DJI has failed the 17200 breakout. This does not come as much
of a surprise. There are no previous cases where a Buy B10 has occurred with
both the P-I and V-I negative on the breakout. Probably the Buy B10
should be changed to disallow such cases.
With or without a Buy B10. false breakouts above well-tested flat tops
are relatively rare. Usually there is a Peerless Sell signal before the decline.
I studied this
phenomenon a year ago Below are the false breakouts
above flat and well-tested resistance with Buy B10s.
False Breakouts
Warnings
Subsequent Action
--------------------------------------------------------------------------------------------------
July 1929 S9, S12 A/D Line
NC, P<0, VI<0 10% decline
Nov 1940 earlier S4 very
high red volume Bear Market follows
---> Nov 1950
6% decline
Sept 1955 S7,
S8, S4, A/D Line NC, VI<0
10% decline
very high red volume warning
April 1965 S7, IP21<0, VI<0 on
breakout 11% decline
---> Dec 1986 A/D
Line NC, IP21<0, VI<0
3% decline
July 1998 S9, S12 A/D Line
19% decline
Dec 1999 S9, S12 A/D Line NC, P<0,
VI<0 17% decline
---> May 2014 DJI
did not close above rising resistance 2% decline
---> Sept 2014 P<0, AD
Line NC, V<0, IP21 only +.014 ?????
A New Peerless Sell S17
Based on A Sharp Drop in IP21 in September?
If we can say that Peerless gave no Sell signal a few days ago, then the
cases above strongly suggest that any decline now should not take the
DJI down more than 6%. But can we really say that? On the day after
the breakout, on Friday, the 19th, the DJI tagged its 1.9% band with
miserable internals. The P-I was a negative -69. The V-I was -54 and
the IP21 was only .014, having fallen sharply in one day from +.103. All this
took place on exceptionally high (red) volume, suggesting churning. Since the DJI
and the other indexes and key ETFs closed near their lows, this was also
a "dumping day" by professionals as well as a bearish "red
popsicle" day.
While it's true that the DJI did not quite rally high enough for Peerless to give a
Sell S9, S9V or S12, I noted that in all three previous September cases when the
DJI's IP21 fell so sharply (by .085 or more) from the previous day with the
DJI still above its 21-day ma, there were immediate declines.
In light of the broad market weakness now, we should look at the
internals
in these three earlier September cases of sharp IP21 drops of
.085 or
more and compare them with our own. Cases #2 and #3 are the closest
parallels. The first instance followed soon after the terrible bear market of
1929-1933. There were no paper losses in any of these cases. The average drop
for cases #2 and #3 was only 3.7%. Such a decline from last Friday's close would
bring a drop to only 16639, about 416 points lower. But because of how
poorly the broad market has behaved, it would probably have been much
better if Peerless has given a Sell.
#1 9/18/1933
105.3 to 84.4 18% decline Good Short Sale
no paper loss
la/ma 21-day ma
P-I Pchange Adjusted IP21
IP21 V-I OPct
65-pct
ROC
PI
drop
change
1.03
.689
-17 -29
-121 .097 .089
-163 .202 .187
------
( 9/9/1940 127.4 to
129.3 to 106.3
Early 6% paper loss.
1.025
.433
-63 -25 +317
.129
.081
43 .037 .132
low
)
#2 9/22/1982
923.76 to 896.25 3 1/2% 2.9%
decline Good
Short Sale no paper loss
1.02
.478
+190 -41
+366 -.035
.114
6
.100 .174
------
#3 9/20/2013
15451.09 to 14776.53 4.4%
decline... Good Short
Sale no paper loss
1.021
.436
+379
+2 +379
-.048 .095
-3 .200
.022
-------
#4 9/19/2014
17279.74 to ?
1.011
.210 -69
-34 -69 -.014 .089
-54 .308
.022
-------
While no other
month reliably works well with such a signal, Septembers are
the most bearish month of the year. While we have buy signals based
on the bullish seasonality of November and December, we have no
Sell signals now that are generated only in the bearish month of September.
I will put this in as a Sell S17 in the next week or so along with some
other improvements in the flagging programs and the Tiger Buys and Sells.
September Cases of Big One-Day IP21 Declines:
1982 and 2013
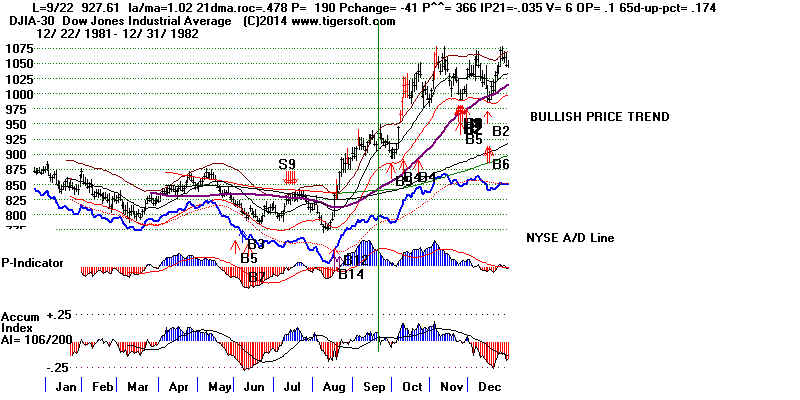 |
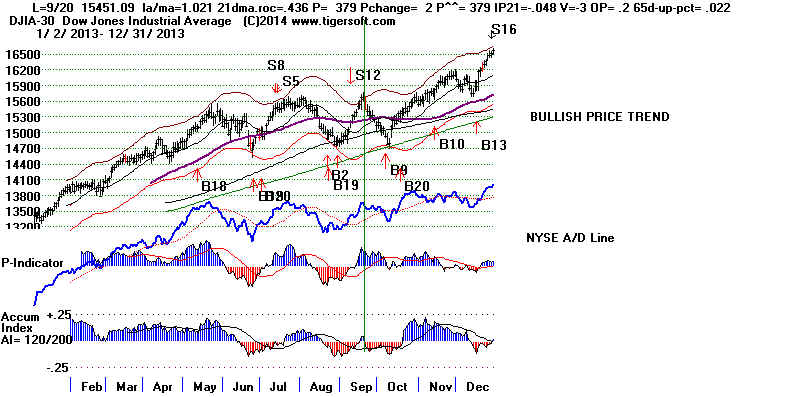 |
Broad Market Weakness Worsens
The gap between the DJI-30 and big banks on the upside and
average stocks and those in the Russell-2000 representing the
broader market widened today. We see this most clearly in the
percentage of stocks above their 65-dma in each group. See here
and below. If this is going to be a decline like we saw in January or
July, the percentage of DJI stocks over the 65-dma could still
fall to a point where only 25% are over the 65-dma. This is not
comforting. It is also not good that our TigerSoft chart of these 30-DJI
stocks shows the DJI is clearly below its falling 65-dma. See below.
We factor in the volume of trading as well as price in weighting each DJI
stock, Dow Jones in its computation weights each DJI stock by price alone.
This tends to hold up this venerable blue-chip index because its gives
greater weight to the highest priced DJI stocks, exactly those that are
holding up the best. But out chart shows that 70% of all the DJI stocks
are holding up well and have not broken their key 65-dma. It also shows
that the DJI-30s A/D Line is still uptrending.
Group
Pct. of Stocks
above 65-dma
9/22/2014 9/23/2014
----------------------------------------------------------------
Biggest 7 Banks
100% 100%
DJI-30
70% 70%
Russell-1000
45.5% 38.2% - 7.3% (approx.
73 more stocks here fell below 65-dma)
All 4949 A-Z Stocks
34.6%
29.8% - 4.8% (approx.
237 more stocks here fell below 65-dma)
Home Building
27.3% 22.7% - 4.6%
(rates not expected to go down.)
Reits
6.3% 5.0% - 1.3%
(rates not expected to go down.)
Utilities
19.0% 16.7% - 2.3%
(rates not expected to go down.)
Bonds
26.6% 28.1% + 1.5%
(money seeking safety?
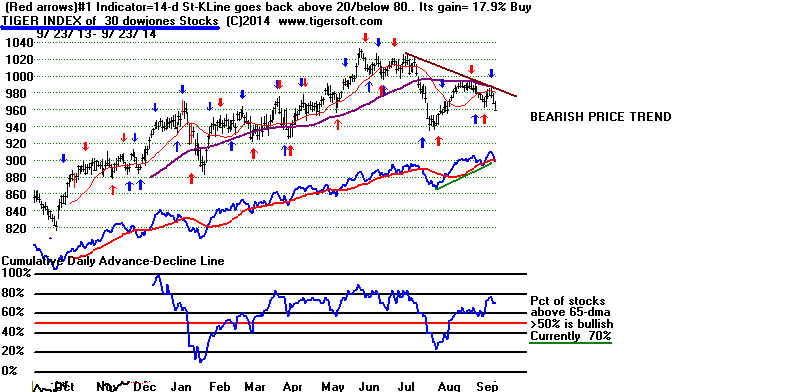
-------------------------------------------------------------------------------------------------------------------------------------------------------
OLDER
HOTLINES
9/22/2014
With no new Peerless Sell signal, the DJI is not
expected to fall
below 16500 and the lower band. Just maybe, it will not even fall
below its rising 65-dma at 16850. See the examples of 1929,
1972-3 and 1999-2000 below to appreciate just how good the DJI
is at holding up even though most other stocks are falling.
The Broader Market Is Getting Dangerously Weak.
70% of the DJI-30 stocks are still above their 65-dma. The average for
the A-Z directories is half of that. (See the current statistics
on this for these directories and
the different industries. ) I think that
Blue chip and MAXCP investors can afford to wait for a Peerless Sell signal,
but owners of most smaller stocks should sell or be hedged, despite
the Peerless Buys. This situation is not unusual late in a bull market.
Picking Stocks To Sell and Sell Short
The weakest smaller stocks will have shown "big red popsicles" (see
IWM below) on their TigerSoft candle-stick charts. They will have a
CP%-Pr% way below 0. (This mans their Closing Power will be much
closer to its 65-day low than is current price is.) The IP21 will drop below zero
before, or soon after, the stock falls below its 65-dma. These dangerously
weakening stocks will often show head/shoulders patterns, increasingly
steady red-distribution and broken well-tested supports. (Get the
Killer
Short Sales e-book for much more detail).
Deflation Is The Problem,
But Most Politicians Are Fighting Inflation.
There is a rush to cash, especially in many smaller stocks. Fears that we
are in a Deflationary economy are growing. Cash is king in
these environments. I think there is also a growing fear that the
Fed is losing control of the economy. Monetary policy cannot
create enough jobs. But with Washington stalemated, there can be
no massive Public Works program, as in 1925, 1933-1936
or 1954-1955, to provide stimulus. Rather than being bullish, the rapid
fall in the prices of commodities, oil, gas, precious metals, steel...
signifies a falling world demand. It is the threat of a much slower
economy, not rising fuel prices, that has caused the Tiger Index of
Transportation stocks to form a menacing head/shoulders pattern.
We must watch this closely to see if the neckline is bearishly broken here.
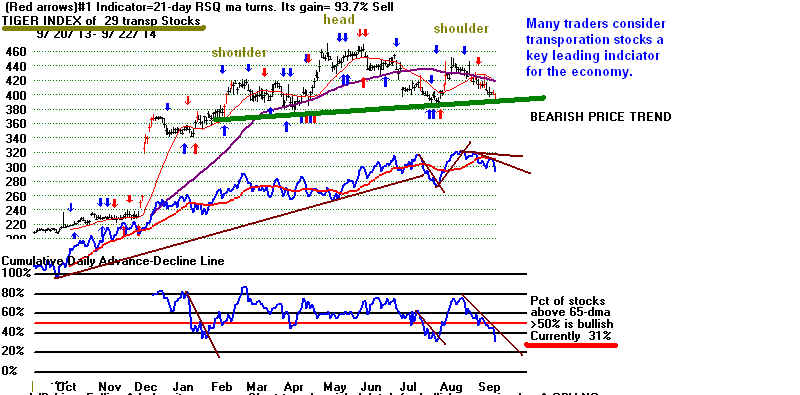
And with the Dollar on a rampage, US manufacturing will face
hard times
as competing imports get still cheaper. Meanwhile, recessionary
forces overseas are now reflected in the many bear markets in non-US ETFs.
Where will a future growth in profits come from? More mergers?
The Bear Market in Foreign ETFs Continues
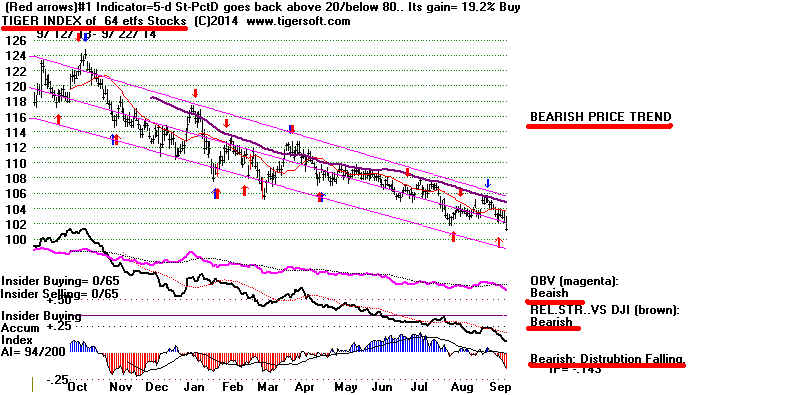
Smaller stocks such as those that comprise
the Russell-2000 are
much weaker than our own top-tier blue chips. Compare the
chart of the Russell-2000 with our chart of the "Big Fidel" stocks.
These are the 27 blue chips that Fidelity's different sector funds
have their largest positions in.
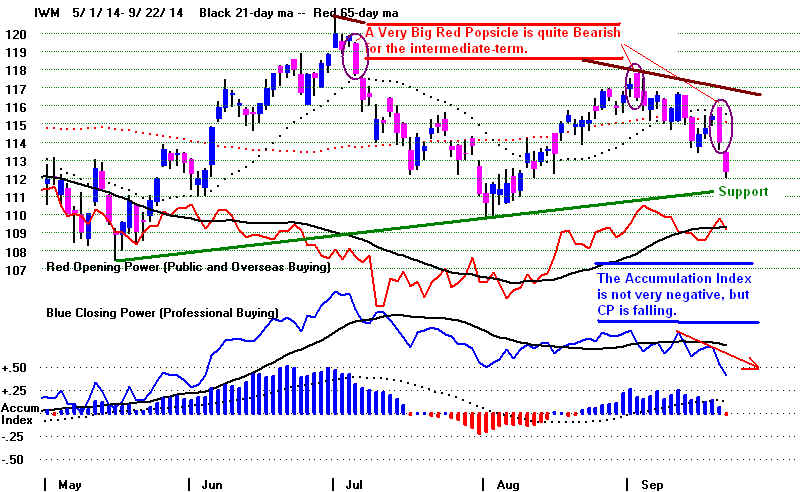
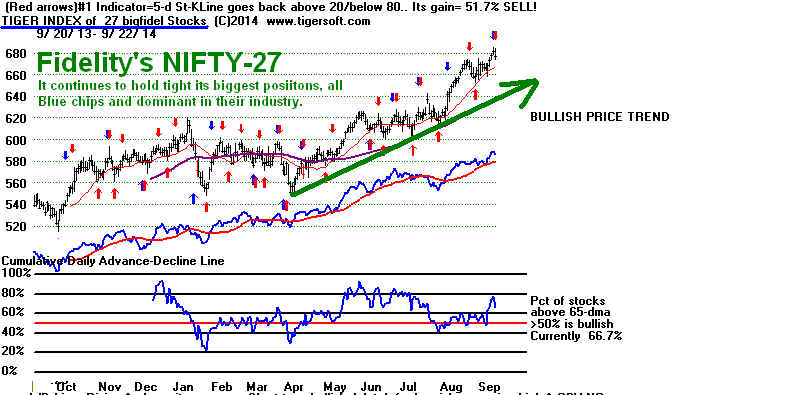
Peerless remains on its B20/B10. The hourly DJI chart
below shows that
today's drop of 100 by the DJI has not yet produced a close below the
point of breakout. But the decline was deep and broad. The
DJI's next support I reckon to be at 16850 and its 65-dma.
I mentioned last night that in all four of the cases where the DJI's
IP21 fell by .085 in September back to 1928, the DJI subsequently
fell, at least, to its lower band. That support is at 16450. Without
a new Peerless, a deeper DJI decline seems unlikely.
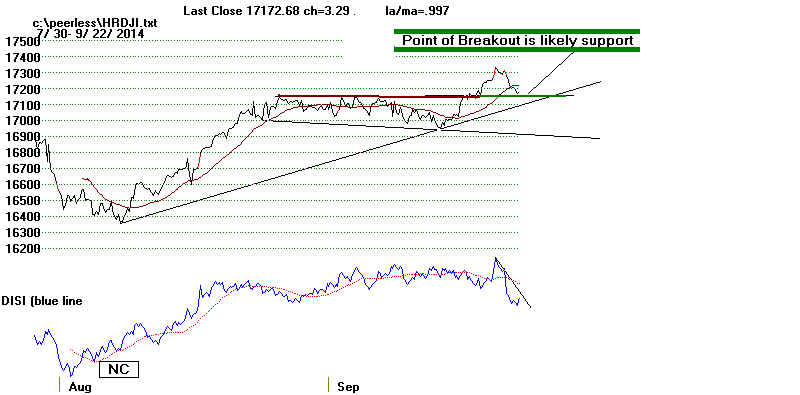
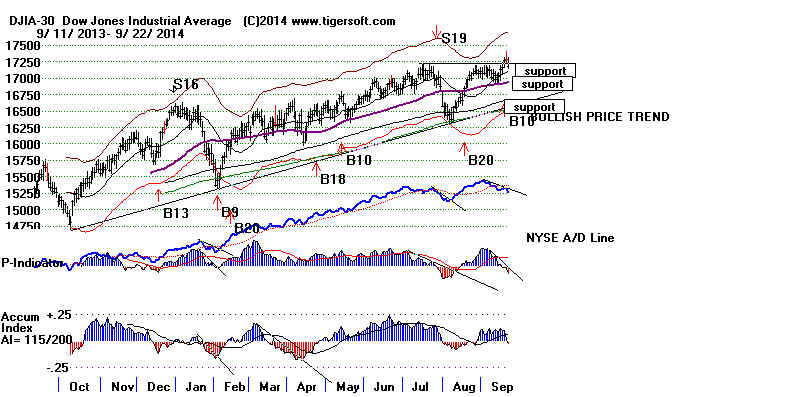
-----------------------------------------------------------------------------------------------------------------------------------
> To Key Index and Leading Stock Charts: DJI, SP-500, etc.
Peerless DJI Chart SPY Chart NASDAQ Chart QQQ
Chart
IBB Chart
IWM Chart
Hourly DJI-OBV Hourly-MVM0735
FAS-3x Financials IBB-Biotechs
-----------------------------------------------------------------------------------------------------------------------------------
-->18 -21 MAXCP stocks Bullish MAXCP Stocks (9/22/2014)
Highest A/I 200 DJI-30 Stock - CAT Trading this on
long side
using Closing Power trendbreaks has appeal.
--> 318 +95
MINCP stocks Bearish MINCP Stocks
(9/22/2014) Bearish plurality
--> 12
New Highs on NASDAQ
92 new lows. Bearish plurality
--> 9 New Highs on NYSE 117 new lows. Bearish plurality
-----------------------------------------------------------------------------------------------------------------------------------
How The A/D Line Can Bearishly Diverge
So Lone from The DJI's Price Action.
Just as we have the very rich and the poor and we have
importing and exporting companies, so do we also
have fifty or so blue chip mega-corporations that dominate
their markets and, not incidentally, the politicians that make
the rules and all the rest of the business world. The differences
are clearest when we contrast the Bullish MAXCP Stocks and
Bearish MINCP
Stocks.
More and more, the present can be compared to the Fall of 1972
when there existed a group of "nifty fifty" big blue chips and growth
stocks at the top level. These were said to be "one-decision"
stocks.
Despite PE's of 50-75:1, they were the institutional favorites. They were
growth stocks that one simply bought and held tight. At least, that was
the plan. But in 1973, the DJI fell more than 10% from its January peak
high after a fourth set of Peerless Sells in a span of 7 months.
This un-nerved the institutions and soon even the nifty-fifty stocks
were being dumped, too. My guess is that 1929 was like this, too.
As fewer and fewer other stocks kept rising, those still did so got
more and more funds from those playing the performance game.
This is what allowed the DJI-30 rocket up so much even though the
rest of the market was already very weak by mid-1929.
DJI: 1972-1973
The DJI held up the longest because of the presence of so many
of the nifty-fifty among its components. In March 1973, the DJI
fell away more than 10% from its high. That was when the real decline
commenced. 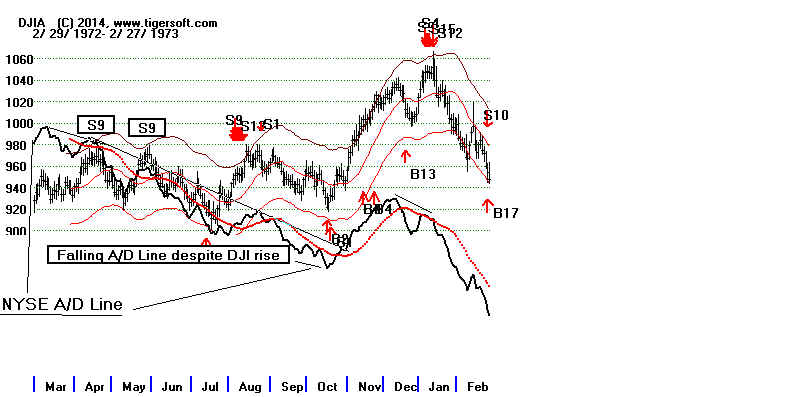
1929 Note how long the A/D Line diverged from prices.
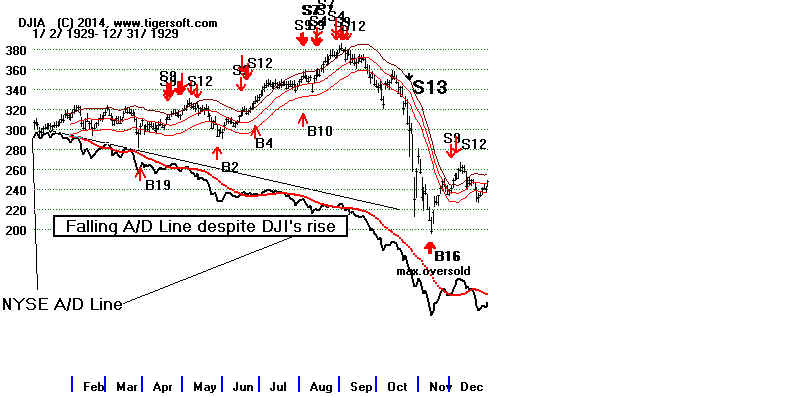
1999-2000 Note how long the A/D Line diverged from prices.
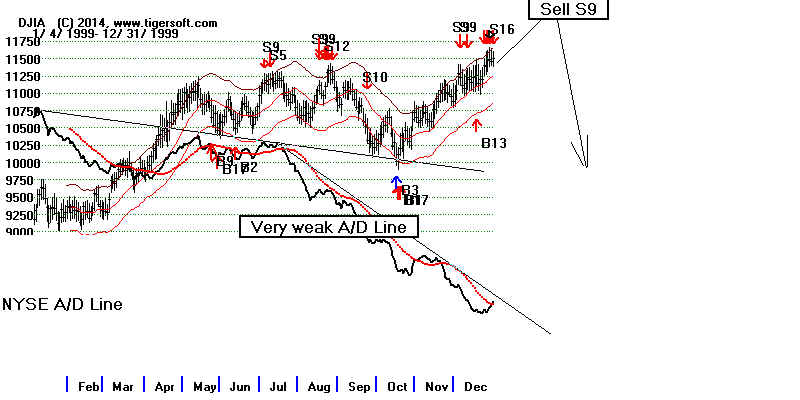
====================================================================================
OLDER HOTLINES
====================================================================================
9/19/2014
Peerless remains on its B20/B10. But the weakening internals will likely produce
a new Sell if the DJI rallies 1.6% from here to, say, 17500. Expect good support
on a quick DJI re-test of 17200 this week. Smaller stocks are, however,
much more vulnerable. IWM, representing the Russell-1000, shows a falling
Closing Power, has a negative Accumulation Index and is below its 65-dma.
It looks like we have an entered an era of increasing Deflation.
The rising Dollar and Deflation (falling precious metals, falling gold and
silver and falling fuel prices) hurt Main Street, in general. Wall Street
loves this environment, so long as profits do not turn down because of
unsold inventories. The Fed dares not let the stock market, as represented
by the DJI, OEX, SPY and big banks, drop by more than 10% for fear
of losing control and starting a much bigger panic.
Hedging is fine, but I would not turn bearish. Keep in mind that there
have not been any big September or October declines without first
a Peerless Sell. This is true going all the way back to 1928. In addition,
appreciate that Septembers in bull markets are generally much more
bullish than Septembers generally. For background on this topic see
"The Jig Is Up": Calling
September and October Tops. We need to
see how the markets behave when there is no triple witching expiration
and no huge new public offering. A sharp IP21 drop in
the DJI, such
as we saw on Friday, is distinctly bearish in Septembers, not withstanding
how reliable Peerless has otherwise been in this month.
See this new
study of sharp drops in IP21.
A Short-Term Retreat Seems Likely
Thurday's B10 was greeted badly and bearishly by Friday's trading.
Valid Buy B10s in all-time high territory should bring a strong follow-through.
Friday's was not. To avoid a false breakout, the DJI will need to stay
above 17200, 79 points lower. If it fails the breakout, it will still have good
support at its 65-dma at 16850. False breakouts on Peerless B10s have not
previously brought any declines below the lower band without a new
Peerless Sell.
A false breakout would not come as a big surprise. Our new Peerless Buy B10
here occurred with both the P-I and V-I in negative territory. No other
Buy B10 had both these key values in negative
territory.
A Short-Term Decline Seems Likely
Making the breakout look even more suspect was the way the various indexes
and key ETFs sold off after a higher opening on Friday. This weakened a
variety
of our technical indicators:
1) The OBV-Pct for the SP-500 and NYSE have turned negative. But the
DJI, OEX and NASDAQ show positive OBV-Pct readings.
2) Numerous bearish "red roller-pins" and "red
popsicles" have
appeared on the key major market ETFs.
See DIA-POP, SPY-POP,
QQQ-POP, IWM-POP, FAS-POP, IBB-POP
3) The DJI's current Accumulation Index has dropped from +.103
to only +.014. This makes a Sell S12 possible if the DJI continues to
rally.
By itself, back to 1929, such a big one day drop in the IP21 is about as
likely to bring a drop to the lower band as bring a very big loss to a short seller.
Septembers are more bearish. It in the four cases of
sharp IP21 drops on the
DJI in September, two brought sharp declines below the lower band and
two others brought declines to the 3%-3.5%. All would have been profitable
to a short seller. There were no intervening rallies of
more than 2.5%.
See this new study of sharp drops in
IP21.
4) The DJI's P-I is now -35 despite the DJI being 1.1% over the 21-day ma.
This makes an S9 possible if the DJI rallies another 1.5%.
5) The negative Closing Power divergences from Price worsened for the
key major market ETFs. In this condition, a drop by these ETFs below their 65-dma
with their IP21 also negative, is a reliable short-term Sell.
Bearish negative readings are shown in red. So far, there are bearish
Closing Power divergences, but we need more than this to become
bearish in an intermediate-term.
ETF
IP21
CP%-Pr%
Price vs.65-dma CP Trend
9/18 9/19
9/18
9/19
--------------------------------------------------------------------------------------------------------------------------
DIA
.191 .10
-.12
-.19
172.45 vs 169. Up
QQQ
.240 .221
-.04
-.13
99.98 vs
96.8 Up.
CP turned down from resistance.
SPY
.259 .195
-.21 -.24
200.7 vs 197.0
Up
IWM
.159 .089
-.23
-.32 113.97 vs 115.5 Fallling
FAS
.151 .064
-.04 -.17
109.76 vs 102.
Up.
IBB
.184 .198
-.02
-.06 275.23 vs 261
Up.
CP turned down from resistance.
-----------------------------------------------------------------------------------------------------------------------------------
> To Key Index and Leading Stock Charts: DJI, SP-500, etc.
Peerless DJI Chart SPY Chart NASDAQ Chart QQQ
Chart
IBB Chart
IWM Chart
Hourly DJI-OBV Hourly-MVM0735
FAS-3x Financials IBB-Biotechs
-----------------------------------------------------------------------------------------------------------------------------------
-->39 -47 MAXCP stocks Bullish MAXCP Stocks (9/19/2014)
Highest A/I 200 DJI-30 Stock - CAT Trading this on
long side
using Closing Power trendbreaks has appeal.
--> 223 +93
MINCP stocks Bearish MINCP Stocks (9/19/2014) Bearish
plurality
--> 33
New Highs on NASDAQ
73 new lows. Bearish plurality
--> 39 New Highs on NYSE 76 new lows. Bearish plurality
-----------------------------------------------------------------------------------------------------------------------------------
BABA BOOM!
We might hope that the trading was simply distorted by options' expirations.
But the nagging fear I have is that the breakout B10 was artificial
and used to guarantee the success of the massive new issue of Alibaba,
BABA.
BABA's NYSE trading volume was 271 million shares. ("Alibaba
is valued at 39 times
its estimated earnings per share for its current fiscal year, which ends in March. That is
right
in line with Facebook's (FB.O) valuation of 39 times forward earnings but nowhere near
the lofty valuation of Amazon.com's (AMZN.O)
multiple of 264." Source.).
BABA's trading
volume made up 46% of all NYSE volume. More and more, the NYSE is
international, not national. Keep this mind, as we ponder how much Wall Street
is removed from Main Street USA.

-------------------------------------------------------------------------------------------------------------------------------------------------------
OLDER HOTLINES
-------------------------------------------------------------------------------------------------------------------------------------------------------
9/18/2014
The 100 point-DJI advance today brought a new Buy B10 to
reinforce
the earlier Buy B20. The
bullishness of the DJI's breakout past well-tested
flat resistance, as now, into all-time high territory should not be underestimated.
Such a pattern occurred at the start of the 1995-2000 bull market. Nor should we
discount the new Buy B10 because it is now September. There have
been 5 earlier September B10s. Their gains ranged from +4.0% to
+18.8%. To be valid, prices should move higher on rising volume.
A breakout failure would put the DJI back into its sleepy narrow
range with support at the rising (purple) 65-dma at 16850.
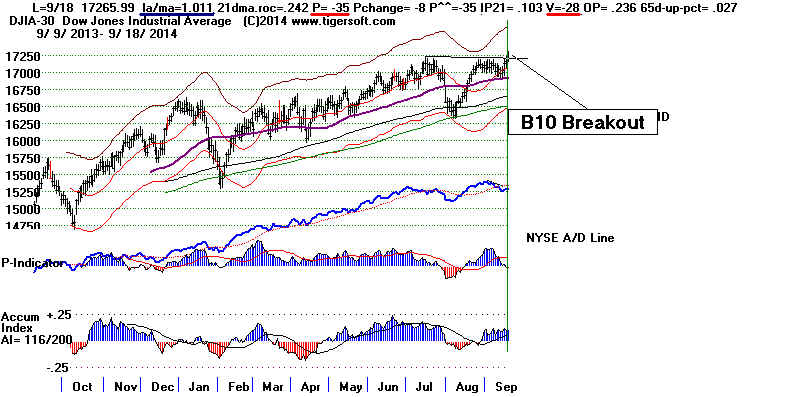
Still, this Buy B10's bullishness is suspect. See above that both the
P-Indicator (-35) and the V-Indicator (-28) are negative. In all the 47
earlier B10 cases back to 1928, there has been only instance where
the P-I was negative, as now, and no cases where the V-I was negative.
This is a warning that if the DJI were to jump up to the 2.5% over the 21-day
ma level, about 300 points higher than now, with no improvement in
the P-I and V-I, we will most likely get a Sell S9.
It looks like we will get a big jump at the opening today, partly due to
the DJI's breakout and partly due to the expected Scottish vote of "No"
to independence from the UK. I would close out Bearish MINCP short
sales if their Closing Power downtrendlines are violated and stay long
an assortment of Bullish MAXCP stocks. The DIA and SPY show
greater relative strength currently than QQQ or IWM, so ETF traders
should probably stick with the DIA and SPY. The breakout puts
a lot of pressure on short sellers. This should give us a few more days
of price-follow-through. The old adage of selling on Rosh Hashanah (Sept.
25th)
and buying back on Yom Kippur (Oct 4th) may make a good trade this year.
If there is a retreat, there should be excellent support on the first test or two
of 17200.
-----------------------------------------------------------------------------------------------------------------------------------
> To Key Index and Leading Stock Charts: DJI, SP-500, etc.
Peerless DJI Chart SPY Chart NASDAQ Chart QQQ
Chart
IBB Chart
IWM Chart
Hourly DJI-OBV Hourly-MVM0735
FAS-3x Financials IBB-Biotechs
-----------------------------------------------------------------------------------------------------------------------------------
-->86 MAXCP stocks Bullish MAXCP Stocks (9/18/2014)
Highest A/I 200 DJI-30 Stock - CAT Trading this on
long side
using Closing Power trendbreaks has appeal.
--> 130
MINCP stocks Bearish MINCP Stocks (9/18/2014) Bearish
plurality
--> 53 +14 New Highs on NASDAQ
28 -2 new lows. Bullish plurality
--> 76 +25 New Highs on NYSE 46 +11 new lows. Bullish plurality
-----------------------------------------------------------------------------------------------------------------------------------
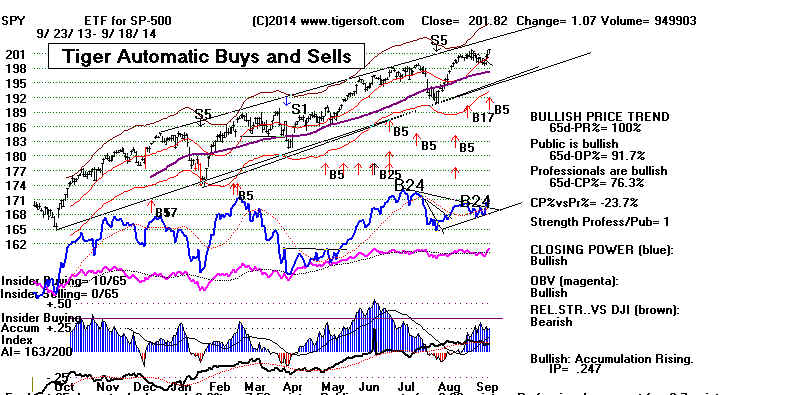
-------------------------------------------------------------------------------------------------------------------------------------------------------
OLDER HOTLINES
-------------------------------------------------------------------------------------------------------------------------------------------------------|
9/17/2014
Several weeks ago the Peerless Buy B20
told us that breadth was
too good to allow the markets to collapse this September. Unfortunately,
the B20 signal does not tell us to expect the markets to advance very far.
This is because earlier August and September B20s typically only provide
a 2%-3% DJI advance.
But the Fed's latest news will help the markets. The
two dissents by the old guard
on
the FOMC tell
me that the FED is still on the right track and not about to
raise
rates or
jolt the markets with an unexpected rate hikes. This should allow
the DJI to make a flat topped breakout. Shorts must then be expected to push
the DJI up another 100-150 points. After that, technicians will need to
see good breadth (the A/D Line and new highs vs new lows) to stay aboard
the rise.
Let The Market Tell Its Own Story: Be Patient.
The next move should be modestly higher as the most astute traders
watch to see if the breadth of the market is strong enough to permit big gains
or, oppositely, whether the DJI will rise alone to a significantly
unconfirmed major top, as has often happened in the past. Keep in
mind just how normal it is for the DJI to get way ahead of the rest of the
market late in a bull market. The resulting divergences should bring
major Sells when the time is right.
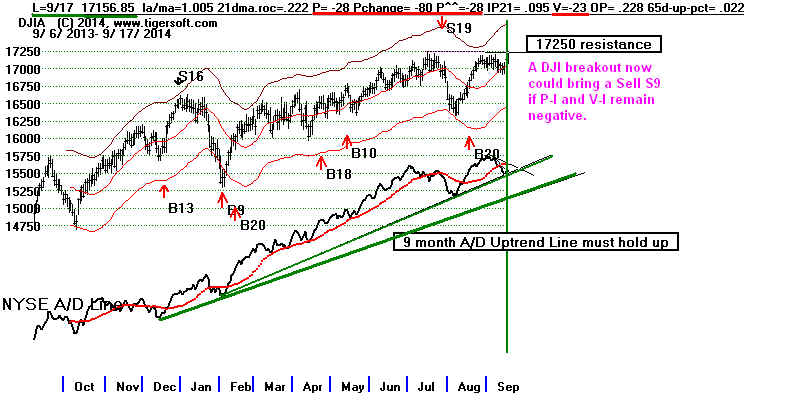
So, we are left to watch the progress the DJI makes in eating up the
17250 resistance and in bringing along the other averages and the
market as a whole. If the DJI does breakout above the well-tested
resistance, we could see a Sell S9. The P-I and the V-I Indicators
are negative now. Only DJI has made a nominal new closing high
and the Hourly DISI (OBV) Line has failed so far to confirm the
advance that began two days ago.
While we wait for the markets to become unstuck from the unusually
narrow range they have are locked in and while we wait for the FED
to give us a clearer idea of when rates will go up, I think the best
strategy is to be long some of the Bullish MAXCP stocks and short
some of Bearish MINCP stocks. It often happens that, we can make
on both sides of such a hedged position.
-----------------------------------------------------------------------------------------------------------------------------------
> To Key Index and Leading Stock Charts: DJI, SP-500, etc.
Peerless DJI Chart SPY Chart NASDAQ Chart QQQ
Chart
IBB Chart
IWM Chart
Hourly DJI-OBV Hourly-MVM0735
FAS-3x Financials IBB-Biotechs
-----------------------------------------------------------------------------------------------------------------------------------
-->81 +20 MAXCP stocks Bullish MAXCP Stocks (9/17/2014)
Highest A/I 200 DJI-30 Stock - CAT Trading this on
long side
using Closing Power trendbreaks has appeal.
--> 127 -10
MINCP stocks Bearish
MINCP Stocks (9/17/2014)
Bearish plurality
--> 37 +21 New Highs on NASDAQ
30 new lows. Bullish plurality
--> 51 +26 New Highs on NYSE 35 -4 new lows. Bullish plurality
-----------------------------------------------------------------------------------------------------------------------------------
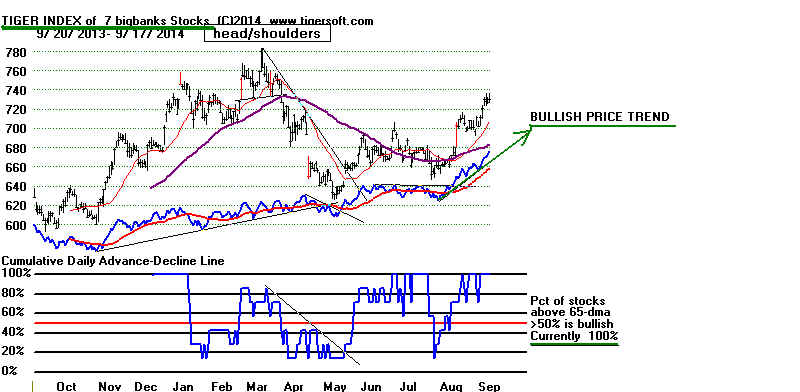
Watch the Big Banks and the NYSE A/D Line. As long as their
A/D Lines hold up and as long as the Closing Power of the Banks'
leveraged ETF holds up, the odds are very much against the Fed
surprising the markets by raising rates, something which would, I think,
be very bearish in the present market environment. In the absence
of Congress and the President being able to develop any consistent
fiscal approach, monetary policy and the FED are kings. And if
the FED is king, the big banks will get special treatment and
show strength until the very end of this bull market.
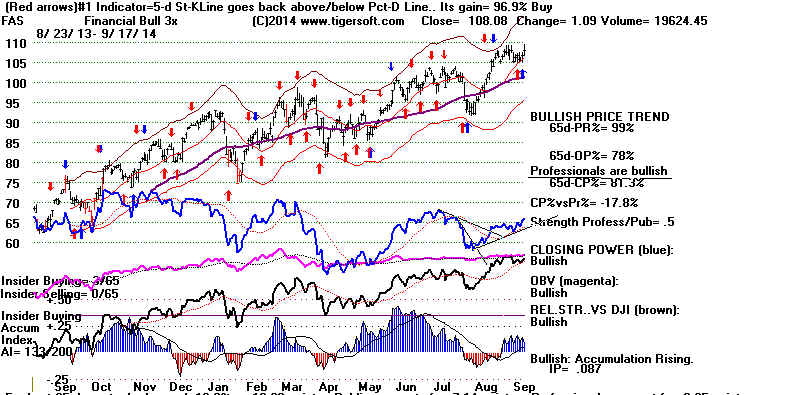
====================================================================================
OLDER HOTLINES
====================================================================================
9/16/2014 The Peerless Buy B20 has apparently
over-powered September fears.
Use broken Closing Power downtrends to cover short sales and buy
some new Bullish MAXCPs now. Beaten down oil and gas
stocks should
bounce back. See CL1620's high Accumulation and
rising Closing Power.
This is a perpetual contract representing Crude Oil Futures.
We will be watching to see if the DJI turns back again at its
well-tested 17200 resistance or if it can manage a breakout surge,
perhaps on a bullish Fed announcement regarding interest rates.

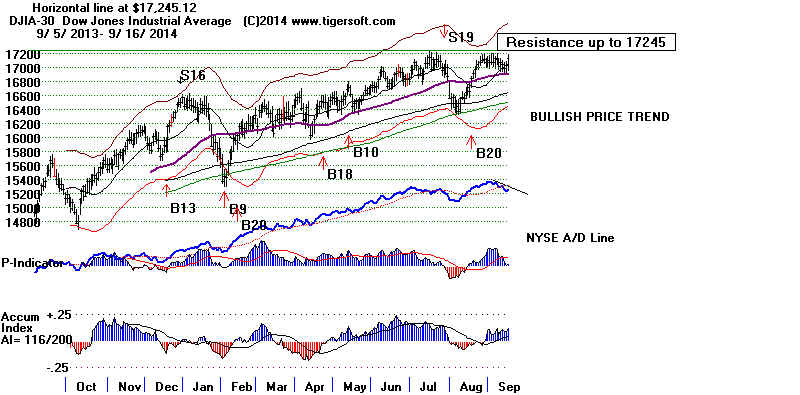
The FED appears to have decided to delay raising rates, at least for
a longer time than than many feared. That seems to have been the sense
that pervaded Wall Street's mid-day rally today as Professionals started
buying dividend, Bullish MAXCP stocks, key ETFs and many stocks, too.
Today's breadth was as positive as yersterday's was negative. For traders
this sets up yesterday's low as key short-term support for the major indexes.
Bullishly, the Closing Power of DIA and SPY broke their downtrends.

An Important New Tiger Buy Signal Is To Be Added:
Closing Power Take-Off
I want to show you some new research tonight on the stocks whose Closing Power
rose more as a percentage of current price than at any time in the last 50 trading
days.
What caused me to spot this was how useful big jumps in the blue Tiger candle stick
charts are. A very simple set of rules seems to bring a success rate well
over
75%. The tables below also show that many stocks recently have shown unusual
buyiing by Professionals. I will need to develop and test a corresponding Sell
signal. The charts shown here show Tiger Buy B7s. But I'm thinking of
renaming
it a Buy B13. That signal now can be placed on our charts using a different
pull-down choice, so we lose nothing in replacing it with the Closing Power Take-Off
Buy Signal. I will make the change and place the revised Peerless/Tiger program
on the Elite Page in a few days. I want to see if the reverse works as a Sell
signal.


-----------------------------------------------------------------------------------------------------------------------------------
> To Key Index and Leading Stock Charts: DJI, SP-500, etc.
Peerless DJI Chart SPY Chart NASDAQ Chart QQQ
Chart
IBB Chart
IWM Chart
Hourly DJI-OBV Hourly-MVM0735
FAS-3x Financials IBB-Biotechs
-----------------------------------------------------------------------------------------------------------------------------------
-->61 +35 MAXCP stocks Bullish MAXCP Stocks (9/16/2014)
Highest A/I 200 DJI-30 Stock - CAT Trading this on
long side
using Closing Power trendbreaks has appeal.
--> 137
MINCP stocks Bearish
MINCP Stocks (9/16/2014)
Bearish plurality
--> 16 New Highs on NASDAQ
57 new lows. Bullish plurality
--> 25 New Highs on NYSE 39 new lows. Bearish plurality
-----------------------------------------------------------------------------------------------------------------------------------
Tables Showing Successes and Failures
of
New Closing Power
Take-Off Buy Signal in 2014
New CP Buy
Success Rate
(Successes/(Successes + Failures)
30 14A Stocks
40/52
76.9%
30 NASDAQ-100 Stocks 53/61
86.9%
30 DJI Stocks
51/62 82.3%
8 Big ETFs
18/20 90%
New Tiger Closing Power Buy Signals
         (Shown in charts as B7s)

    30 14A Stocks    40 successes 12 failures
                                         76.9% Success Rate (excluding recent signals)
   Successes  Failures   New Signals (Too recent to count)
-----------------------------------------------------------
A     2                   1
AA    1
AAMC  2
AAME  to low priced and thin
AAN   2                   1  (far below 65-dma)
AAON  1                   1
AAP   3
AAPL  2                   1
AAT   2
AAU   2
AAV   2                   1
AAWW             2        1
AAXJ  1          1        1
        (Failure here actually showed a good
        5-day rally but then fell to new lows.)
AB    2                   1
ABAX  2                   1
ABB              2
ABBV  1 (to UB)  2
ABC   2                   1
ABCB  1                   1
ABCO             1? (Far below 65-dma)
ABG   2
ABIO low priced and thin. <700
ABM   2 (rally to 65-dma)
ABT   1                    1
ABTL             1 (stopped at falling 65dma)
ABX   2
ACAD             1 (big price spike up on day of signal)
ACAS  1                    1
ACAT  1          1         1
     (Good rally but stopped at falling 65-dma)
ACC   2
-----------------------------------------------------
     39          11        13 rising but still open.
|
New
Tiger Closing Power Buy Signals
(Shown in charts as B7s)
30 QQQ Stocks
53 successes 8 failures
86.9% Success Rate (excluding recent signals)
     Successes  Failures   New
     -------------------------------
AAPL  2                   1
ADBE  1
ADI   1 (to upper band)
ADP   3
ADSK  2          1 flat for 3 mo.
AKAM  1
ALTR  1                   1
ALXN  2
AMAT  2                   1
AMGN  2
AMZN  1          1 (bad to buy at falling 65-dma)
APOL  1          2
ATVI  1
AVGO  3
BBBY  1          1 flat for 2 months and then up.
BIDU             1        1
BIIB  2                   1
BRCM  3
CA    2          1 (far below falling 65-dma)
CELG  2
CERN  2
CHKP  2
CHRW  2
CMCSA 2
COST  2
CSCO  1          1 (hit falling 65-dma and 5% gain became loss.)
CTRX  3
CTSH  1                   1
CTXS  2
DISCA 1                   1
------------------------------------------
      53         8        7
|
| New
Tiger Closing Power Buy Signals
(Shown in charts as B7s)
30 DJI Stocks
51 successes 11 failures
82.3% Success Rate (excluding recent signals)
      Successes  Failures   New
     -------------------------------
AXP  1
BA   2           1
CAT  2
CSCO 1           1
CVX  3                      1
DD   1           1
DIS  1
GE   1           1
GS   2
HD   3
IBM  3
INTC 3
JNJ  2           1
JPM  2           1
KO   2
MCD  1           1
MMM  2
MRK  2           1 (slightly up in 3 months)
MSFT 3
NKE  1
PFE  1           1
PG   2
T                1            1
TRV  1                        1
UNH  2
UTX  2
V    1                        1
VZ   1           1
WMT  2
XOM  1                        1
--------------------------------------------
    51          11            5
|
New Tiger Closing Power Buy Signals
(Shown in charts as B7s)
8 Big ETFS
18 successes 2 failures
90% Success Rate (excluding recent signals)
      Successes  Failures   New
     -------------------------------
DIA  1           1 (only 3 day rally)
FAS  2           1 (obvious head/shoulders pattern)
IBB  3
IWM  3
MDY  3
QQQ  2
SPY  2
TNA  2
--------------------------------------------------
    18           2
|
====================================================================================
OLDER HOTLINES
====================================================================================
9/15/2014
Continue to stay fully hedged by being short some Bearish MINCP
stocks.
This week the DJI may violate its 65-dma at 16,800. The next likely
DJI support would then be its lower band near 16400.
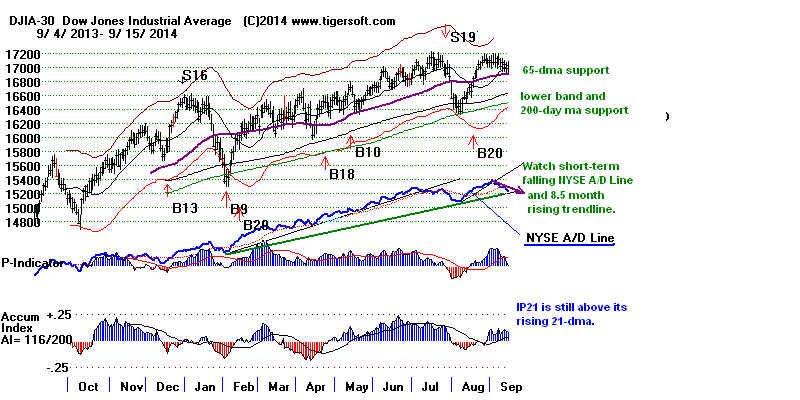
> To Key Index and Leading Stock Charts: DJI,
SP-500, etc.
Peerless DJI Chart SPY Chart NASDAQ Chart QQQ
Chart
IBB Chart
IWM Chart
Hourly DJI-OBV Hourly-MVM0735
FAS-3x Financials IBB-Biotechs
-----------------------------------------------------------------------------------------------------------------------------------
-->26 MAXCP stocks Bullish MAXCP Stocks (9/15/2014)
Highest A/I 200 DJI-30 Stock - CAT Trading this on
long side
using Closing Power trendbreaks has appeal.
--> 177 MINCP stocks Bearish MINCP Stocks (9/15/2014) Bearish
plurality
--> 14 New Highs on NASDAQ
57 new lows. Bullish plurality
--> 12 New Highs on NYSE 29 new lows. Bearish plurality
-----------------------------------------------------------------------------------------------------------------------------------
What Is The Significance of Weakening Breadth?
Today, even though the DJI rose 33.6 points, the ratio of NYSE decliners
to advancers was more than 1.9 to 1. This is a bearish divergence, but with a
55% success rate back to 1957, it is not reliable enough to become a Peerless
Sell signal on its own, especially in September or when the DJI is a percent
or two above the 65-dma, as now. See the lengthy study I did
tonight of such
breadth weakness when the DJI
rallies. As a potential Sell, it is a much
better from May to July than it is from Septmber to January.
Be careful what you hold long now. Secondary stocks are probably
much
more volnerable that the remaining high caps still in uptrends. Remember
that
it is the job of the blue-chip DJI to hold up the appearance that all is well on
Wall Street and to hold up longer and stronger than more nervous smaller capitalization
stocks do. Repeatedly in the past, we see that before a major top is made, there
must
first come a point in most bull markets when the A/D Line starts to seriously lag the DJI.
This may be the beginning of such turning point now. A little later, when the
breadth
divergences become even more severe Peerless will give a Sell S9 on a false
new high near the upper band.
The problem with the Sell S9 in a low interest rate environment, like now, is that the
NYSE A/D Line tends to hold up very well because there are so many dividend stocks
and bond funds there. The usual breadth divergence is more visible now when we
look at all stocks, not just those on the NYSE, and compare them to the DJI-30.
Tiger lets us do this quite easily. Below are the percentage of stocks in the
A-Z directories above their 65-dma with a mention of the A/D Line status versus
its 21-day ma. We can readily compare these numbers with the same pair of
statistics for the DJI-30.
Group of Stocks Pct of Stocks
A/D line relative
over 65-dma to its 21-dma
-----------------------------------------------------------------------------
DJI-30
60%
at the rising 21-dma
Russell-1000
49.8%
Just broke its 21-dma.
14-A
41.8%
well below its 21-dma + A/D Line H/S top.
14-C
39.7%
well below its 21-dma + A/D Line H/S top.
14-M
35.6%
well below its 21-dma
14-P
40.2%
well below its 21-dma
14-S
41.9%
well below its 21-dma + A/D Line H/S top
14-T
44.6%
well below its 21-dma + A/D Line H/S top
14-U to Z
42.2%
well below its 21-dma + A/D Line H/S top
Professionals Are Now More Bullish
Than Overseas' Traders.
This week the markets are running scared. Traders, especially overseas, are fearful
that their economies will slip into certifiable recessions and that hot international
money will rush to American blue chips because of the strong Dollar and the prospects
of higher interest rates in the US.
The
"No" vote on Scottish Independence seems to be slightly ahead.
I would favor the DJI-30 and DIA most now. As long these hold up above
their 65-dma's and the DIA's longer-term Closing Power stays in an uptrend
in the chart below, I would think the DJI may surprise the fearful by advancing
to new highs. Unfortunately, if beadth remains this poor that will bring a
Peerless Sell S9 and then we will be in trouble.
Watch What The Fed Decides
This Week.
All bets will be off if the FOMC announces this week an early date when
interest rates will be raised. As I said this weekend, I think that would be a
dangerous blunder and could well accelerate us into a deflation spiral. Primal fear
would follow a market panic and we will all discover the meaning of a
"liquidity trap". So\, remain fully hedged.
"A liquidity trap is a situation, described in Keynesian
economics, in which
injections of cash into the private banking system by a central bank fail to
decrease interest rates and hence make monetary policy ineffective. A
liquidity trap is caused when people hoard cash because they expect ...deflation,
insufficient aggregate demand, or war."
(See http://en.wikipedia.org/wiki/Liquidity_trap
)
-------------------------------------------------------------------------------------------------------------------------------------------------------
The DJI remains above both its 21-day ma and 65-dma.
IWM, representing the Russell-2000, is below both and
has again completed another bearish head/shoulders pattern.
So many such patterns are fair warning that a significant
top has probably been made.
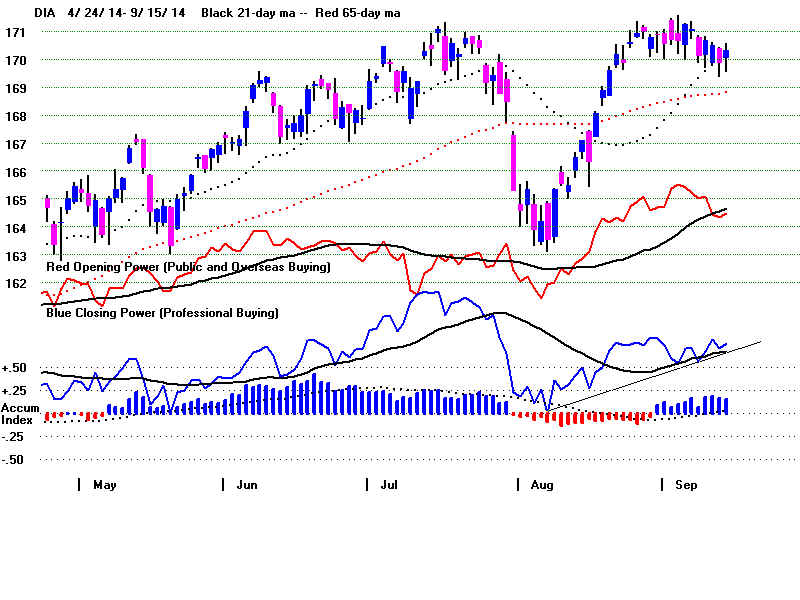
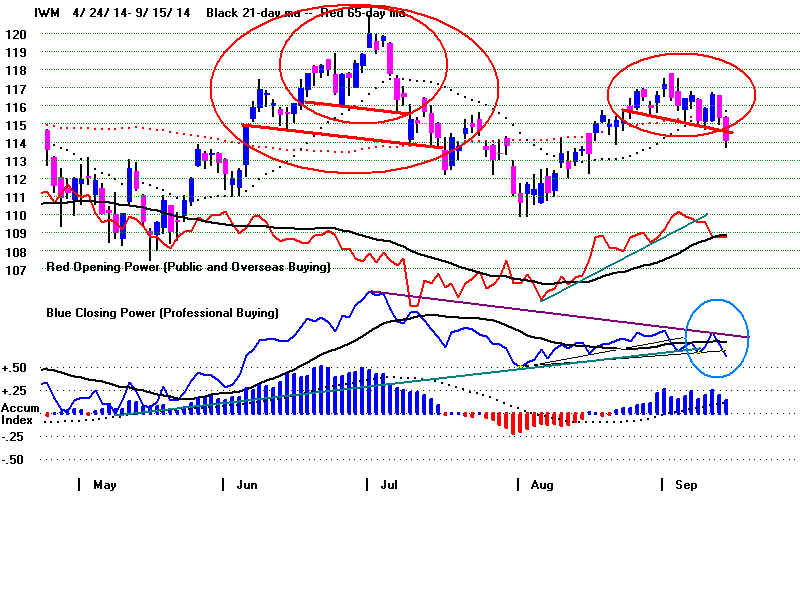
====================================================================================
OLDER HOTLINES
====================================================================================
9/12/2014
Continue to stay fully hedged with Bearish MINCP stocks.
This week the DJI may violate its 65-dma at 16,900. The next likely
DJI support is at its lower band near 16400.
The Fed may be on the verge of a collosal mistake. Tightening money
now when the signs of deflation are everywhere and a Europeon recession
is so close could be a major monetary blunder. Since compensating fiscal policy
is frozen by political stalemate, there could be no going back and fixing the
deflationary spiral that might result from such Fed action.
> To Key Index and Leading Stock Charts: DJI,
SP-500, etc.
Peerless DJI Chart SPY Chart NASDAQ Chart QQQ
Chart
IBB Chart
IWM Chart
Hourly DJI-OBV Hourly-MVM0735
FAS-3x Financials IBB-Biotechs
-----------------------------------------------------------------------------------------------------------------------------------
-->42 MAXCP stocks Bullish MAXCP Stocks (9/12/2014)
Highest A/I 200 DJI-30 Stock - CAT
--> 118 MINCP stocks Bearish MINCP Stocks (9/10/2014) Bearish
plurality
--> 24 New Highs on NASDAQ
21 new lows. Bullish plurality
--> 15 New Highs on NYSE 39 new lows. Bearish plurality
-----------------------------------------------------------------------------------------------------------------------------------
Fortunately, US Professionals still have hope that such dire consequences
will be avoided. The blue Closing Powers for the DIA, SPY, QQQ and IWM
still have not violated their gradually rising, 6-month uptrends. Moreover,
SPY and QQQ have current Accumulation Indexes above +.25. These things
and the absence of a new Peerless Sell should gives us hope that the
DJI will not drop significantly this September.
Rising Interest Rates
Friday the Hourly DJI broke its 17000 support and
breadth was miserable.
There were 1848 more Decliners than advancers on the NYSE and has now
set up a convenient short-term downtrend that we can use to judge when the decline
is over. The weakness owes to a growing sense that the FED will not keep rates
low much longer. And, in fact, the yield on 10-Year notes have advanced from
2.334% to 2.614% in two weeks and have moved past their upper band for the
first time in more than a year.
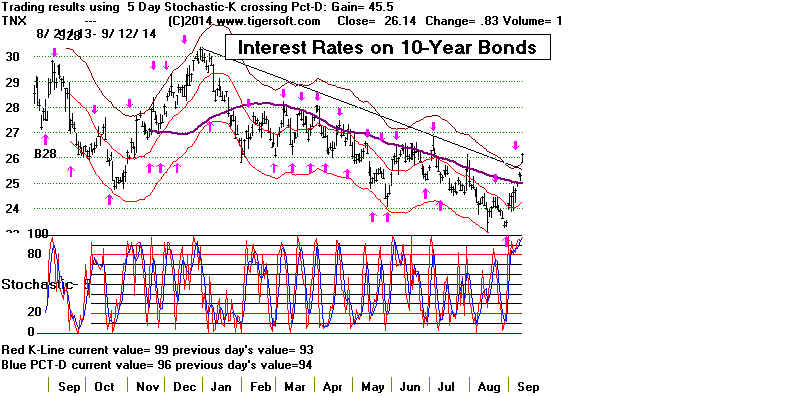
Is The Fed on The Verge of A Collosal Blunder?
I would not have thought the FED would be raising rates given
the unusual strength of the Dollar and the many other signs
of Deflation,
falling crude oil and gas,
falling gold and silver prices,
falling food commodity prices
and falling non-US general market ETFs (See the Tiger Index of foreign ETFs below.
This could be a collossal error! With 47 million Americans on food stamps, the
Job Participation rate at its 10-year
low and Money Velocity at a
45-year low
and the stock market near its 67-month high, the divergence between Wall
Street and Main Street is dangerously wide. Raising rates now could well
break extended price-uptrend lines which will generate a lot of heavy-handed
dumping of stocks and, at the same time, drive up the Dollar, thereby hurting US
manufacturing exports and inviting the export of more US service jobs. This
would all be done because of seriously misguided fears of a non-existent threat of
runaway inflation. And, if the Fed says it is mainly concerned about the
misallocation of
funds due to the stock market's runaway advance, they should consider raising
margin rates and ending the use of the full range of leveraged vehicles that have
encouraged so much short-term speculation.
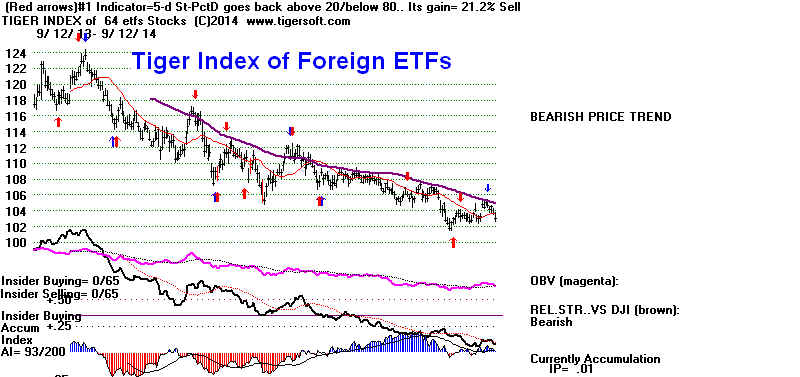

====================================================================================
OLDER HOTLINES
====================================================================================
9/11/2014
The DJI's nearby resistance at 17150 may intimidate traders.
They are apt to wait for more headroom before tying to mount
a decent rally. But today the general market ETFs broke their
steep downtrendlines. This should take some of the selling pressure
off the market and keep it within its narrow range for a few more
trading days unless we see unexpectedly weak openings.
See how in DIA's case below the tightening Closing Power triangle
formation sets up a trading range that now matches the narrowing price
trading range prices are in. This is also what SPY, IWM, MDY and
QQQ have done. To become bullish for the general market
we will
need to see these ETFs' longer term CP downtrends broken.
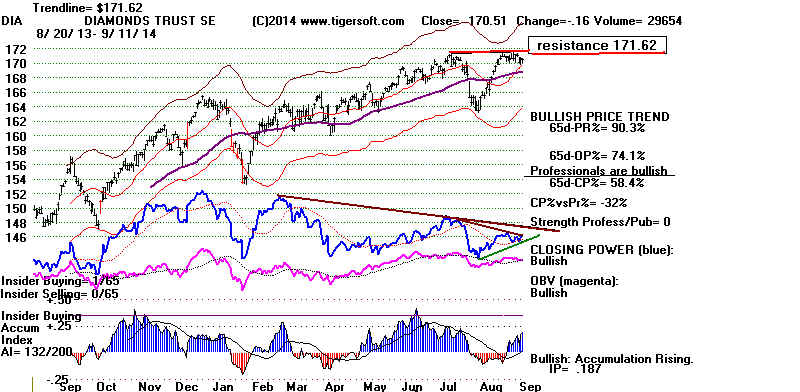
The links below have been fixed.
> To Key Index and Leading Stock Charts: DJI, SP-500, etc.
Peerless DJI Chart SPY Chart NASDAQ Chart QQQ
Chart
IBB Chart
IWM Chart
Hourly DJI-OBV Hourly-MVM0735
FAS-3x Financials IBB-Biotechs
-----------------------------------------------------------------------------------------------------------------------------------
The market now is dividing itself into clear winners and losers. Though
this is a sign of an aging market, we can play the trends of Closing Power to
advantage now and get out quickly when the CP uptrends are violated, especially
if there is red high volume reversal days after big advances. We have been
suggesting
shorting the weak natural resource stocks, especially in coal and also the Yen.
Though retail stocks have been weak, the stronger Dollar will help them a lot
as importers. Domestic auto makers like Ford will have a hard time.
-->78 +35 MAXCP stocks Bullish MAXCP Stocks (9/11/2014)
Bullish plurality
Highest A/I 200 DJI-30 Stock - CAT
--> 58 -73 MINCP stocks Bearish MINCP Stocks
(9/11/2014)
--> 38
+4 New Highs on NASDAQ
20 -4 new lows. Bullish plurality
--> 30
New Highs on NYSE 16 -5 new lows. Bullish
plurality
-----------------------------------------------------------------------------------------------------------------------------------
Caution is still warranted because it's September, because the signs of
a bearish deflation are growing and because the DJI's ceiling or resistance
level is less than 200 points away. This does not give much headroom
for a rally.
August and September Buy B20s are weak
Buys. So any rally now is
probably not going to be strong enough now to break the DJI above
the well-tested flat resistance at 171650. So, staying hedged still seems
reasonable.
Historically a narrow and flat trading DJI range in a bull market is
most likely to bring a 2%-3% retreat, not a big decline. See the
earlier cases of this
type of pattern.
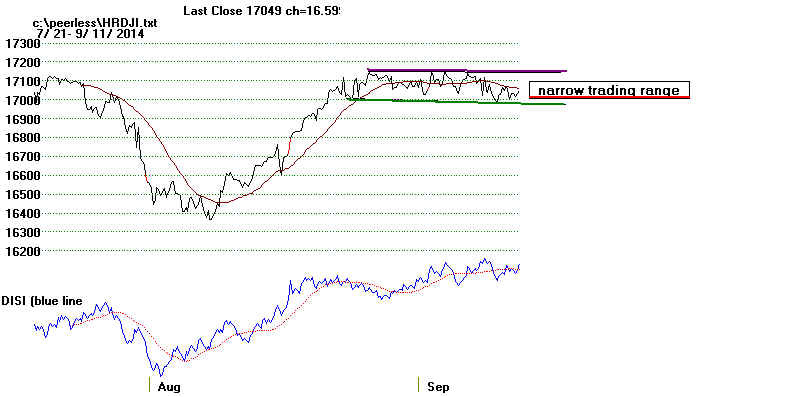
====================================================================================
OLDER HOTLINES
====================================================================================
9/10/2014 The DJI
got back above its 17000 support after an early downside
penetration. Bank, biotech and airline stocks rose nicely but
crude oil, coal and oil/gas stocks continued their declines, as did the Yen.
The existing B20 is not a strong signal at this time of the year, but
big declines do not usually start without more weakness in the A/D Line.
a head/shoulders' top or negative divergences by the IP21, V-I or P-I
on a rally closer to the upper band. Most likely, any DJI decline
below 17000 should be shallow, not more than 3%. There were less than
200 up than down today. So, this was not a convincing reversal.
Hedging is what I have recommended. The stock market has become
divided more and more into rising and falling stocks. Hedging with
some of the "bearish MINCP" stocks remains my
preference for trading
now out of respect for the frequent weakness September produces and
because the ETFs' Closing Powers have broken their uptrends following
CP failures to confirm the price-recoveries.
> To Key Index and Leading Stock Charts: DJI, SP-500, etc.
Peerless DJI Chart SPY Chart NASDAQ Chart QQQ
Chart
IBB Chart
IWM Chart
Hourly DJI-OBV Hourly-MVM0735
FAS-3x Financials IBB-Biotechs
-----------------------------------------------------------------------------------------------------------------------------------
-->43 -45 MAXCP stocks Bullish MAXCP Stocks (9/10/2014)
Highest A/I 200 DJI-30 Stock - CAT
--> 133 -15 MINCP stocks Bearish MINCP Stocks
(9/10/2014) Bearish plurality
--> 34
+19 New Highs on NASDAQ
24 -5 new lows. Bullish plurality
--> 30
+10 New Highs on NYSE 21 -1 new lows. Bullish
plurality
-----------------------------------------------------------------------------------------------------------------------------------
How Different Trading Tools Compare
on DIA in 2013-2014
Judged CP trend-breaks + 26.2% are the
best with the major market ETFs
most of the time. Use them when the
CP trend is well tested, when the CP trend
probably becomes too steep to maintain, after a
CP non-confirmation of a price move
and with stocks after extreme moves and red
high volume at the upper bands.
Practice placing them on charts. It
quickly becomes much easier to spot likely
reversals. You can put Buy and Sell
arrows on the trend-breaks using
Lines + Vertical Lines:User Set B28,
S29 Signals
and then Operations + What
Happens To $10,000
Judged Tiger Closing Power Trend-Changes Gain = +26.2%
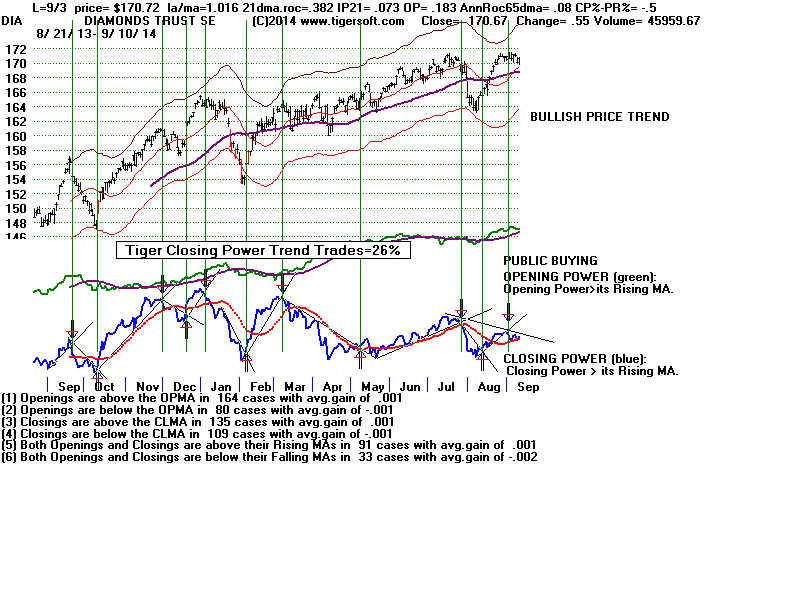 |
Various Length Stochastics' Results
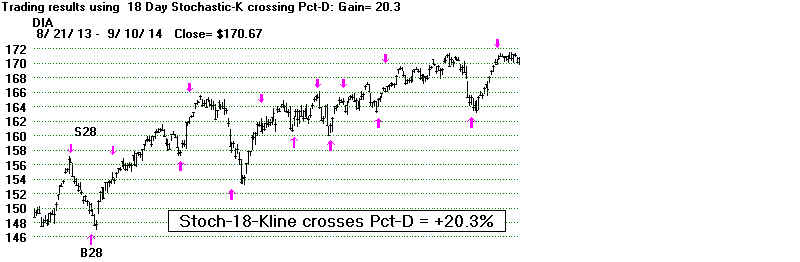
--------------------------------------------------------------------------------------------------------------------------
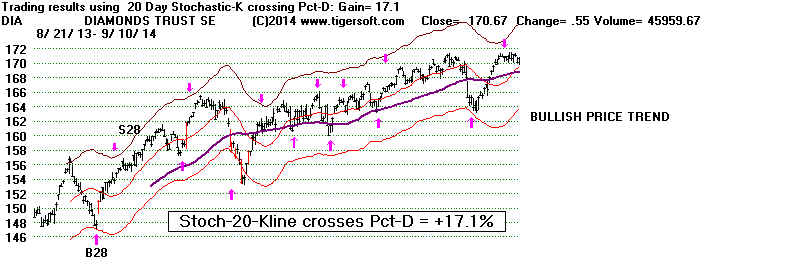
--------------------------------------------------------------------------------------------------------------------------
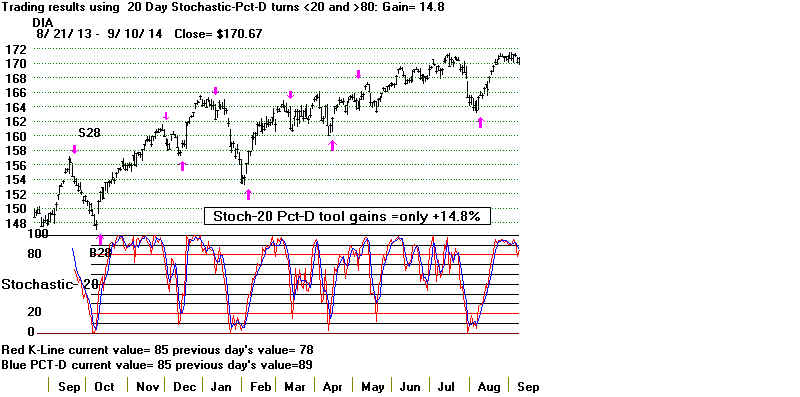 |
Opening Power Trend-Breaks gain 7%
|
MACD gains 6%
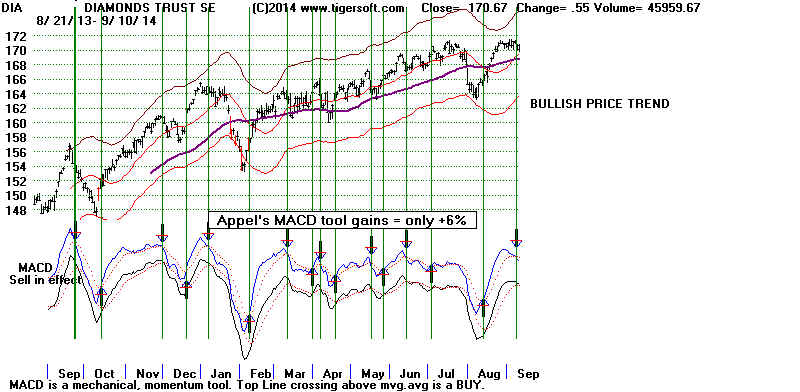 |
====================================================================================
OLDER HOTLINES
====================================================================================
9/9/2014 The
DJI's Hourly Well-tested Support is at 17000. If that
level gives way, the DJI should next find some support at
its rising 65-dma one hundred points lower. This is not
far away, but I would suggest staying fully hedged like
our Stocks' Hotline is. Bad things often happen to the market
in September and the key ETFs' Closing Powers have established
steep, minor downtrends with today's sell-off.
New research on breakdowns from narrow and flat DJI trading
ranges like the DJI is now in suggests only a 2%-3% additional pullback
with a 33% chance that the breakdown will be false.
Hourly DJI
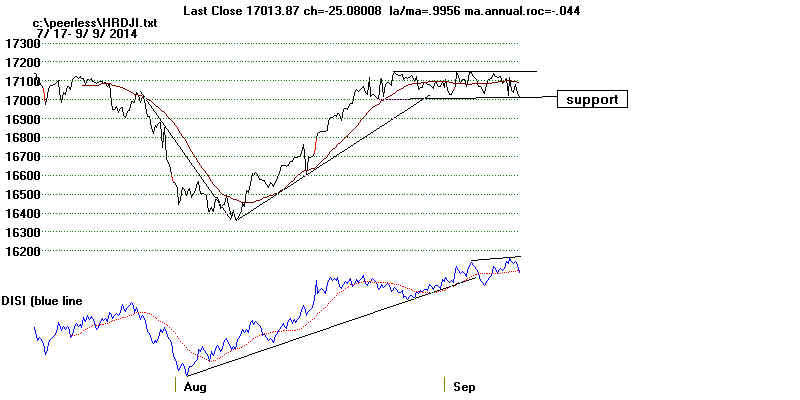
The best support for the DJI is probably at 16400.
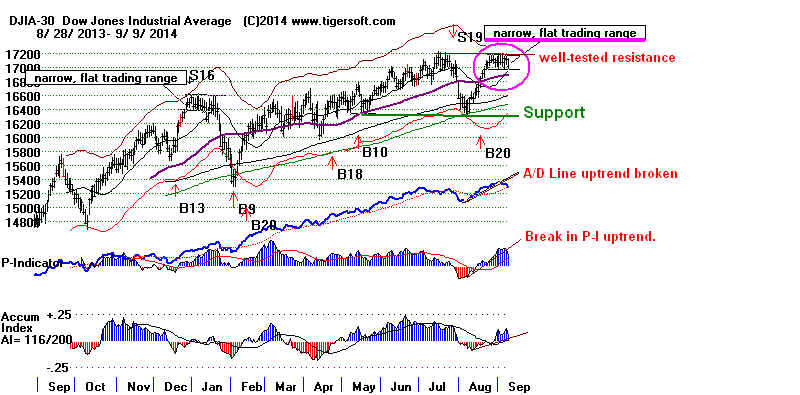
Professionals are now net sellers.
Note Closing Power Downtrend.
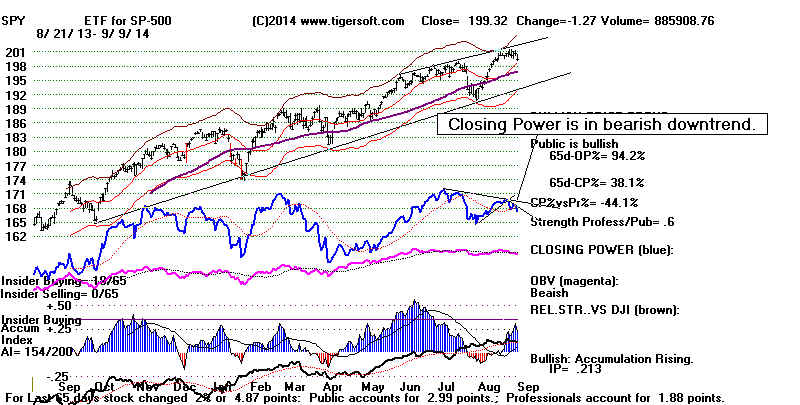
> To Key Index and Leading Stock Charts: DJI,
SP-500, etc.
Peerless DJI Chart SPY Chart NASDAQ Chart QQQ
Chart
IBB Chart
IWM Chart
Hourly DJI-OBV Hourly-MVM0735
FAS-3x Financials IBB-Biotechs
-----------------------------------------------------------------------------------------------------------------------------------
-->43 -45 MAXCP stocks Bullish MAXCP Stocks (9/9/2014)
Highest A/I 200 DJI-30 Stock - CAT
--> 148 +68 MINCP stocks Bearish MINCP Stocks (9/9/2014)
Bearish
plurality
--> 15
-31 New Highs on NASDAQ
29 +9 new lows. Bearish
plurality
--> 20
-31 New Highs on NYSE 22 +9 new lows. Bearish
plurality
The DJI's price pattern for the last 10 or so trading days may be
described as narrow and flat with well-defined and well-tested
support and resistance. Short-term, a close below 17000 should
bring additional weakness. This would be in accord with typical
September weakness and the falling Closing Powers. I have suggested
hedging by shorting some of the bearish MINCP stocks while
being long some of the still bullish MAXCP stocks so long as their
Closing Powers are intact.
How bearish would a DJI drop below the 17000 well-tested hourly
support be? Let's look back and see what has happened in the past when the DJI
down from a brief, flat and particularly narrow trading range. The
hourly DJI, I should add can be considered a "cup and handle" pattern,
too, though it comes not at a bottom, but far along in a bull market.
At bottoms, such patterns are reliably bullish when there
is an upside breakout. But what are they when the bottom of the handle
(or the well tested horrizontal support) breaks and gives way. I looked for
all such pattern in on-going bull markets back to 1929. The average
decline was 2.2%. In 33% of the cases, the price break-down proved
to be a false-breakdown. See the charts here.
Flat, Narrow DJI
Trading Range Breakdowns:
1929-2014
Breakdowns (9)
January 1956 - 3.5% decline to rising 200-dma
January 1962 - 3% decline to 4 month low.
September 1978 - False breakdown.
July 1989 - False breakdown.
April 1992 - False breakdown.
July 1992 - 4% decline to two month low.
November 2003 - 2% decline.
April 2012 - 2% decline.
January 2014 - 5% decline.
----------------------------------------------
Avg. Decline = 2.2%
|
====================================================================================
OLDER HOTLINES
====================================================================================
9/8/2014
Not
A Very Convincing Decline So Far!
I would think the DJI will try to rally next. But any advance
now will probably be limited.
Hedging May Work Better Now
than Trading Market ETFs
The Dollar's take-off has increased the stock market's
normal
tendency to separate into uptrending and downtrending stocks.
The strong Dollar and way performance funds focus their much
of their attention on the remaining stocks making new highs late
in a bull market are making buying strong stocks and shorting
weak stocks now even more lucrative than usual.
> To Key Index and Leading Stock Charts: DJI, SP-500, etc.
Peerless DJI Chart SPY Chart NASDAQ Chart QQQ
Chart
IBB Chart
IWM Chart
Hourly DJI-OBV Hourly-MVM0735
FAS-3x Financials IBB-Biotechs
-----------------------------------------------------------------------------------------------------------------------------------
-->88 +3 MAXCP stocks Bullish MAXCP Stocks (9/8/2014) Bullish plurality
Highest A/I 200 DJI-30 Stock - CAT
--> 84 -13 MINCP stocks Bearish MINCP Stocks (9/8/2014)
--> 46
+4 New Highs on NASDAQ
20 -6 new lows. Bullish plurality
--> 51
-20 New Highs on NYSE 13 +3 new lows. Bullish plurality
The DJI is trapped in a narrow trading range. The Hourly DJI below
shows just how narrow the trading range is. Since the resistance and
support levels are flat, I would think that there will soon be a quick move
following the DJI's escape from this tight range. Very short-term
traders should be able to scalp a few points by trading with the breakout
or breakdown.
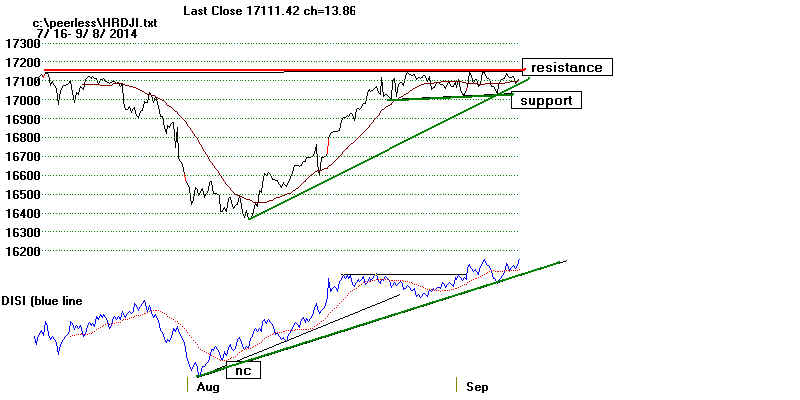
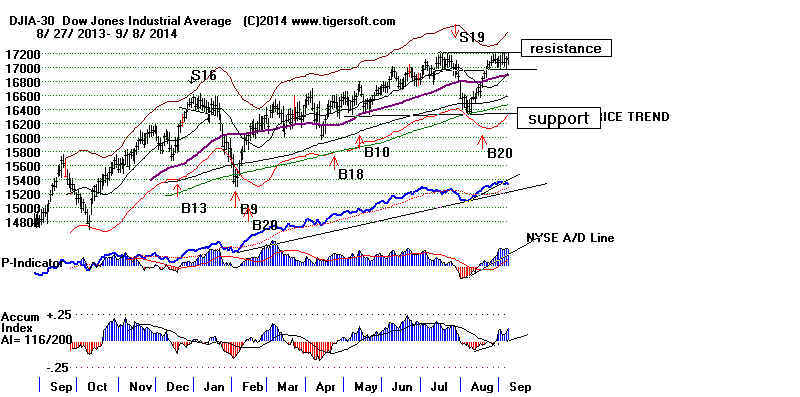
Which way will the market jump?
The Buy B20 and exceptionally strong Dollar say that an
upside breakout is likely but Septembers have a well-deserved
reputation for bring about declines. The Closing Powers are still in gentle
downtrends. See DIA, SPY,
QQQ, IWM and MDY.
Peerless Is Still Bullish
A new Peerless Sell is not likely. We can go through
the list of possible Peerless Sells
and see that both the Sell S4
(IP21 drops below its 21-day) and Sell
S8 (very low volatility)
might occur much later this month since the DJI is up more than 11% since early February
and the Peerless code looks closely at the DJI when it has risen this much. Both
Sells
require a significant DJI rally first. For the S4, the IP21 for the DJI is still too
far above
its 21-day ma. For the S8, and the daily percent change's volatility for the DJI is
now low, but it to get even lower and stay low for five ot six more trading days.
We have no Sell signal that targets Septembers. Normally tops at this time of year occur
when the DJI rises to the 2.5% upper band or higher but only when we see much lower
P-I, V-I and Accumulation Index readings than are now present. So, the DJI would
next need to breakout past 17200 on very poor breadth and volume. As
it now stands,
a breakout is more likely to bring a reinforcing Buy B10 than not.
-----------------------------------------------------------------------------------------------------------------------
Peerless: 1928-2014 Materials
See the updated complete list of Peerless Buys and Sells and their individual track
records
since 1928 here. More
materials will be added to these pages until the new Peerless
book is done.
-----------------------------------------------------------------------------------------------------------------------
Big Banks' Chart Is Bullishly Uptrending Now
Just 7 banks dominate the US banking system. Below is the Tiger index of
these stocks, all considered by the Fed and the Obama Administration as
much too big too fail. So, they get still bigger and now dominate much of the
shadow trading of US stocks. Their uptrend is essential for a bull market
to continue.
Bank of America: 2,019 subsidiaries, with a total asset value of $2.14 trillion.
JPMorgan Chase: 3,391 subsidiaries, with a total asset value of $2.27 trillion.
Citigroup: 1,645 subsidiaries, with a total asset value of $1.87 trillion.
Wells Fargo: 1,366 subsidiaries, with a total asset value of $1.31 trillion.
Goldman Sachs: 3,115 subsidiaries, with a total asset value of $924 billion.
MetLife: 163 subsidiaries, with a total asset value of $800 billion.
Morgan Stanley: 2,884 subsidiaries, with a total asset value of $750 billion.
(2012
Statistics.)
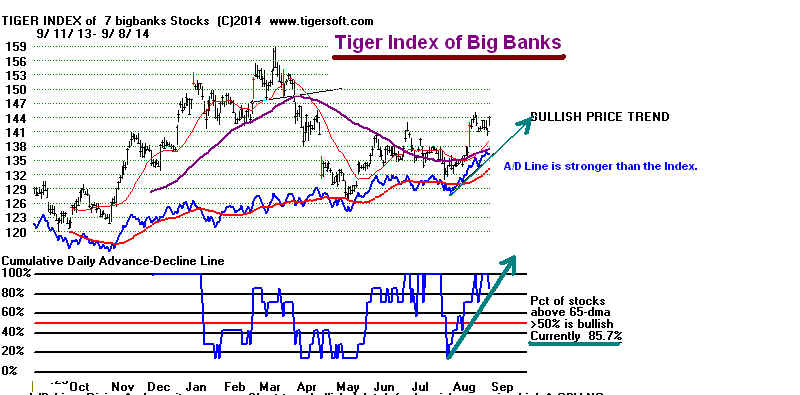
====================================================================================
9/5/2014|
A Muted Rally is about all the bulls can hope for. Meanwhile,
all the bears have to do to make their case is point to the
Calendar.
Further research on the Buy B20s shows that its occurrence in
August and September is much weaker than at other times of the
year. Instead of averaging 12% per instance, B20s only averaged
+2.7% gains at this time of year.
August-Sept Buy B20s are
much weaker.
Date
Pct Gain Paper Loss
------------------------------------------------
#1 8/2/1933
+.049 .
+ 2.3%
#2 9/2/1975
+.018
None
#3 8/31/2007 +.034
+ 1.9%
#4 8/17/1934 +.016
+ 1.8%
------------------------------------------------
Avg. 2.7% |
> To
Key Index and Leading Stock Charts: DJI, SP-500, etc.
Peerless DJI Chart SPY Chart NASDAQ Chart QQQ
Chart
IBB Chart
IWM Chart
Hourly DJI-OBV Hourly-MVM0735
FAS-3x Financials IBB-Biotechs
-----------------------------------------------------------------------------------------------------------------------------------
-->85 +33 MAXCP stocks Bullish MAXCP Stocks (9/5/2014)
Highest A/I 200 DJI-30 Stock - CAT
--> 97 -38 MINCP stocks Bearish MINCP Stocks (9/5/2014)
Bearish plurality
--> 42
+7 New Highs on NASDAQ
26 new lows. Bullish plurality
--> 71
+21 New Highs on NYSE 10 new lows. Bullish plurality
Watch Those Crafty Professionals!
Peerless has given no new Sell and Professionals did do a lot
of buying
a
fter the opening on Friday. However, the Closing Powers
for all the
key ETFs are in minor downtrends. The good news for bulls is
that
the biggest ETF's case (SPY below) shows important bullish signs.
I would think any decline here will be shallow, too. :
1) There is no red or blue optimized Stochastic Sell.
2) There has been a recent IP21 surge and Buy B17.
3) Both Opening and Closing Power are rising.
4) It would not take much higher close than an opening
here to break the CP downtrendline, about +.75 on SPY
on Monday.
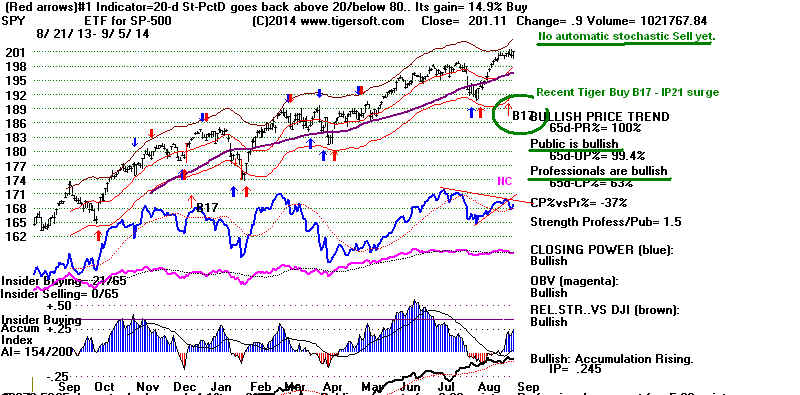
Seasonality is the key problem now. The DJI has rallied only
44.7% of the time
in the month after September 7th. Why? Traders worry about another 9/11.
They anticipate the change in market psychology as Summer turns to Autumn
and days get shorter and darker. They know, too, that the market now
must absorb vast amounts of stock selling to pay for kids going to college.
If anything, the September effect is made worse now by the huge rise in the
cost of going to college. This alone will likely mute any rally attempt even if the
Hourly DJI were to breakout by surpassing 17155, even if
the SP-500 could get clearly
above its 2000-2020 psychological barrier and even if the NASDAQ
made
new highs above 4625.
The College Tuition Bubble
Small wonder the middle class is disappearing. Annual tuition and room/ board now
costs $55.000+ at some private colleges. It's $20,400 at the Univ. of Michigan
and
$29,000 at the University of California at San Diego. Where I went to college, it
was
only $2000 in 1960. Now tuition is up 2700% since the early 1960s. Working in
the
Alumni Office for $1.25 (the minimum wage then), it would have taken me 1600 hours
to pay this off each year. Today, Connecticut boasts about its $10.10 minimum wage.
But, the sad truth is it would take a student now more than 5500 hours to pay off a year's
room and board tuition at an Ivy league college if he nothing was upheld, which is
hardly the case.
Weekly DJI Shows Breakout
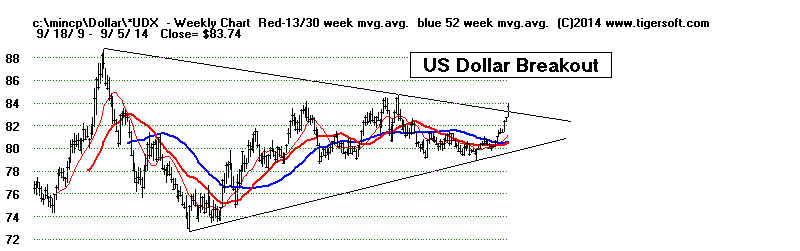

Friday's Jobs' Report showed there was still plenty of need for
economic stimulus
in the US. The Euro Zone's bosses now say they will be providing more monetary
stimulus there. The latter news and Europe's recession has boosted the Dollar
and made investing in US dividend and some blue chips look more attractive.
The rising Dollar has helped those big DJI-30 stocks that benefit from a strong dollar.
For example, WMT and HD sell mostly imported goods. So they love this strong
Dollar because what they buy overseas is that much cheaper. In general, a strong
Dollar
is bullish for most US non-manufacturing companies as long as a recession does not
develop that hurts profits. Thus, the market's big advance from 1995 to 2000
was boosted by the Dollar's upside breakout in 1996. Wall Street banks also usually
like a strong Dollar because it helps set the Dollar up as the most important
medium of exhange and there is more need for US banking services.
Professionals definitely like Walmart.
See how the Closing Power is catching up with prices and note the Buy B17,
that shows a big jump in Accumulation by institutions.
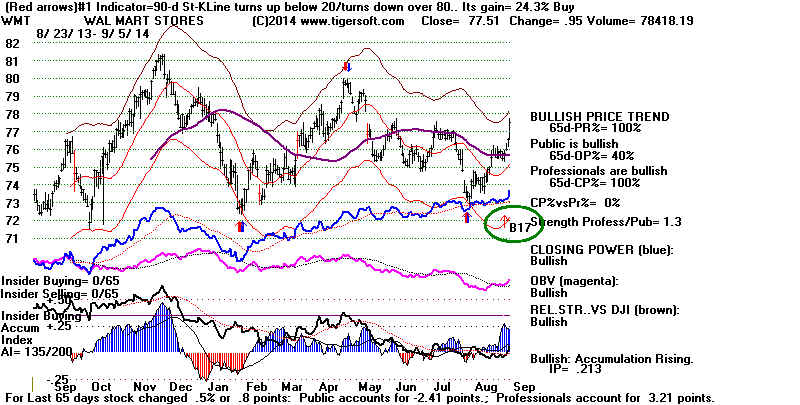
Several DJI-30 stocks recently made attractive breakouts: MSFT
(below),
NKE and UNH show new highs and recent bulges of Accumulation. DIS might
soon do the same and MRK's new high could lead biotechs back up. The
first three, MSFT, NKE and UNH should be used as long positions I think
nowby those who want to hedge their way past this the most treacherous
six weeks of the year.
On the other hand, bank, exporters BA and UTX fell further below their falling
65-dma. I doubt if we will see a big advance this September. The bank
and
credit card stocks, AXP, MA and MA) do not appear ready to participate in
a rally. The middle class is hurting too much and the rich are more into
hoarding
now than at any time in 60+ years when the Fed began keeping records on
Money Velocity. Retail spending is slow but retail profits will be helped
because imported clothes will be cheaper.
.
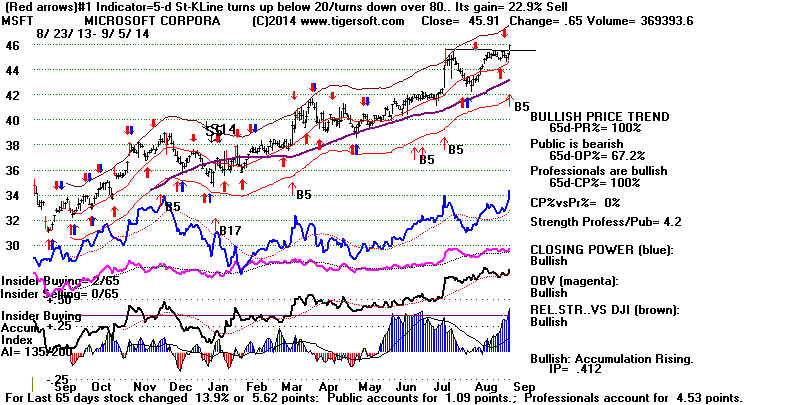
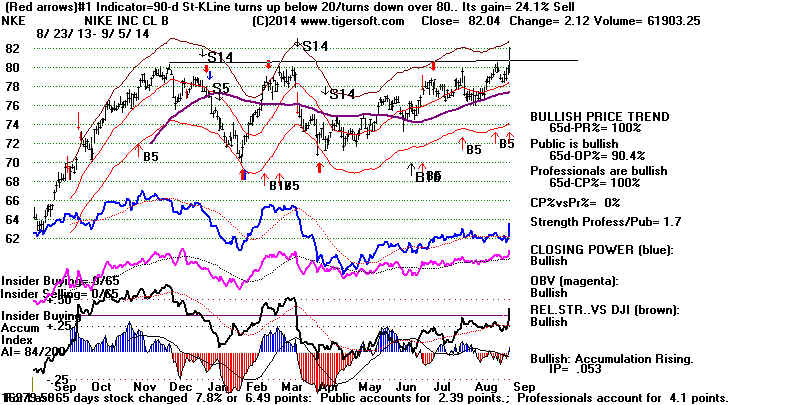
====================================================================================
OLDER HOTLINES
====================================================================================
9/4/2014|
Stay Fully Hedged even though Peerless Has Given No New Sell.
The bearish
seasonality for the next six weeks should keep
us on guard. The
Fed apparently appreciates the bearish
seasonality.
Their Quantitative Easing programs have actually
caused the DJI to
rally in 3 of the last five Septembers.
But this year
faces greater challenges, in part because of
how long the
markets have risen without a 10% correction and
because of how
great the disparity is between Wall Street and
Main Street.
Add to this mix the uncertainties of the weakening
European economy,
September terrorist threats and the new Cold
War and it's
clear caution is warranted.
The DIA chart below shows Peerless buys and sells. They have the red
arrows and are numbered in black. The pink circled S4 and S7s show
warnings that Closing Power is lagging the price action. The red popsicle
S1s warn that prices closed far below a much higher opening.
If the DIA drops below 168 and the 65-dma, the next support is
down at 163.
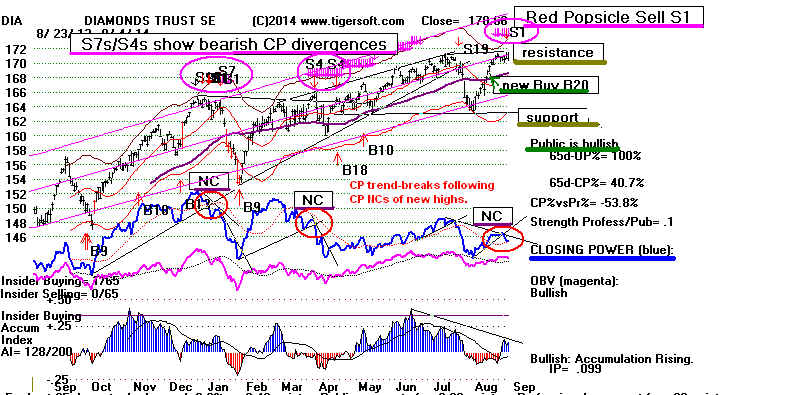 |
Yesterday, the Closing Power uptrends were violated for all
the major market
ETFs. Today, there were 1000 more down than
up on the NYSE
despite the DJI's showing a slight gain for
the day. The
Dollar's big jump today does make US stocks
more attractive
than those in Europe or Japan to the hot
international
money that sloshes around always looking for
slight
advantages. But unless the FED can find another way
to stimulate the
markets very soon, I would think the DJI and
SP-500 will have
to test their rising 65-dma very soon.
I mentioned last
night that I thought it was highly significant
that wealthy
Americans are so fearful now that the "velocity"
of money, as
measured by the St. Louis Fed, is at a 50-year low.
If big money
starts to add to their piles of cash by selling
stocks, a panic
could quickly follow. If that happens we could
easily see a 10%
drop, despite how reliably bullish the
new Buy B20 has
been in the past.
That is why I
would trust the Professionals' behavior now
to tell us what
to do. Right now the DIA's and SPY's Closing
Power uptrends
have been violated. And, what is more bearish,
these CP
trend-breaks have occurred after the CPs failed
to make new highs
on their last rallies as prices did.
> To Key
Index and Leading Stock Charts: DJI, SP-500, etc.
Peerless DJI Chart SPY Chart NASDAQ Chart QQQ
Chart
IBB Chart
IWM Chart
Hourly DJI-OBV Hourly-MVM0735
FAS-3x Financials IBB-Biotechs
-----------------------------------------------------------------------------------------------------------------------------------
-->52 -25 MAXCP stocks Bullish MAXCP Stocks (9/4/2014)
Highest A/I 200 DJI-30 Stock - CAT
--> 135 +27 MINCP stocks Bearish MINCP Stocks (9/4/2014)
Bearish plurality
--> 35
-17 New Highs on NASDAQ
26 +5 new lows. Bullish plurality
--> 49
-28 New Highs on NYSE 19 new lows. Bullish plurality
-------------------------------------------------------------------------------------------------------------------------
====================================================================================
OLDER HOTLINES
====================================================================================
9/3/2014|
The Markets Look Increasingly
Vulnerable.
Add more short
sales, even though Peerless has not given
a new Sell.
Our Stocks' Hotline will continue to hold IBB
and of the
remaining Bullish MAXCP stocks that continue
to move
higher.
-------------------------------------------------------------------------------------------------------------------------------------
> To Key Index and Leading Stock
Charts: DJI, SP-500, etc.
Peerless DJI Chart
SPY Chart
NASDAQ Chart QQQ Chart
IBB Chart
IWM Chart
Hourly DJI-OBV Hourly-MVM0735
FAS-3x Financials IBB-Biotechs
-----------------------------------------------------------------------------------------------------------------------------------
-->77 -36 MAXCP stocks Bullish MAXCP Stocks (9/3/2014)
Highest A/I 200 DJI-30 Stock - CAT
--> 107 +55 MINCP stocks Bearish MINCP Stocks (9/3/2014) Bearish plurality
--> 52
-27 New Highs on NASDAQ
26 +5 new lows. Bullish plurality
--> 77
-11 New Highs on NYSE 14 new lows. Bullish plurality
-------------------------------------------------------------------------------------------------------------------------
Professionals Have Become Net Sellers
I would shift out of a few more long positions and add some more
short sales. IBB and BBH
are
the only ETFs I would continue to hold long now. Obama today hinted that he would
extend NATO membership to the Ukraine. This would be a most provocative move in the
eyes
of the world's #2 nuclear power, Russia.
(Is
the White House so inept and ignorant
that
they have forgotten how America reacted when Cuba missiles were pointed at us from
just
150 miles away in 1962?)
If
that isn't scary enough, the market's hopes are probably way too high that the Europeon
Central Bank will suddenly end their fixation on the need for more austerity
despite all the evidence that it has failed miserably and Europe is slipping back into
a new
recession.
In
the US, I take it as significant that Visa and MC have been unable to rally for months.
The
74 million Americans on food stamps are certainly not about to increase their
spending and all reports show that wealthier consumers are saving at record levels.
Money movement
("velocity") is at all-time lows. As a class, the wealthy
are
just one step away from selling their stocks, having now decided to sit on the maximum
amount of cash possible. All that it may take for a massive selling spree in
equities
to
occur is for stocks to hesitate a little longer in here, showing a complete loss of upward
momentum) and then turn down. The majority at the Fed, the "doves",
understands how
precarious market psychology is now. So, we may see the FED do something more
to
stimuate stock prices, just as they did in the Autumns of 2011, 2012 and 2013.
Unfortunately, there is more to worry about. The most bearish 21-day
period
of
the year has now arrived. Since 1965, the DJI has risen only 38.3% of the time.
Lastly, Professionals are becoming net sellers. The DIA's Closing Power uptrend
has
been bearishly broken after seriously failing to confirm the move back to 171.
SPY
also decisively broke its Closing Power also after a non-confirmation. This sets up
a
classic Closing Power sell. A decline back to the rising 65-dma down from the
"200"
price-resistance level is what Professionals seem to be expecting.
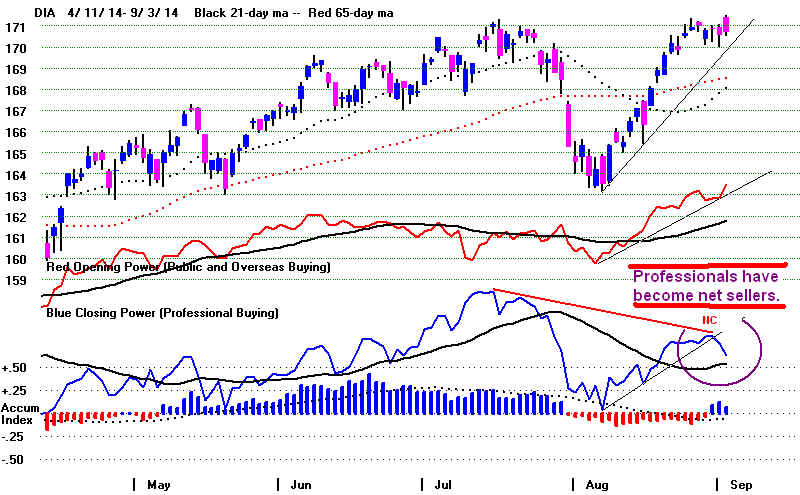
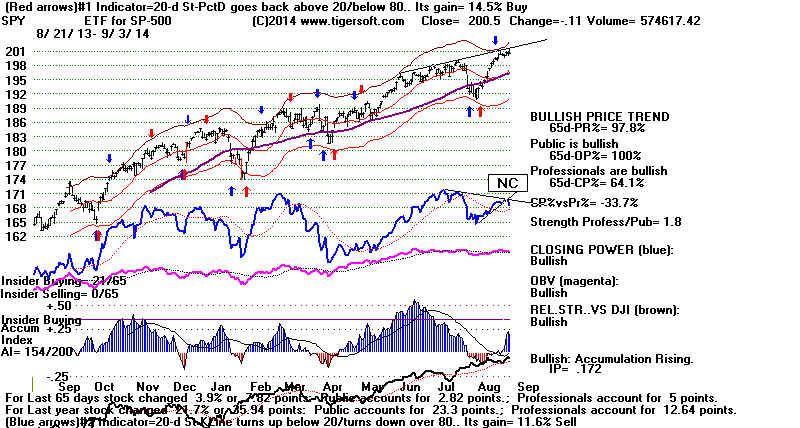
Peerless has not produced a new Sell. This
should reduce the severity of any decline.
That the NYSE's A/D Line rising A/D Line is still rising means that dividend stocks
on the NYSE will probably remain strong.
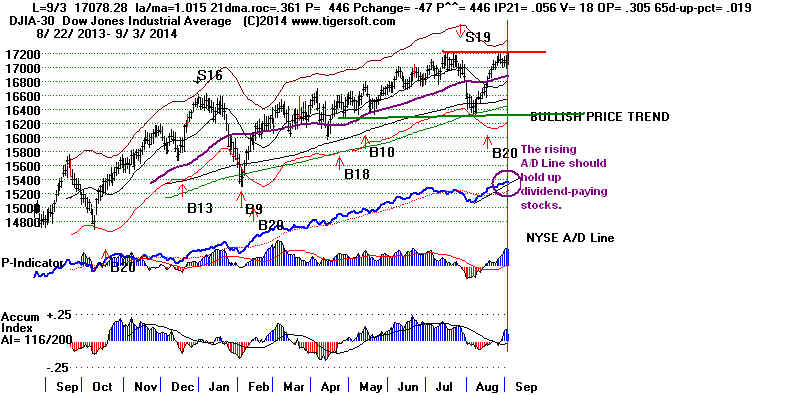
The QQQ also broke its uptrendline. Its weakness owed
much to AAPL's 4.5% sell-off
on the highest volume
in more than four months. A similar decisive break occurred in IWM's
chart. Only IBB's
CP uptrend was not violated.
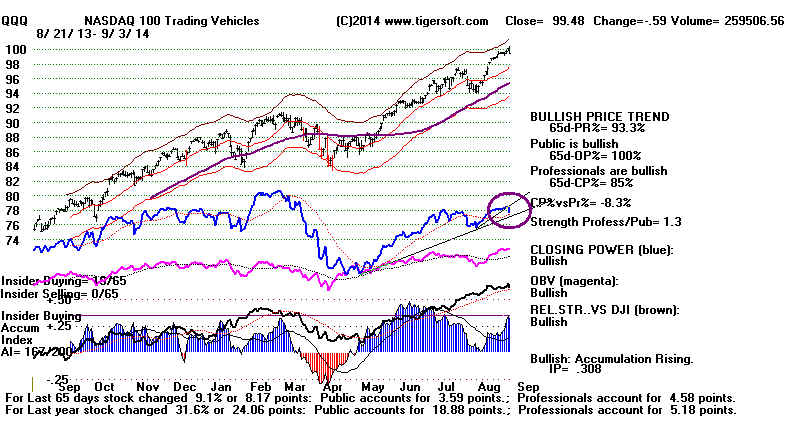
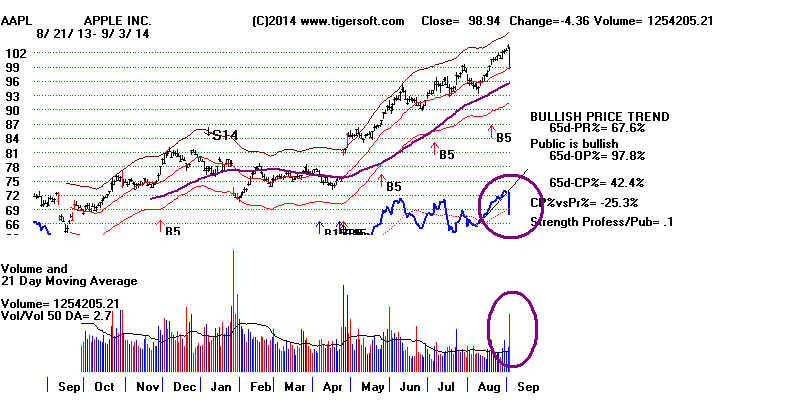
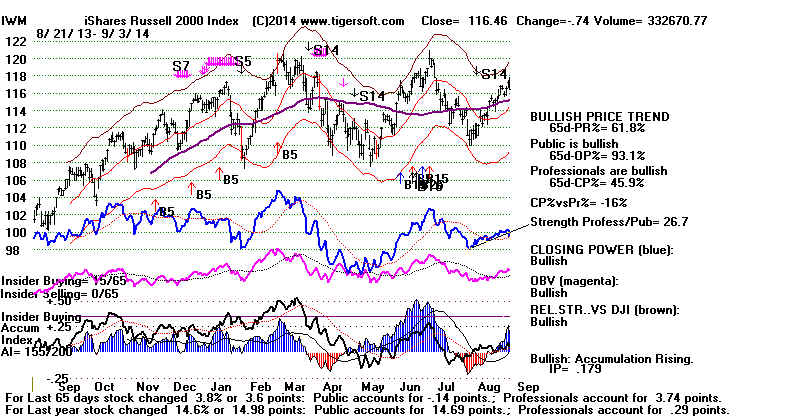
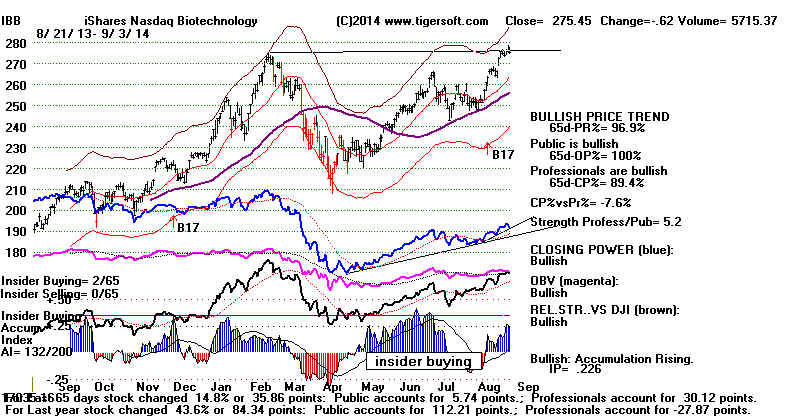
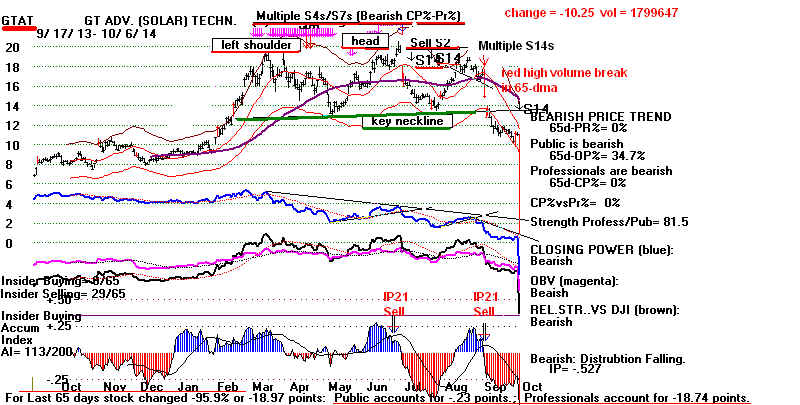
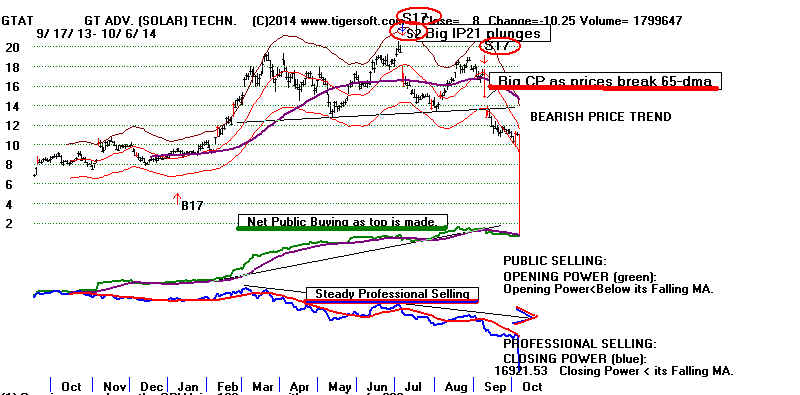
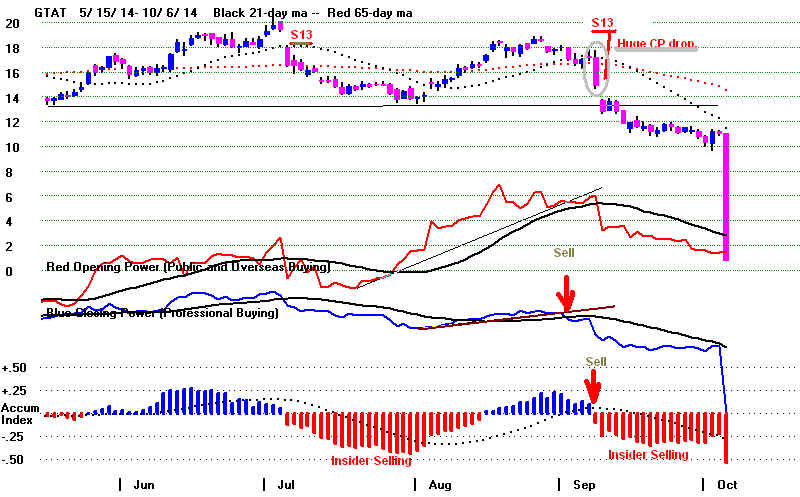
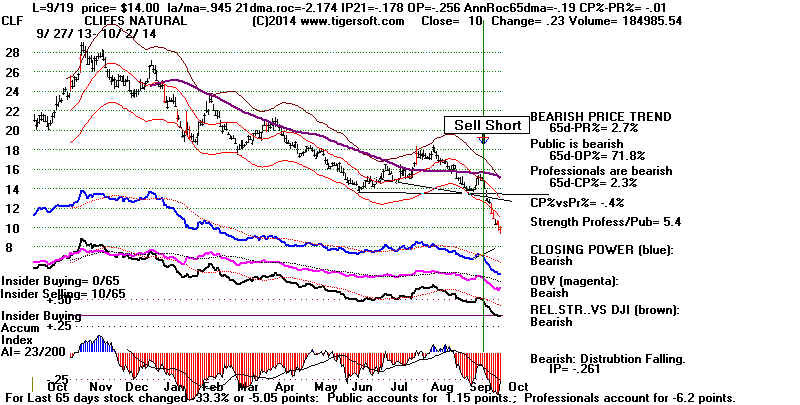
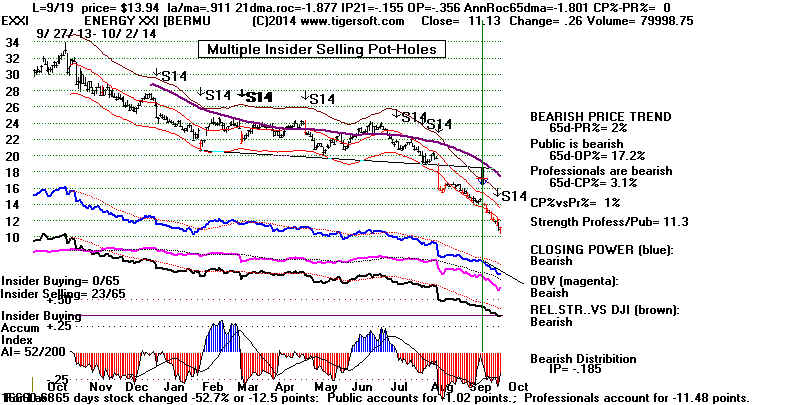
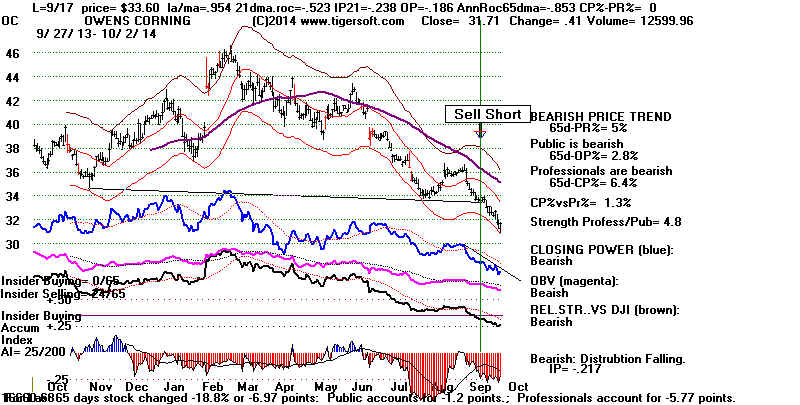
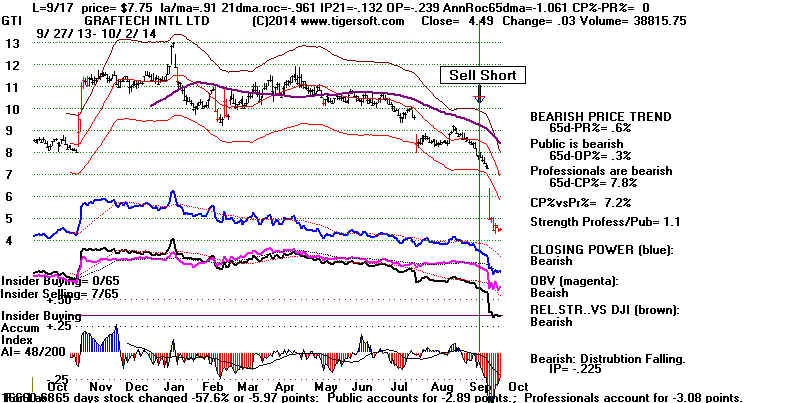
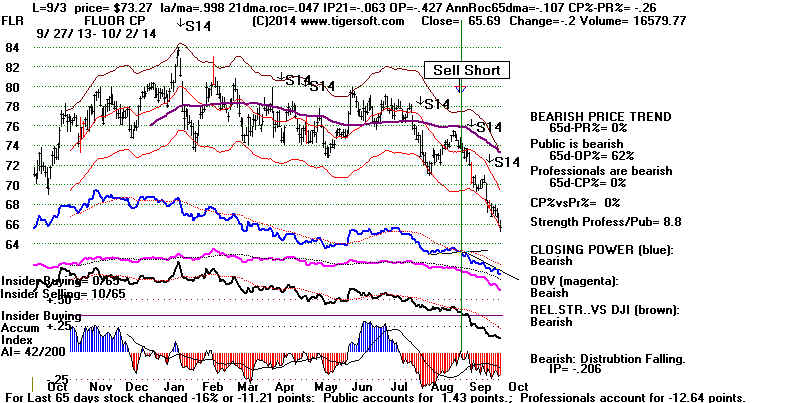
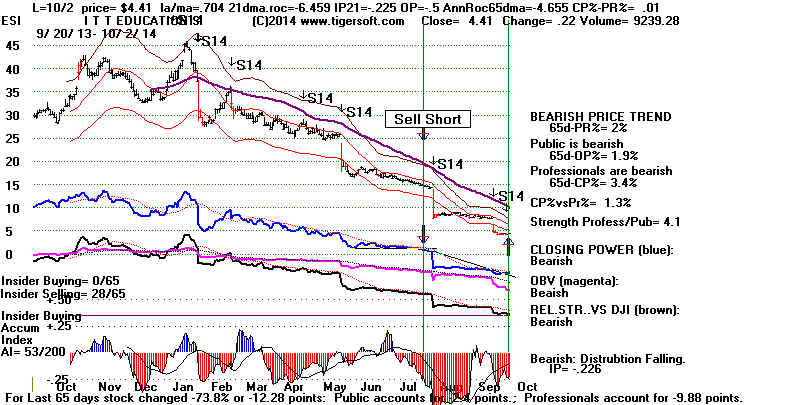
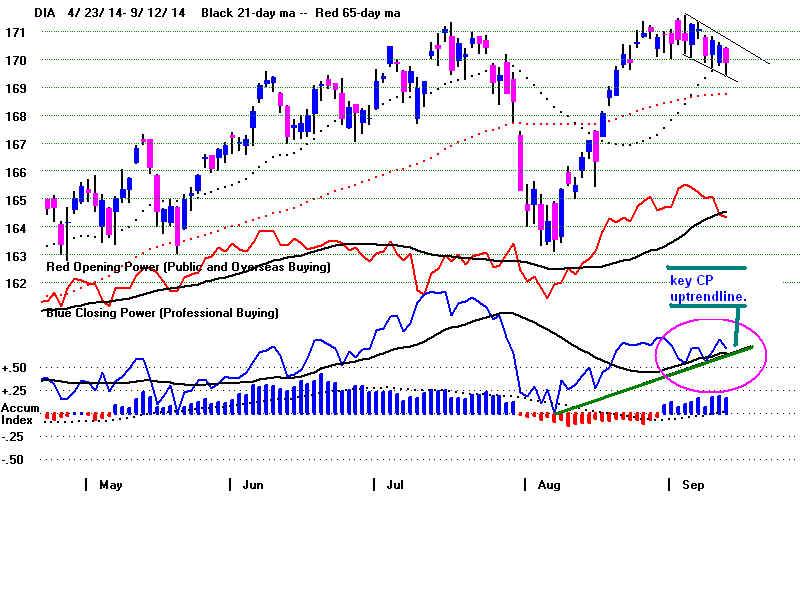
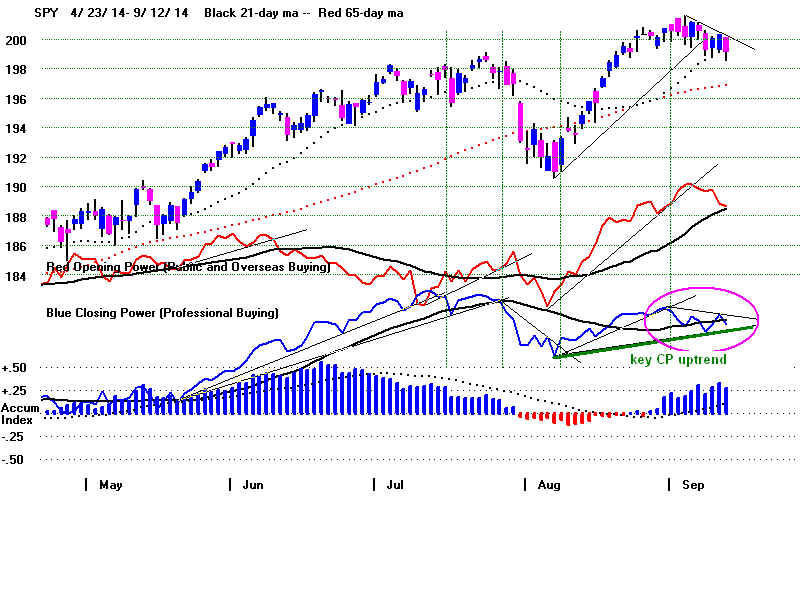
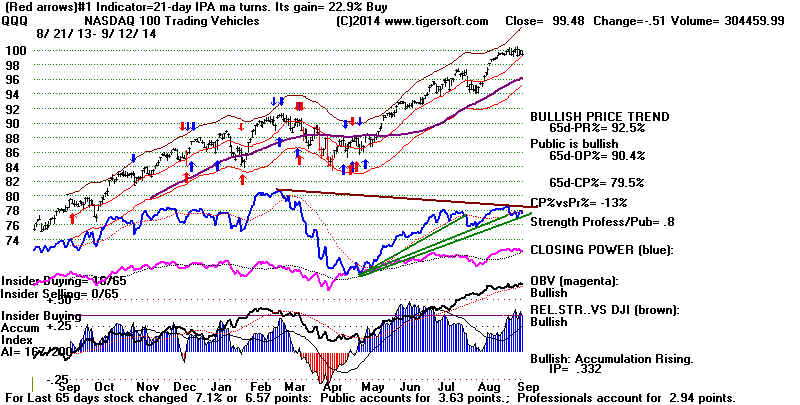
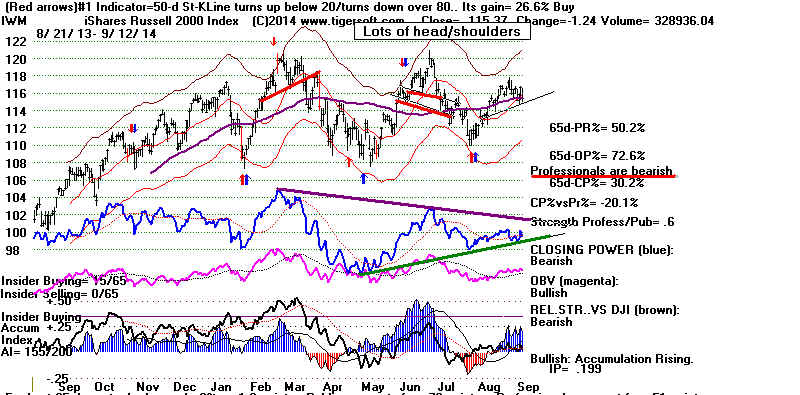
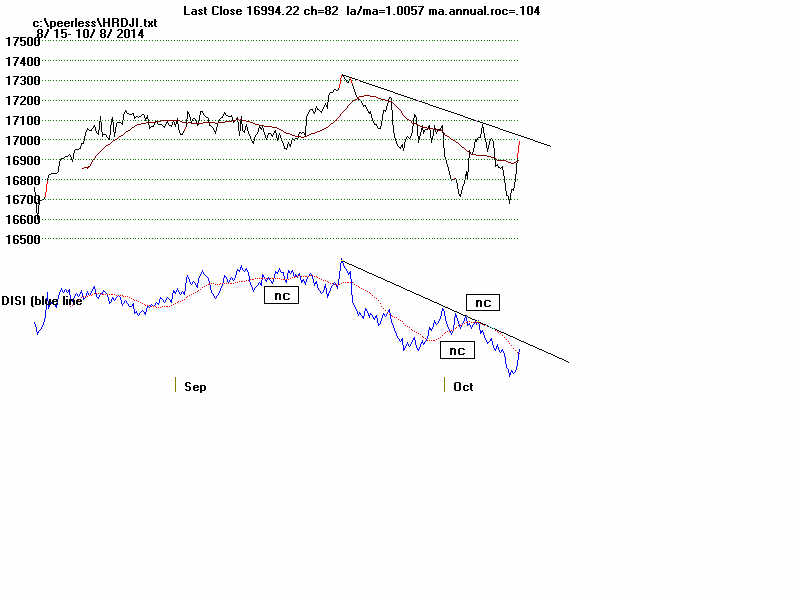
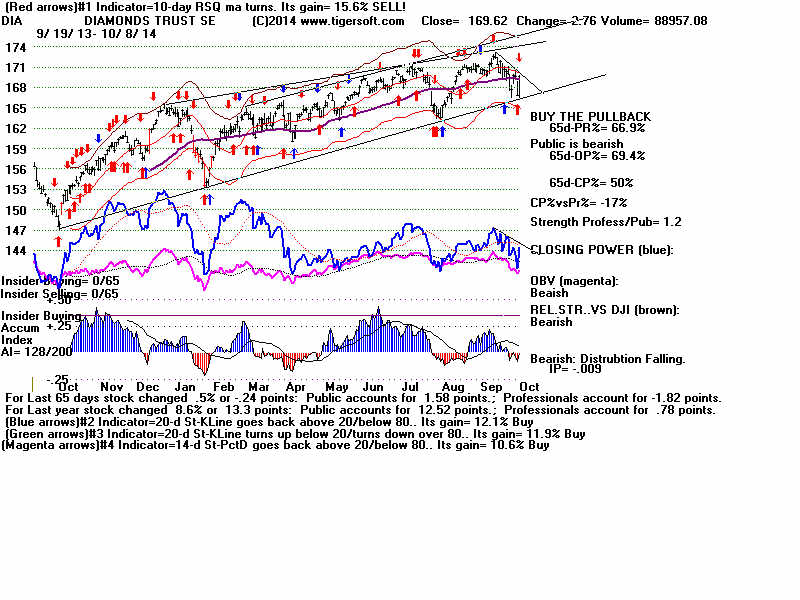
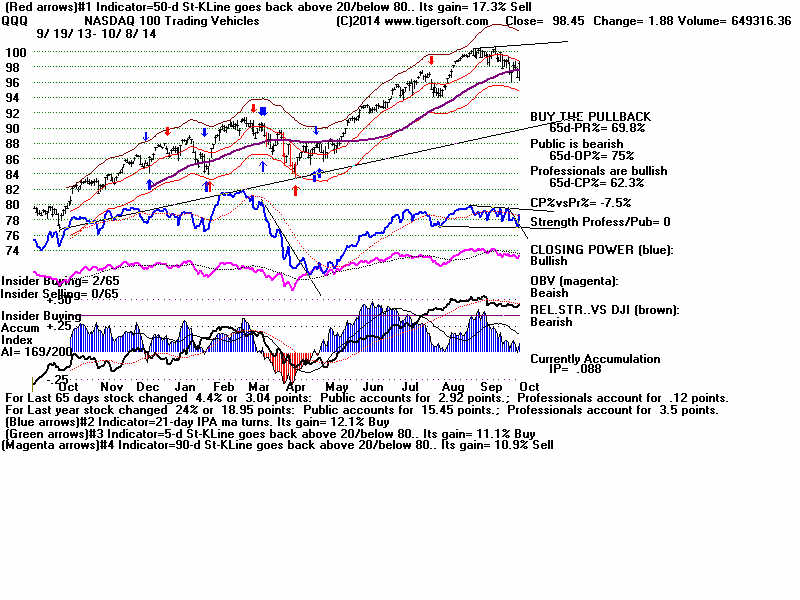
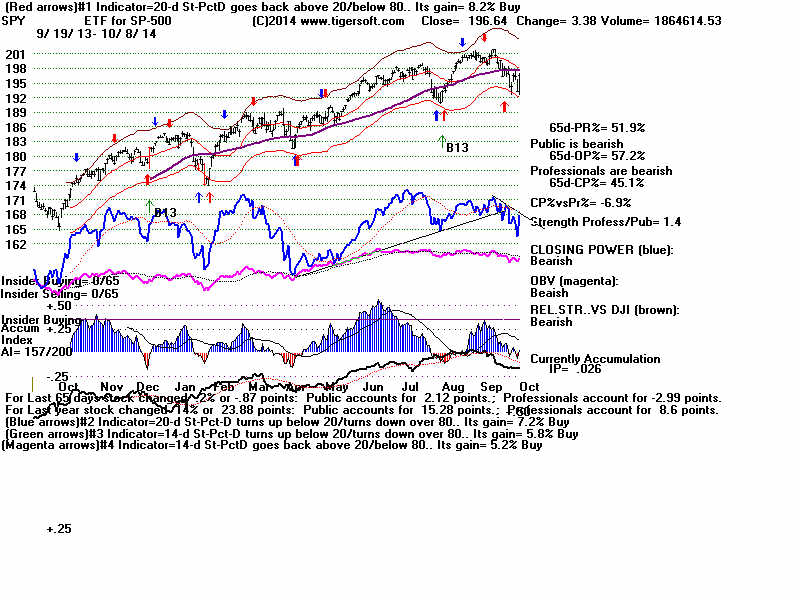
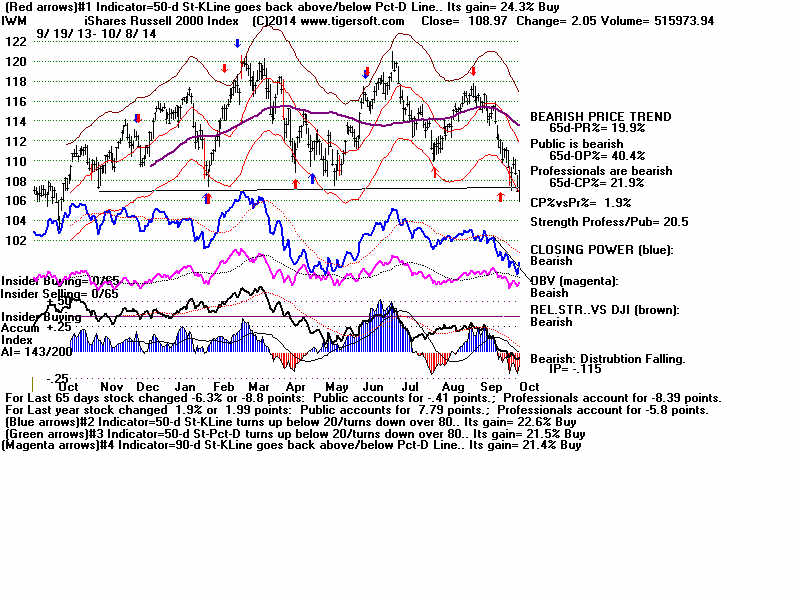
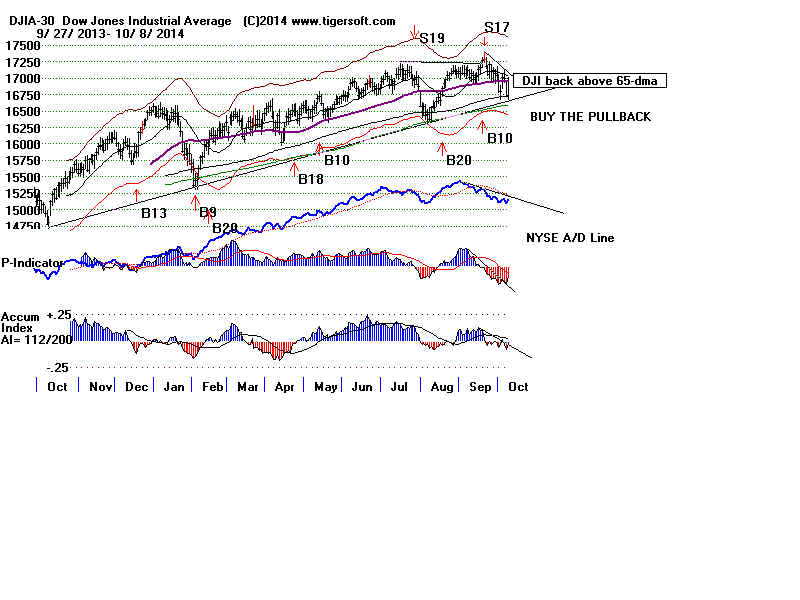
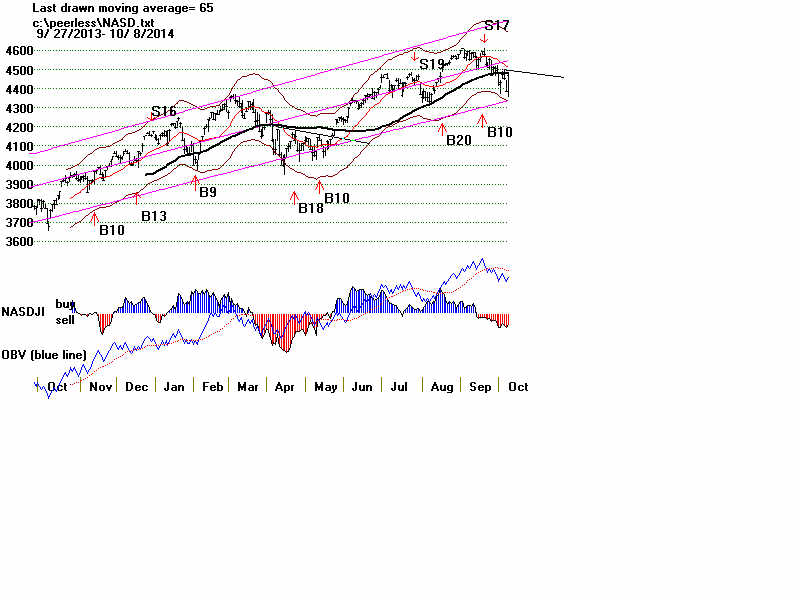
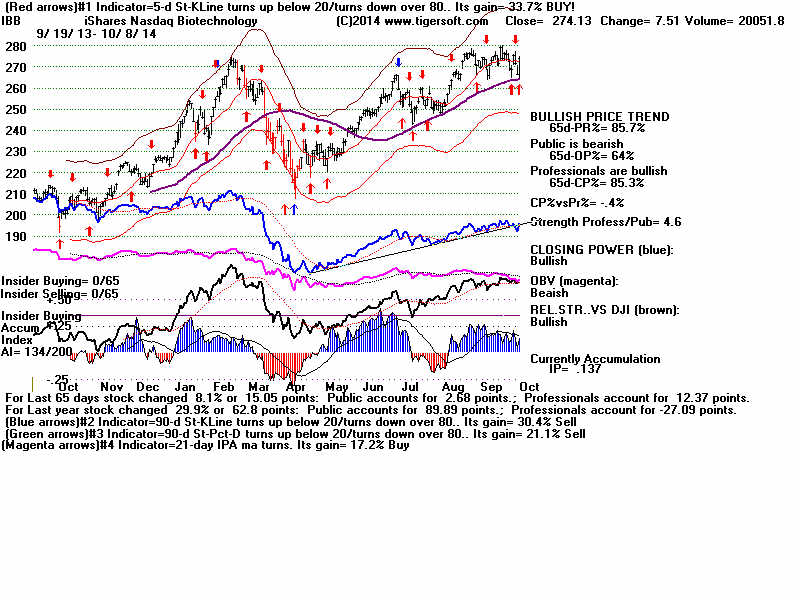
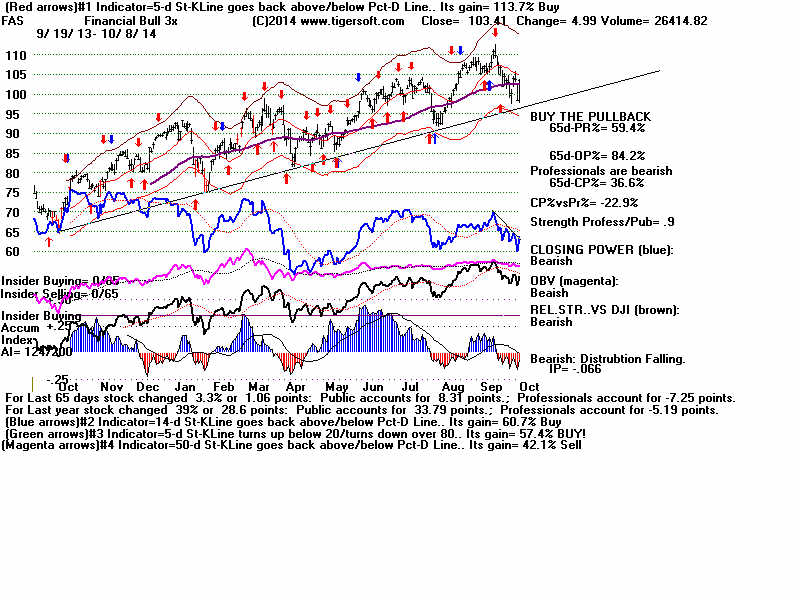
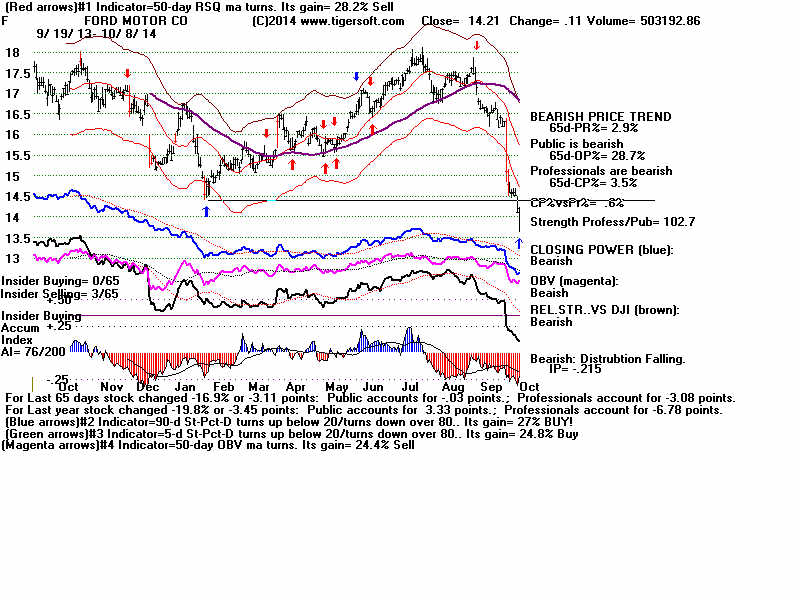
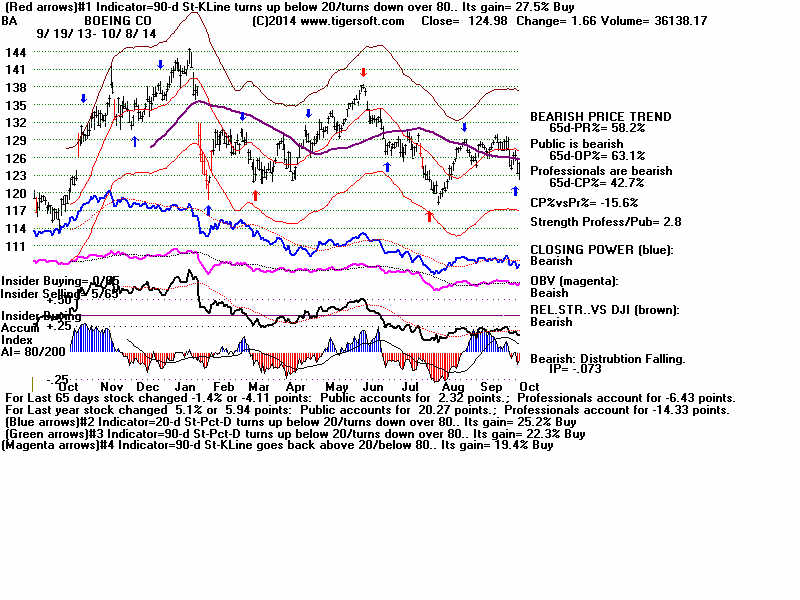
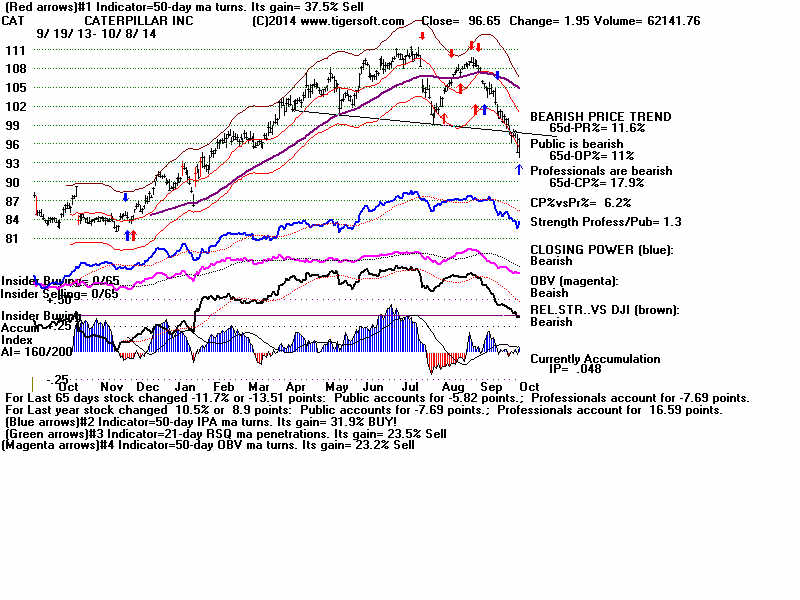
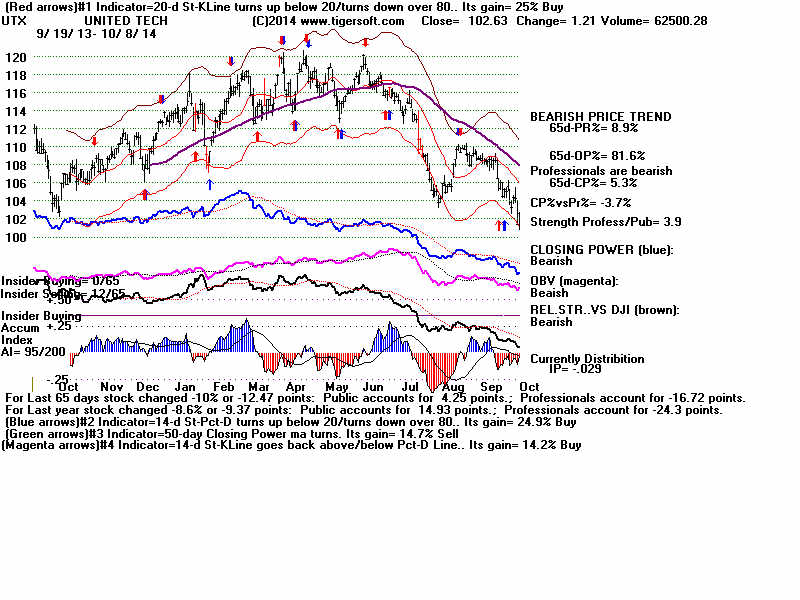
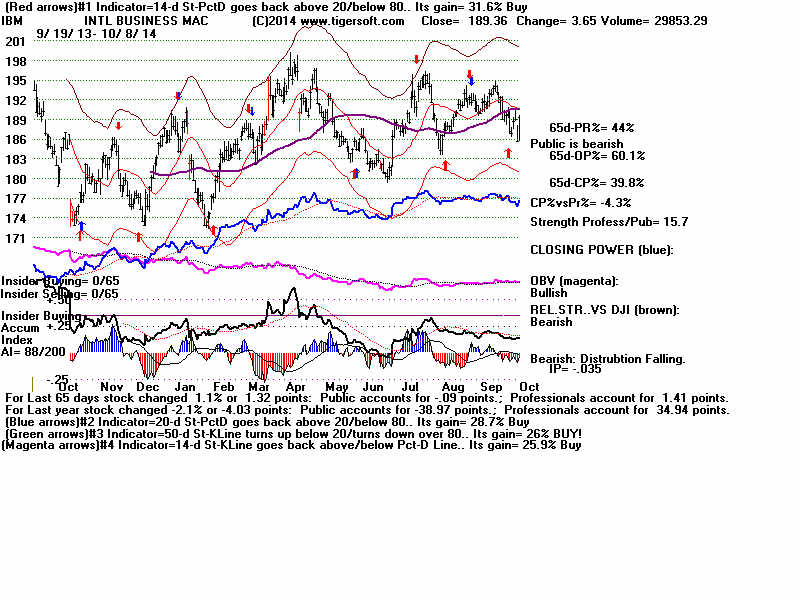
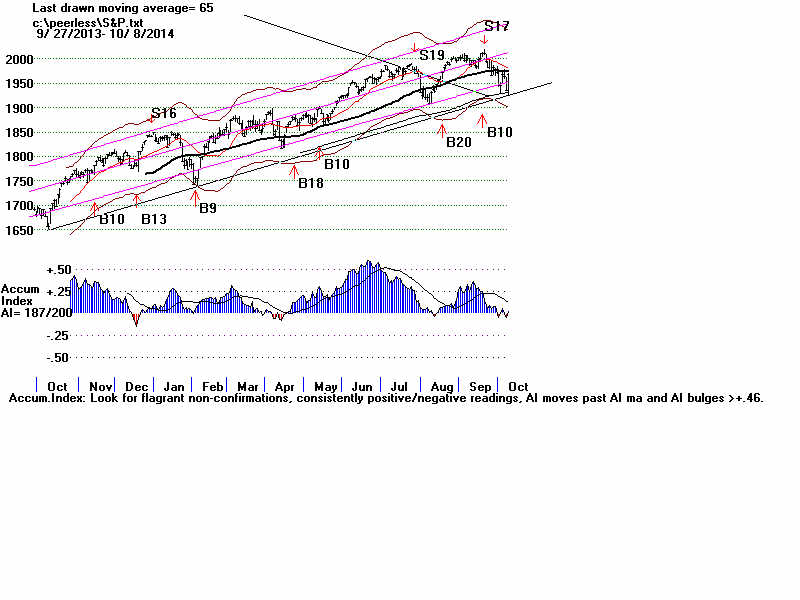
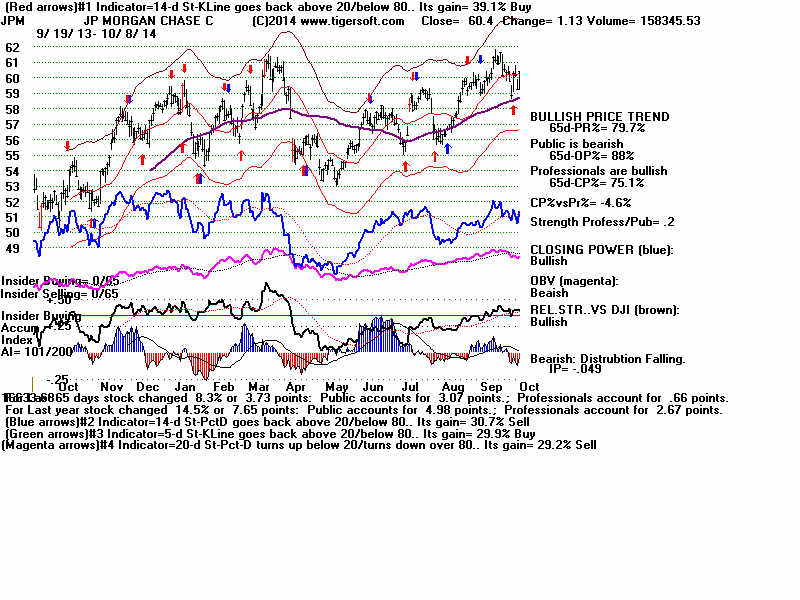
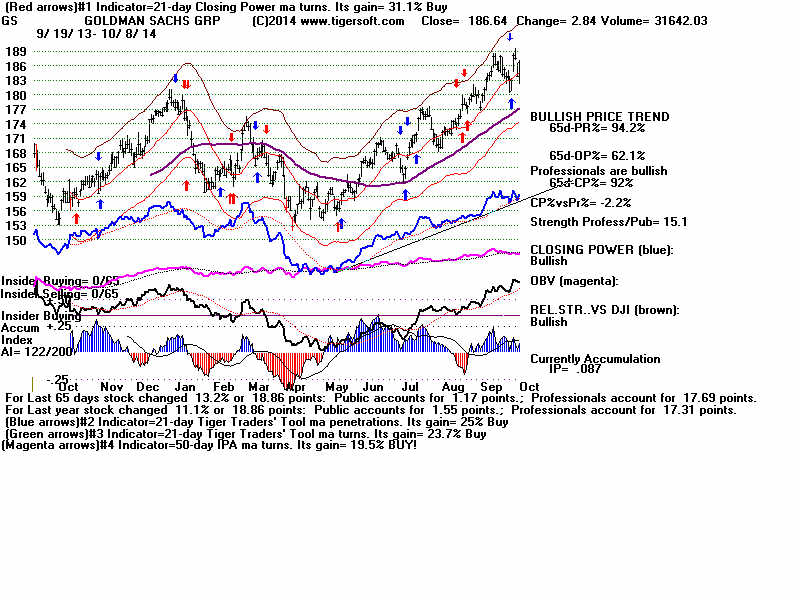
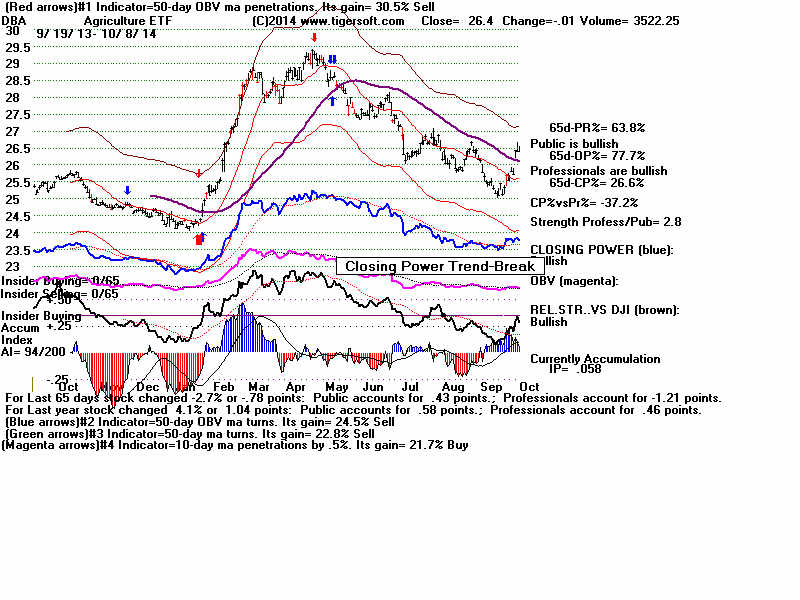
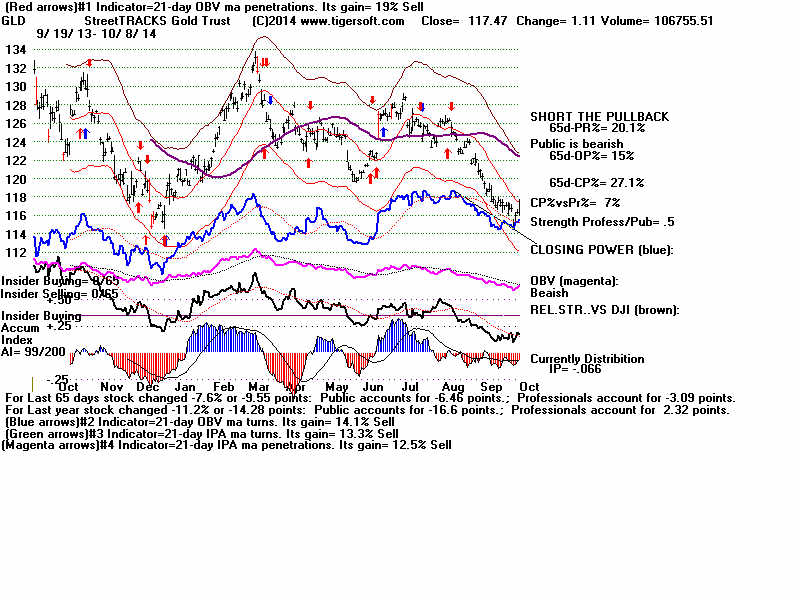
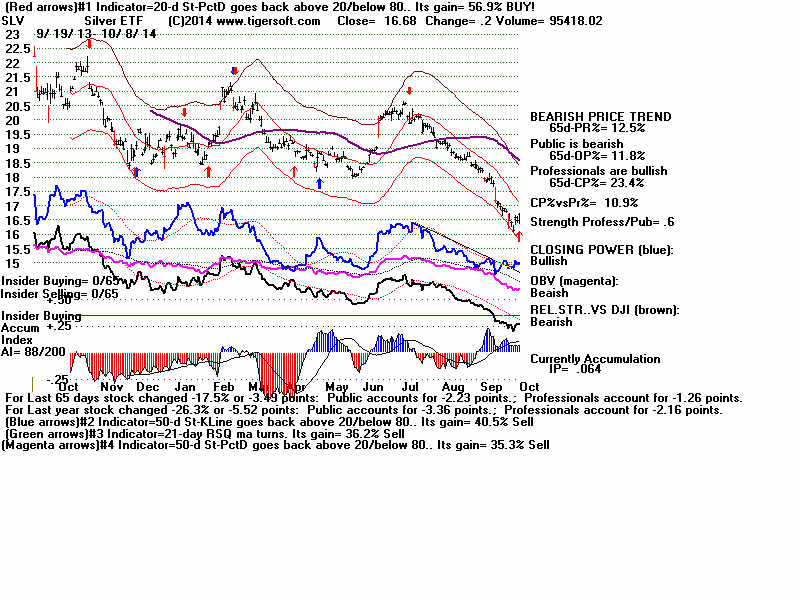
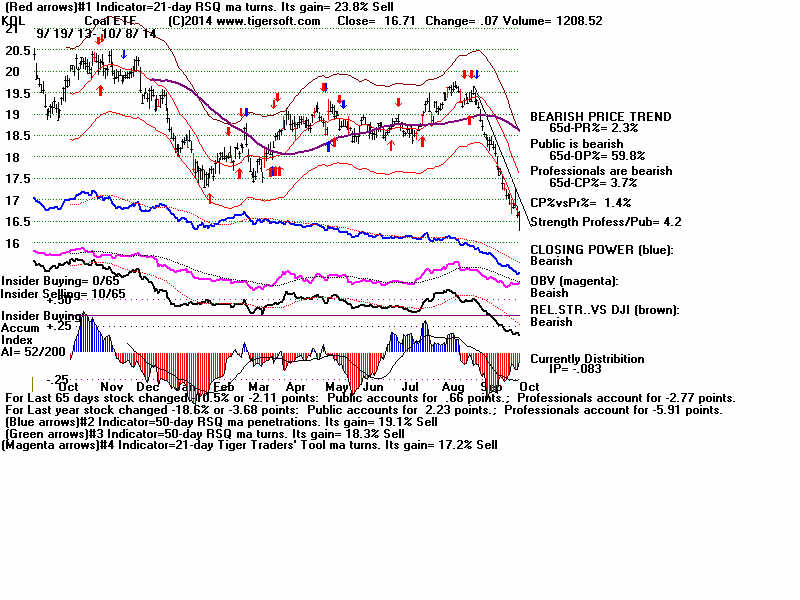
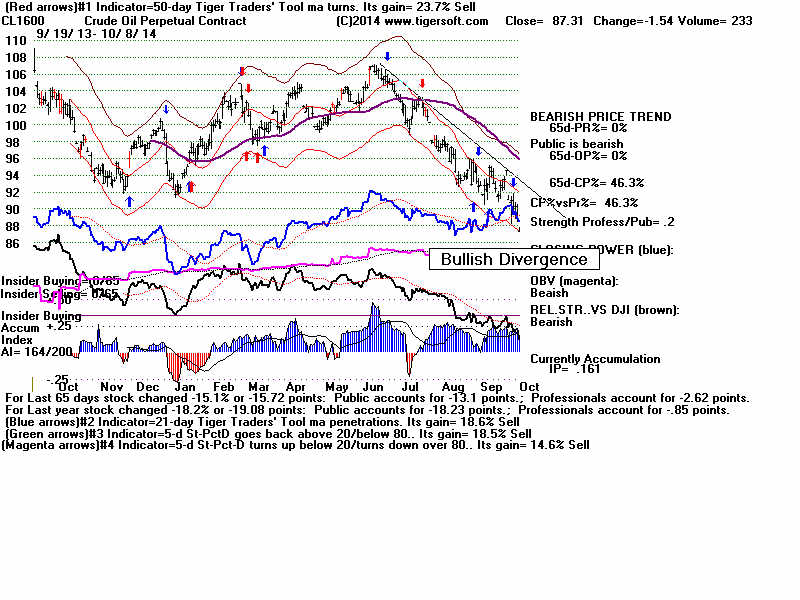
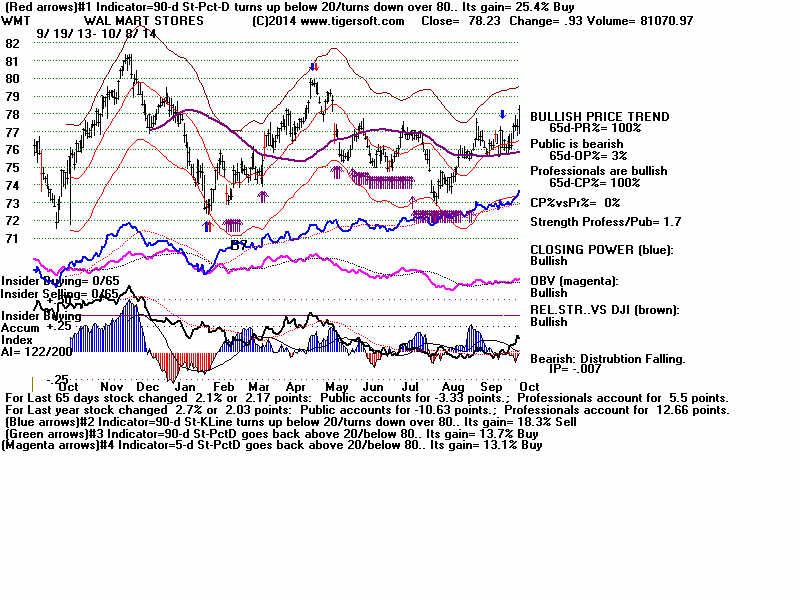
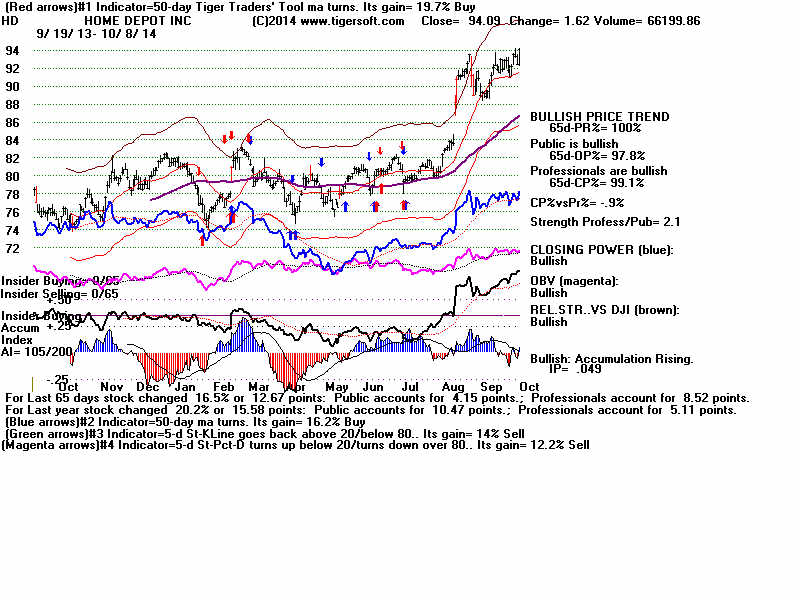
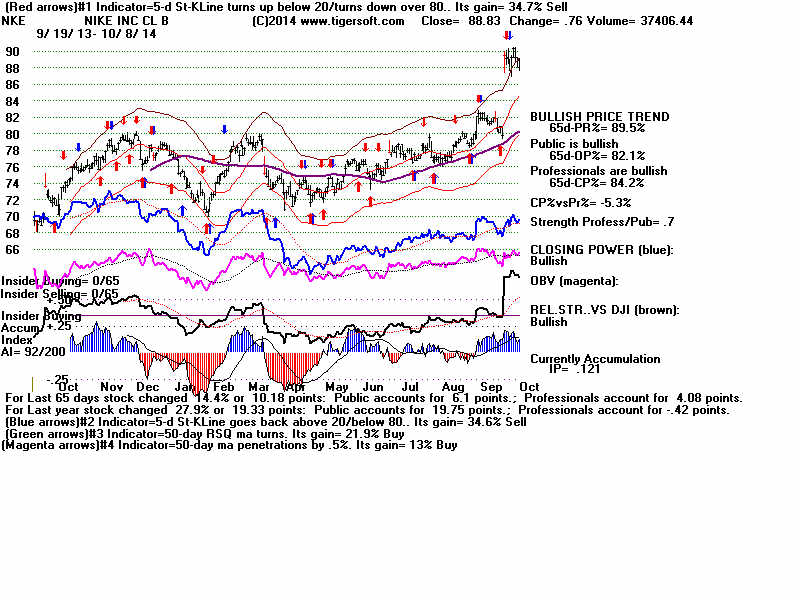
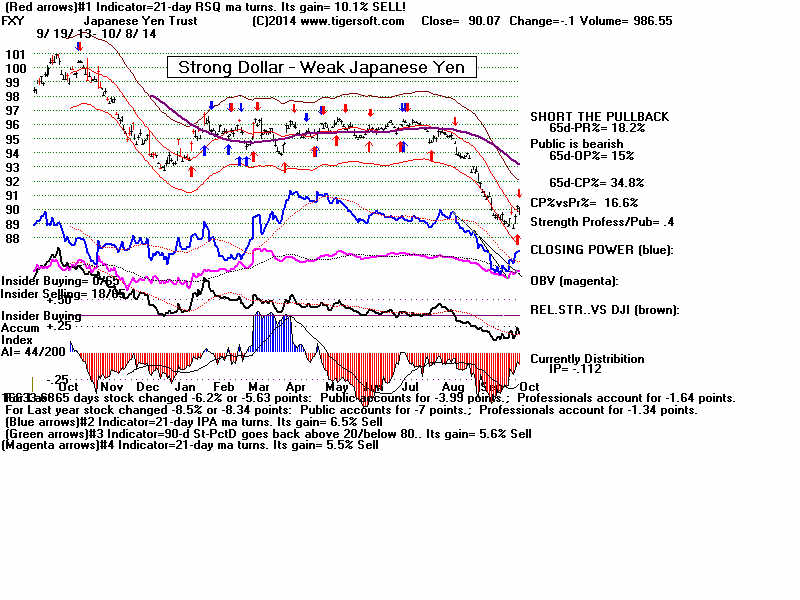
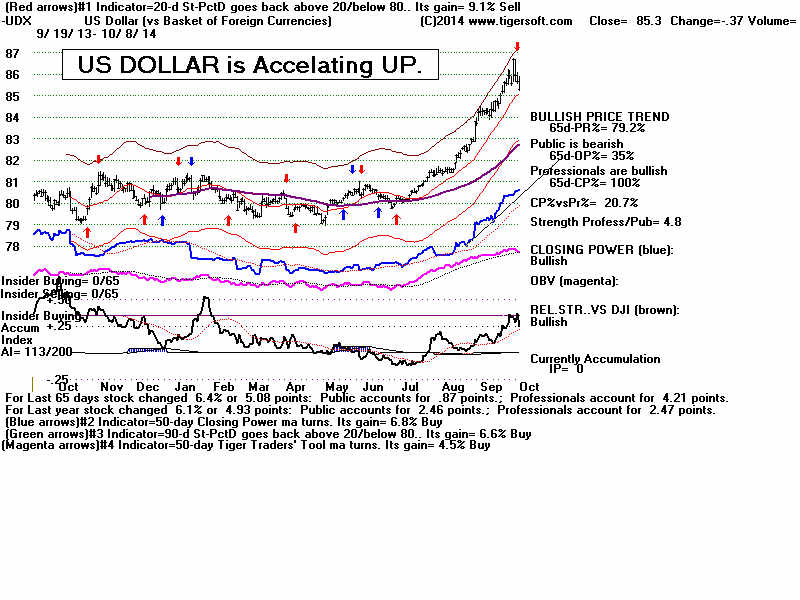
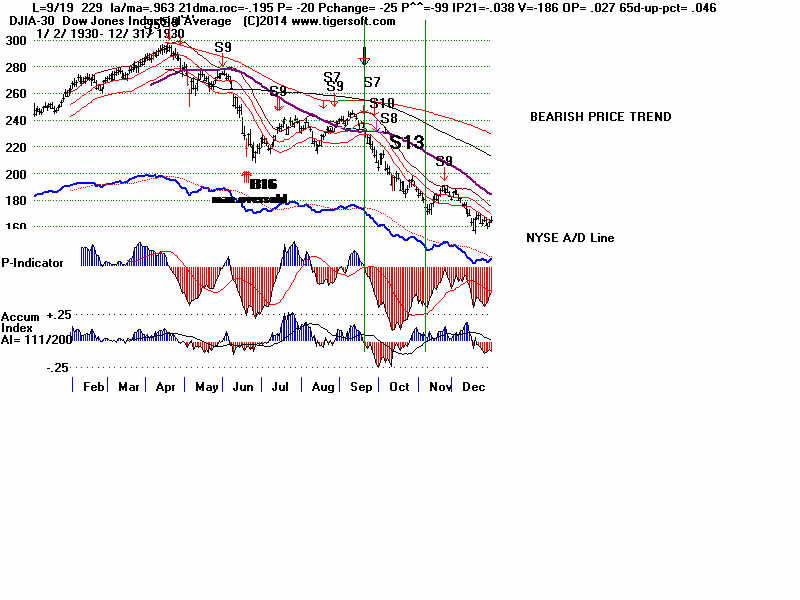
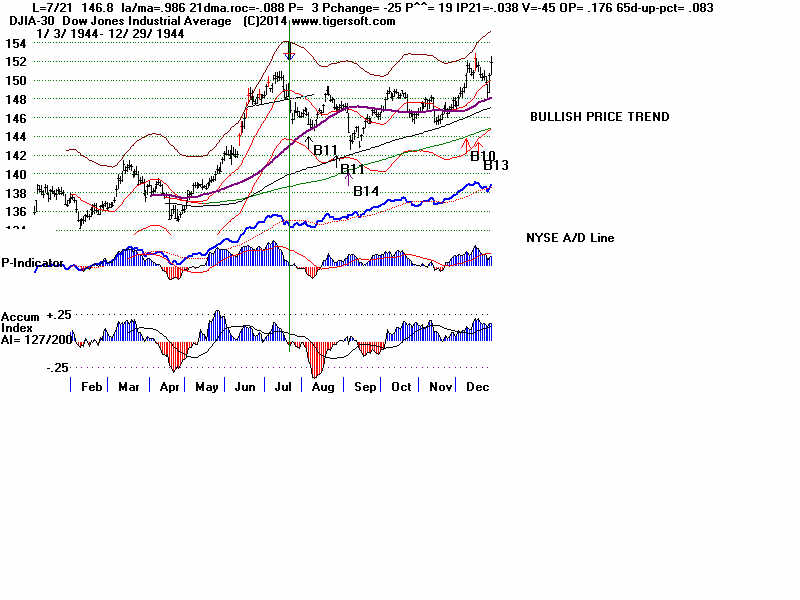
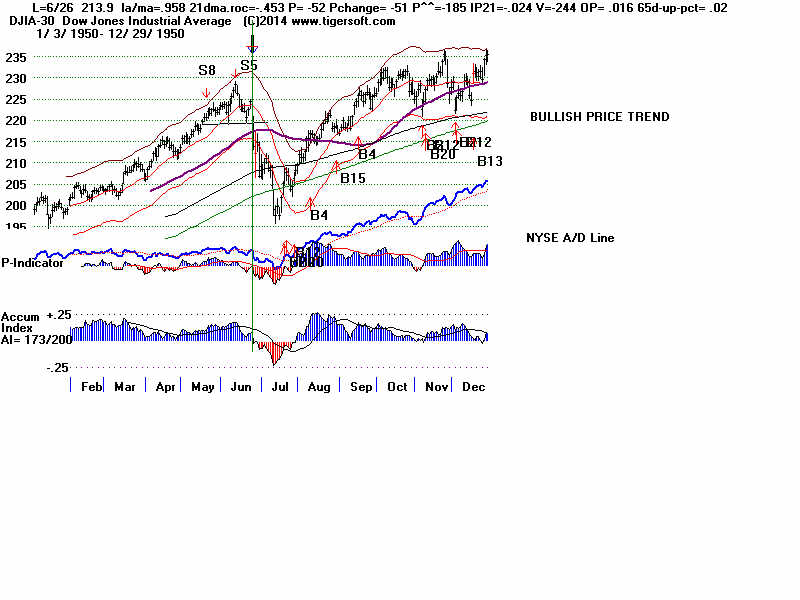
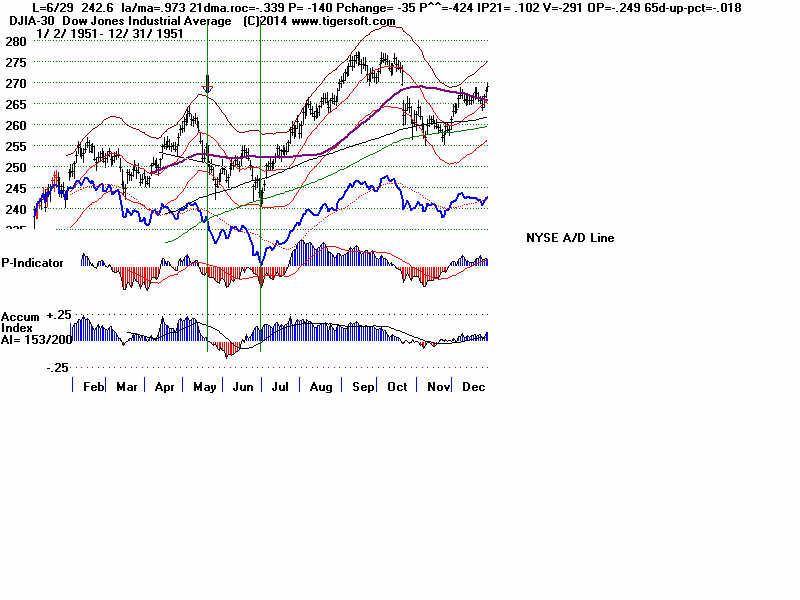
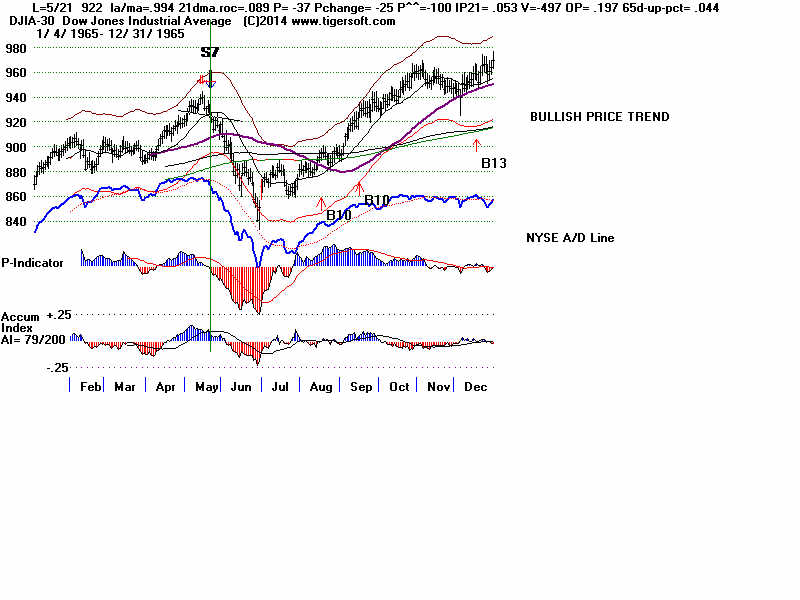
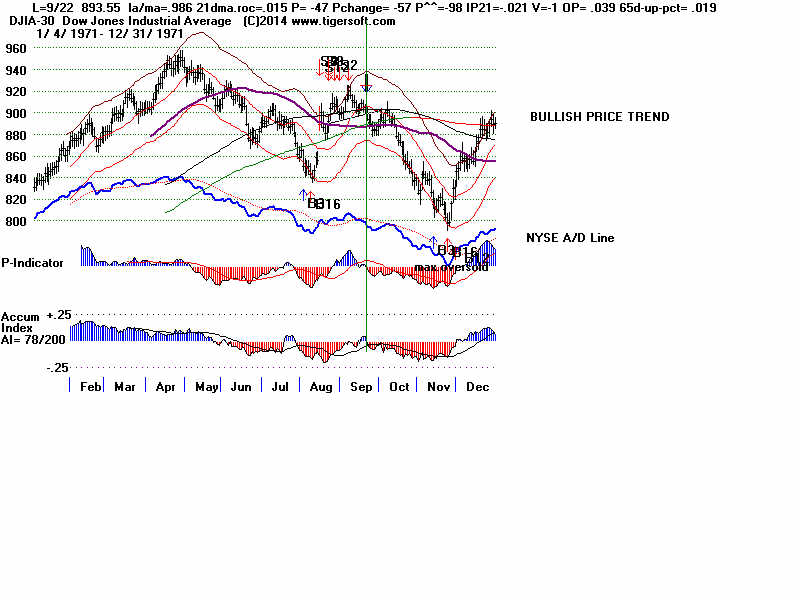
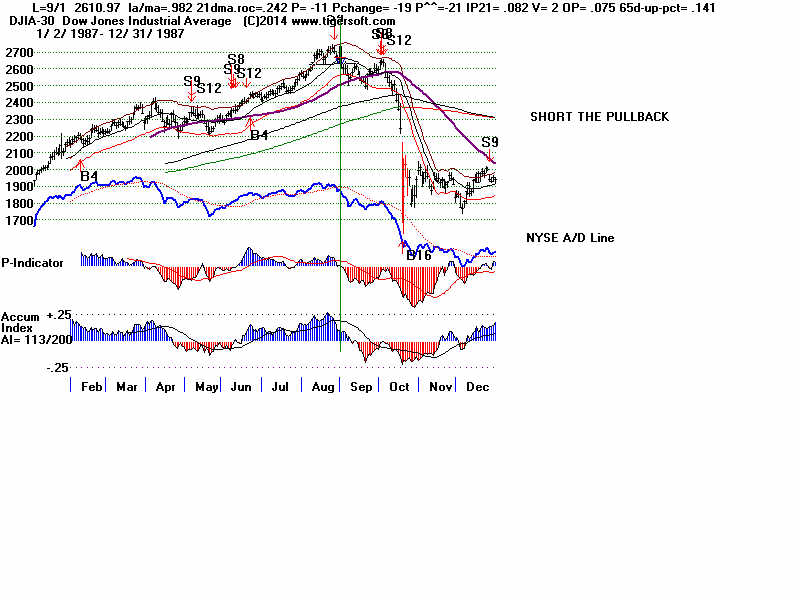
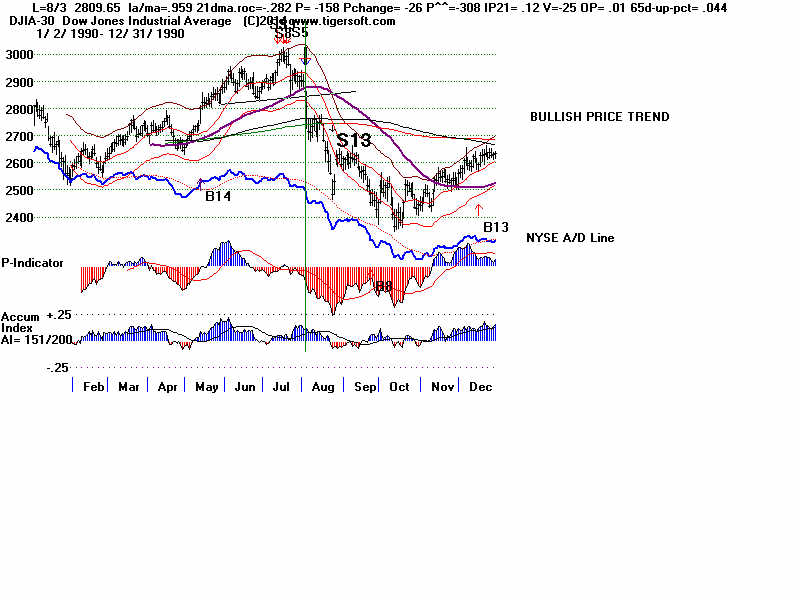
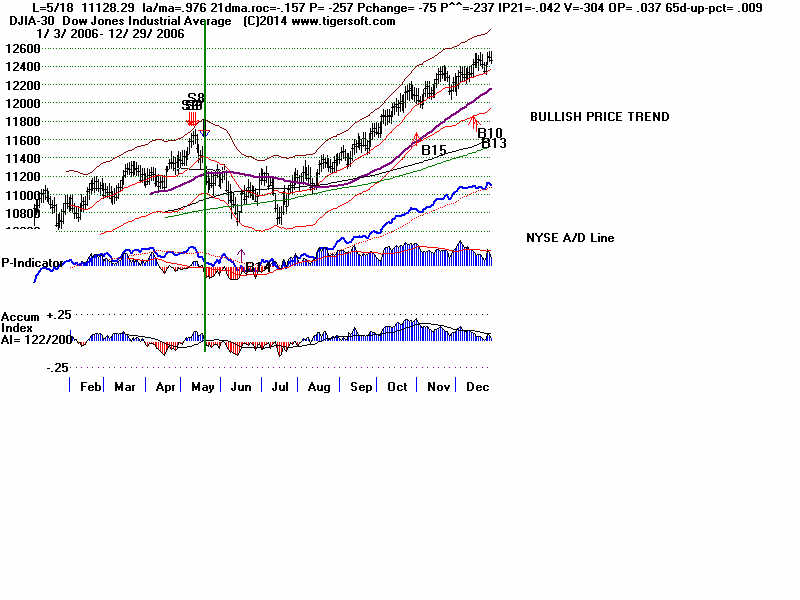
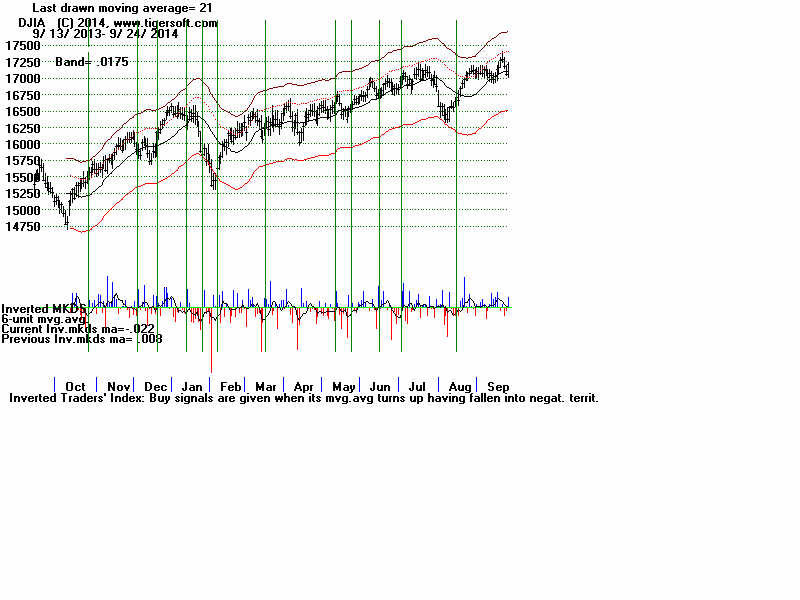
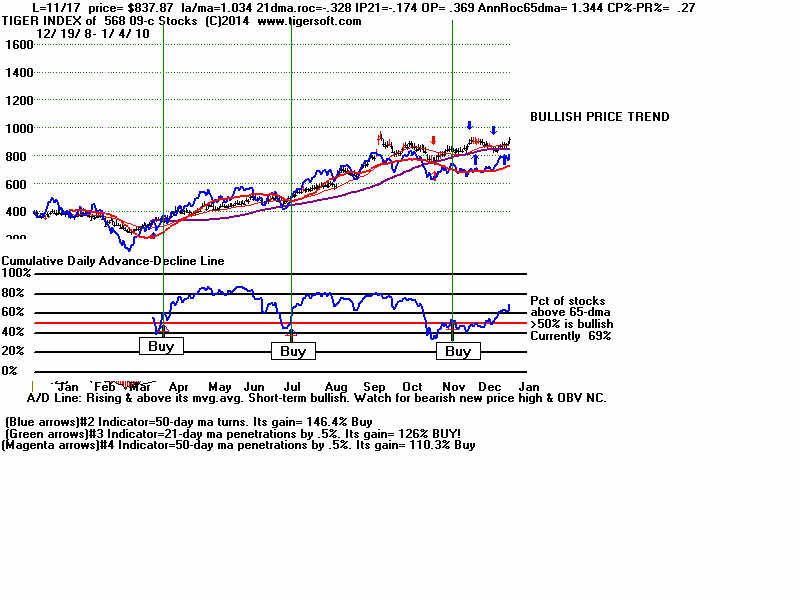
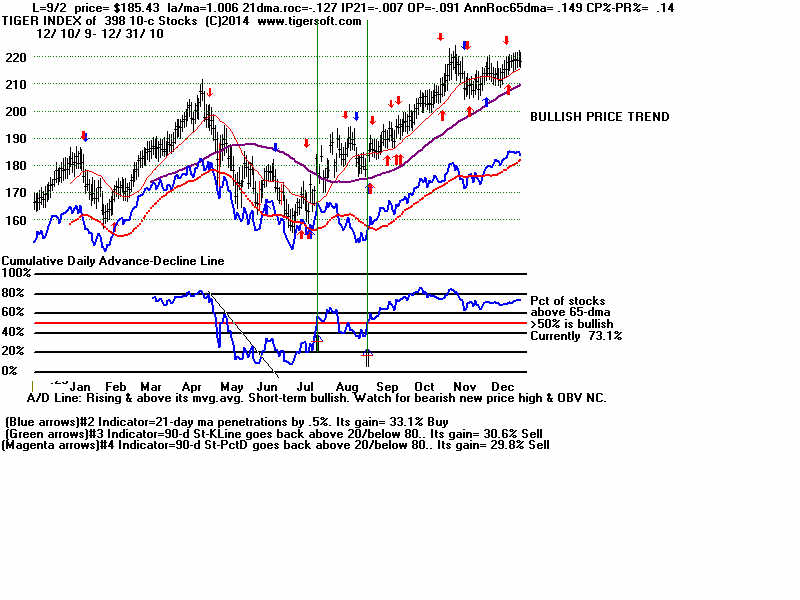
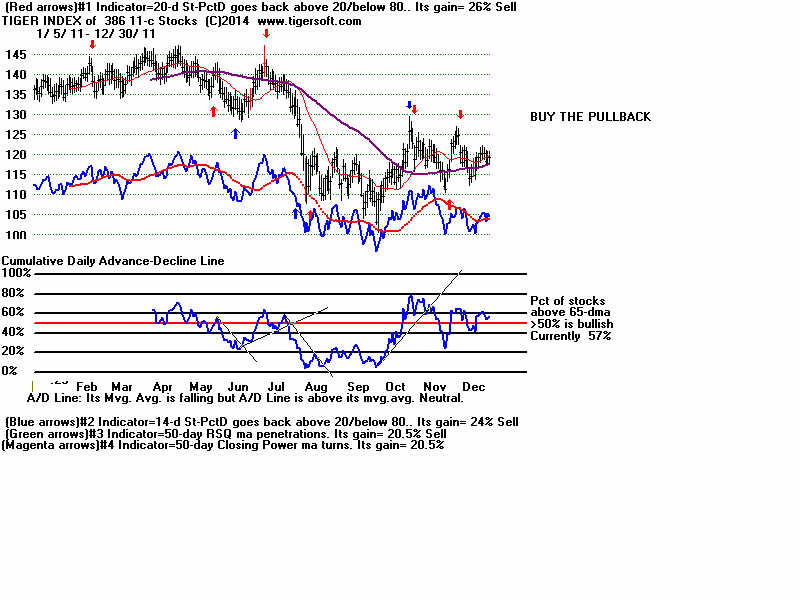
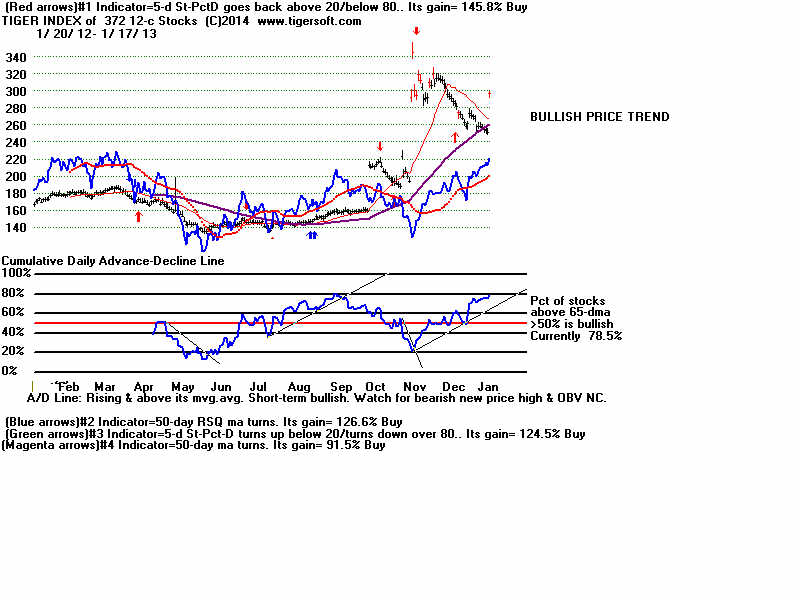
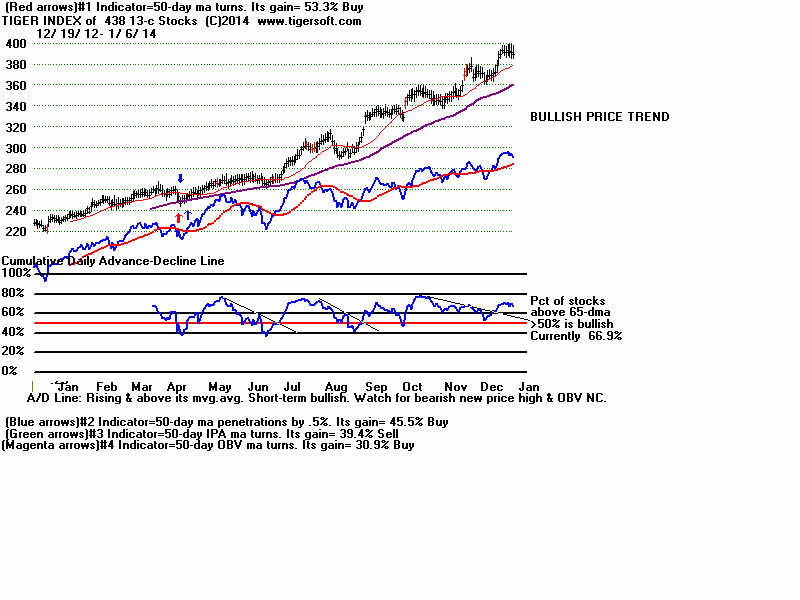
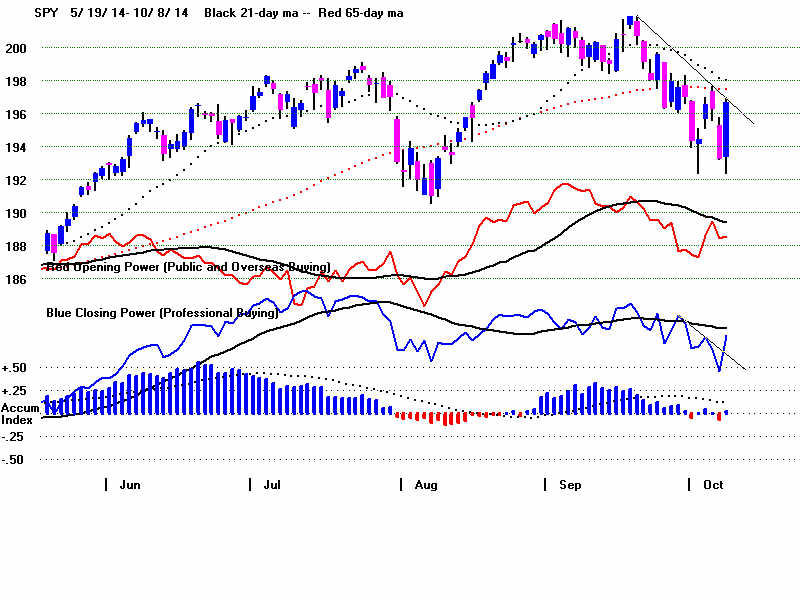
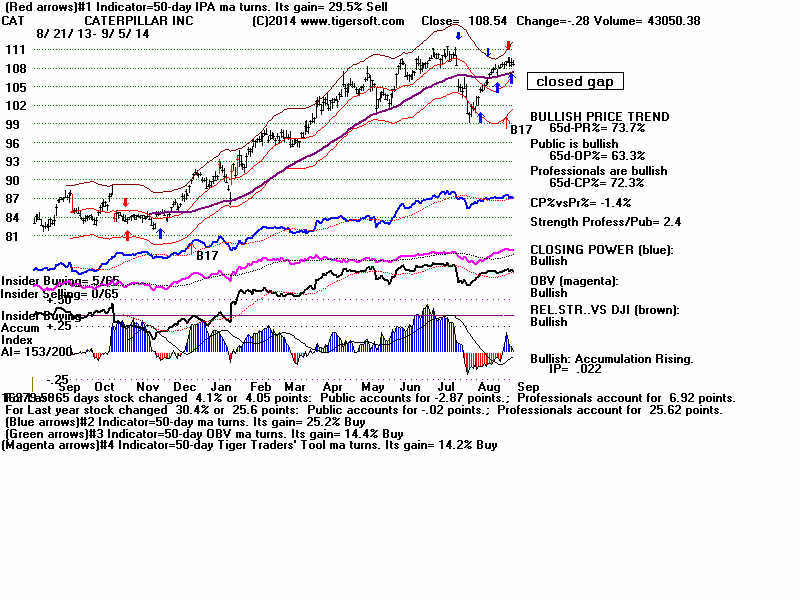
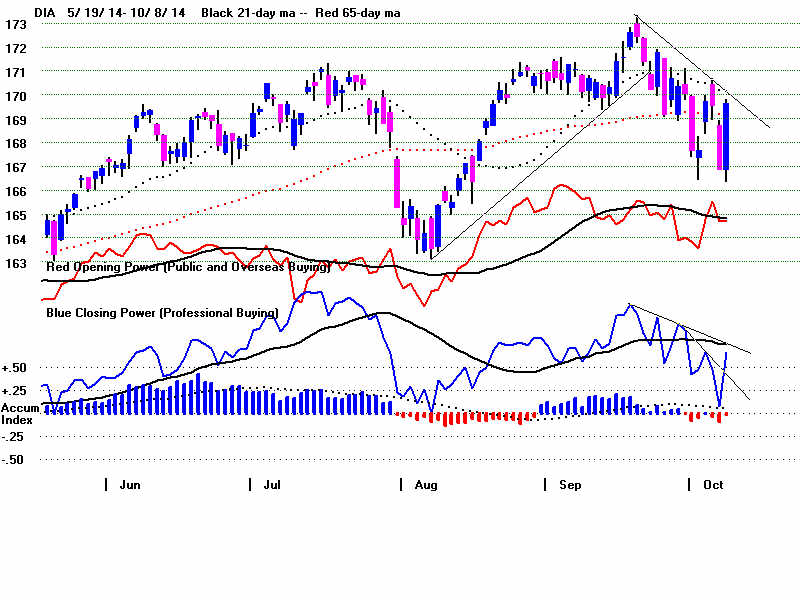
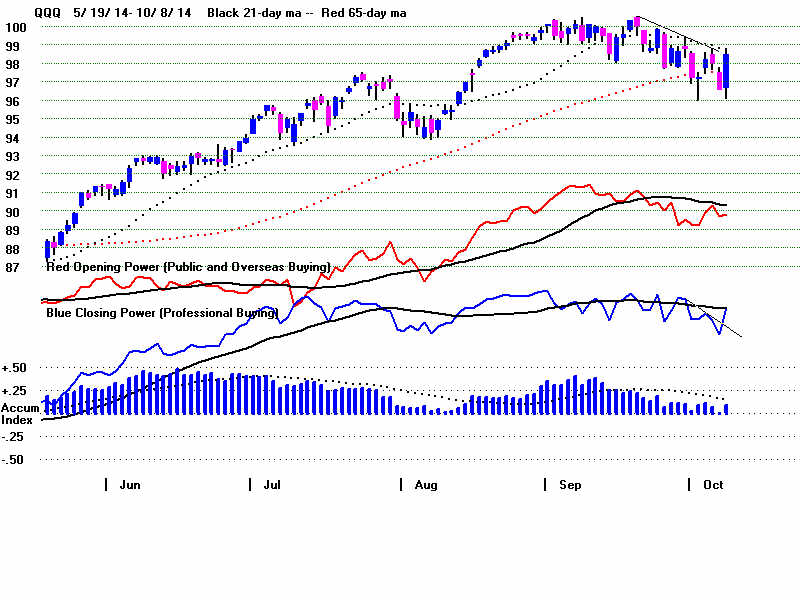
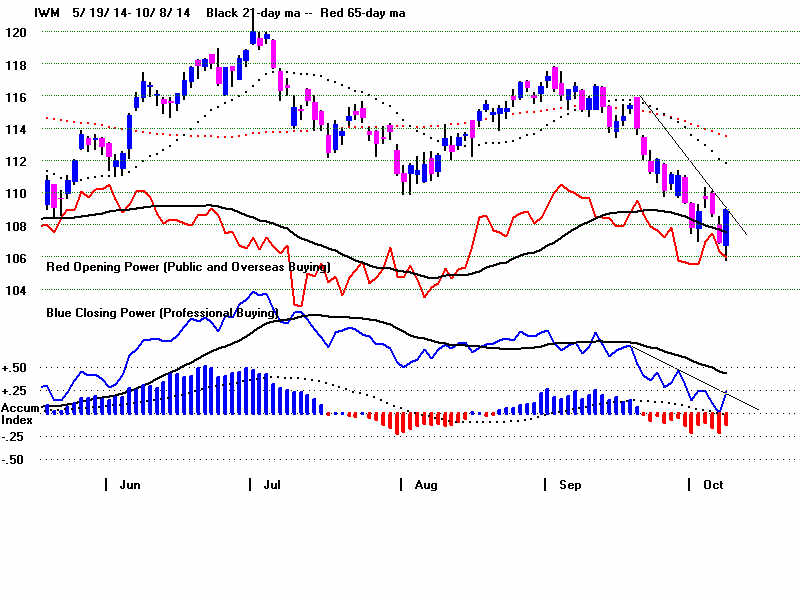
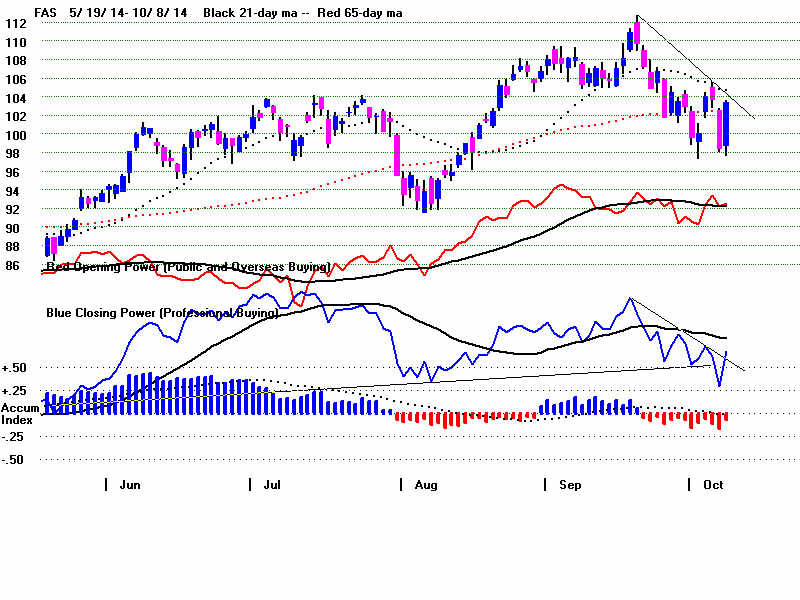
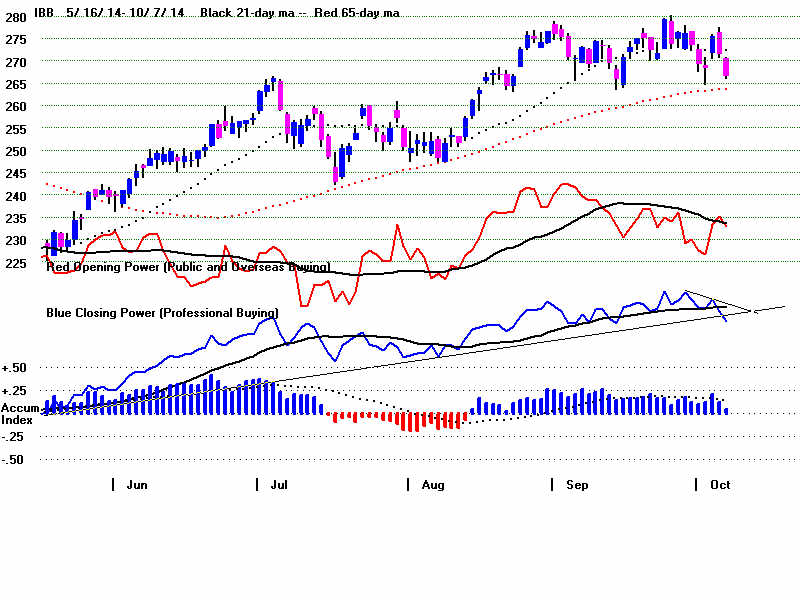
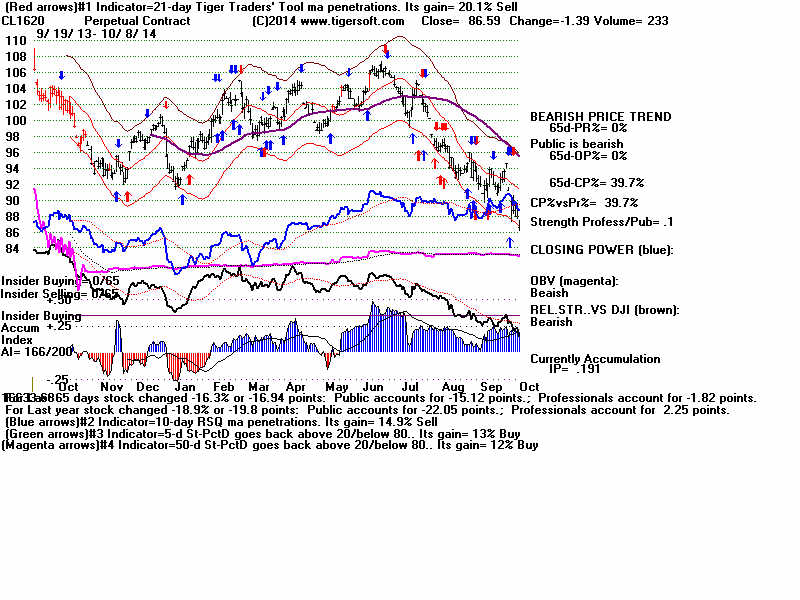
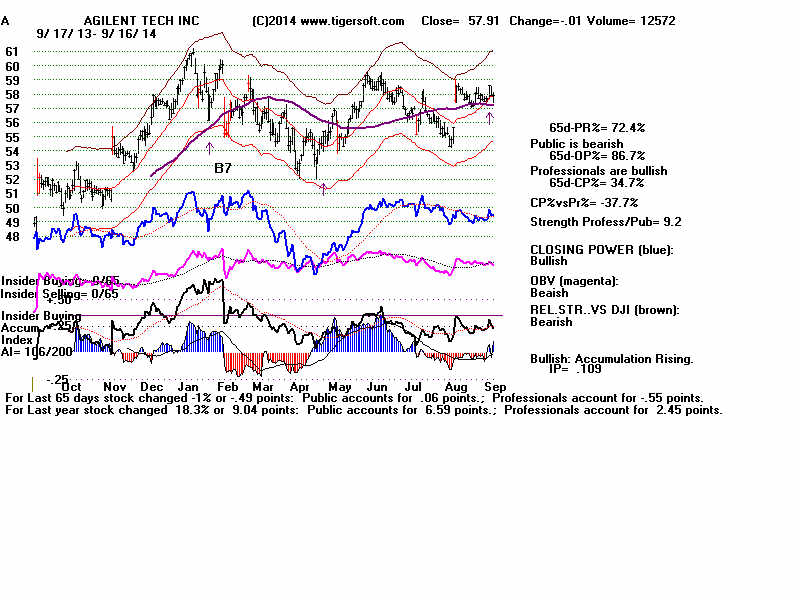
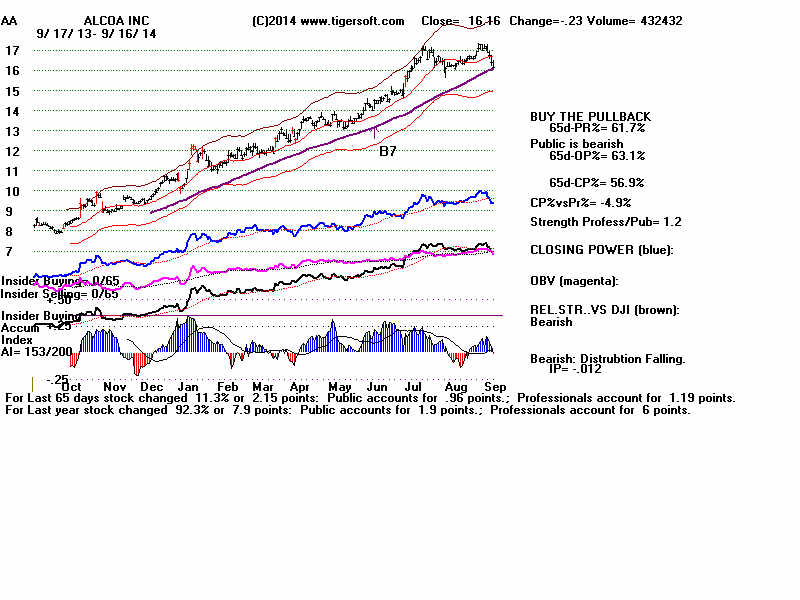
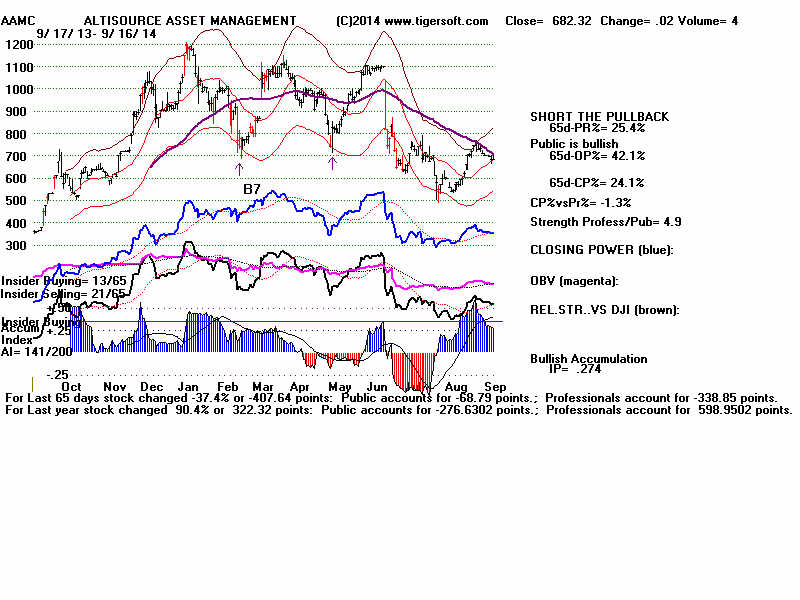
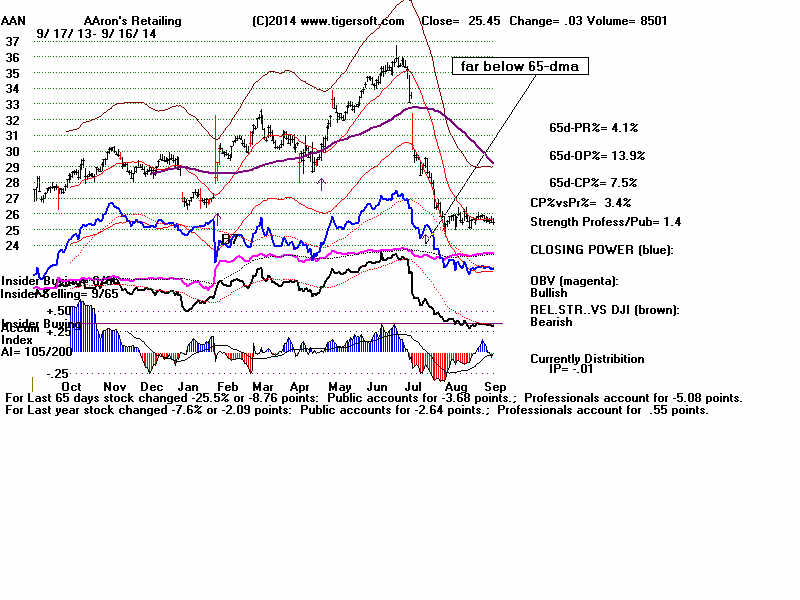
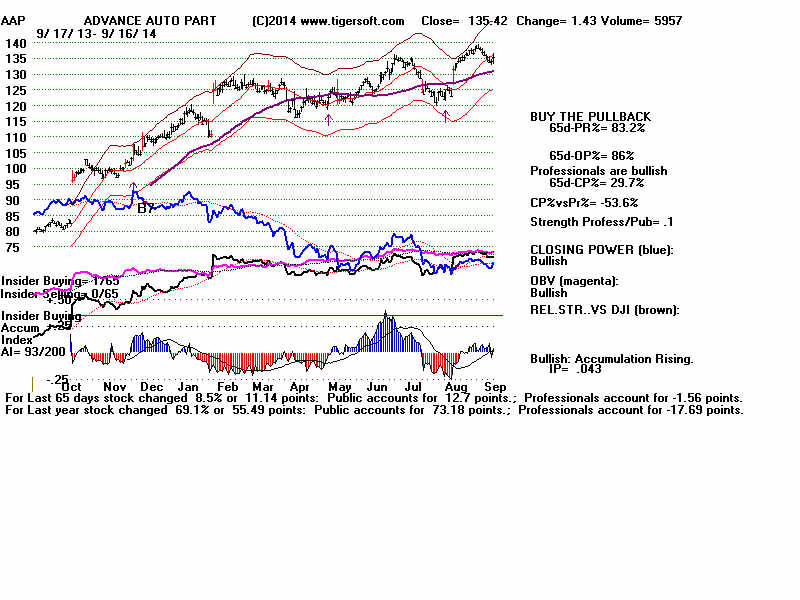
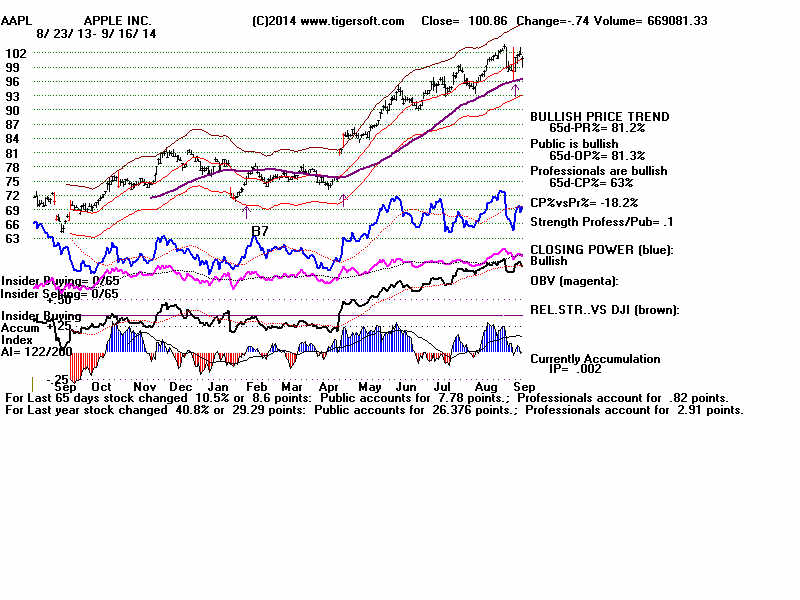
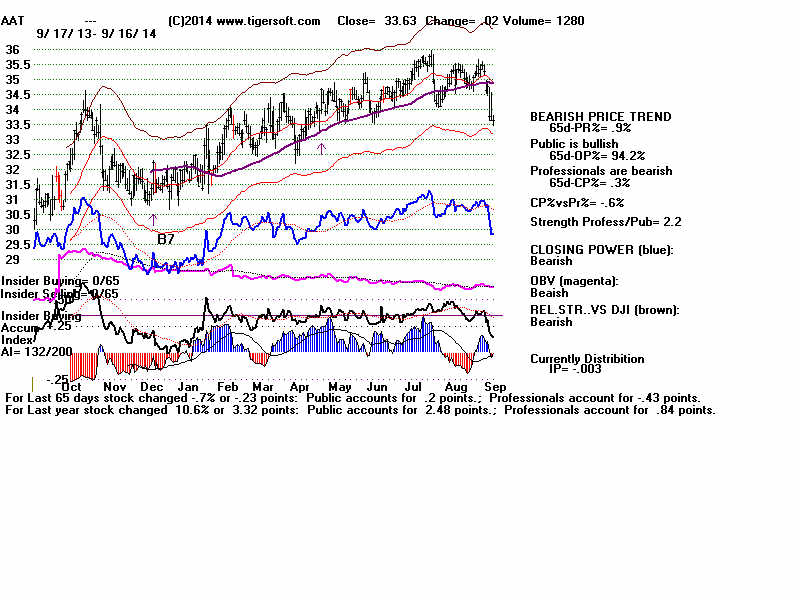
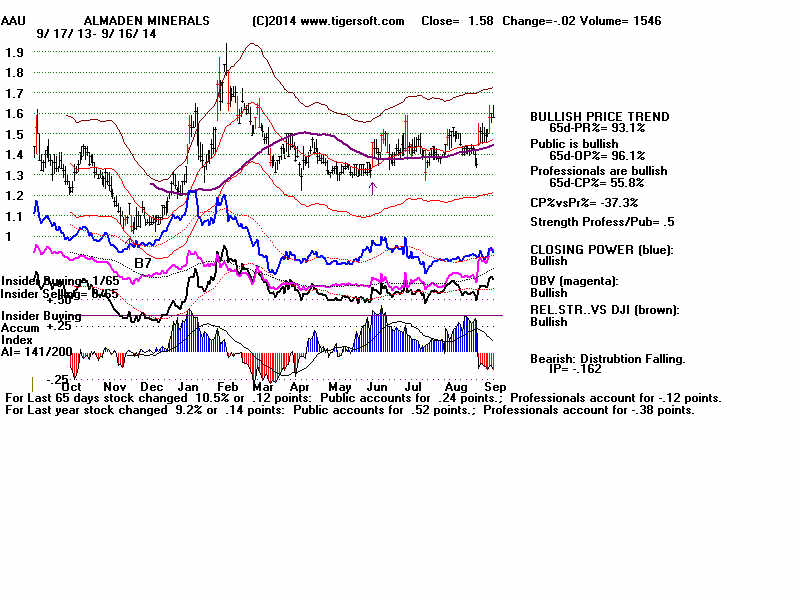
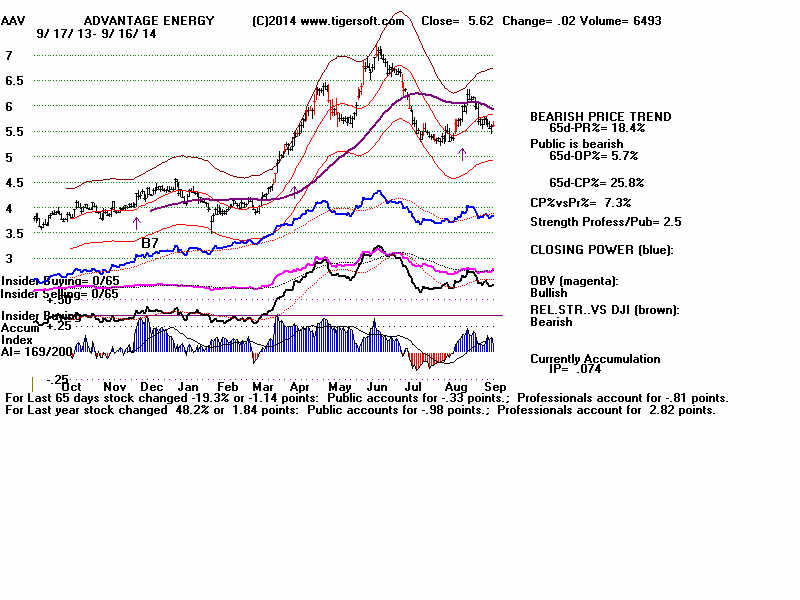
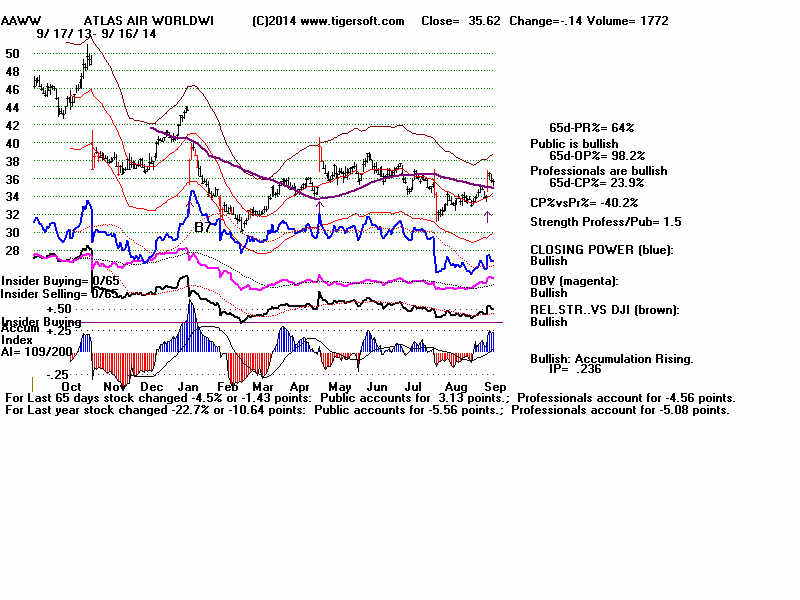
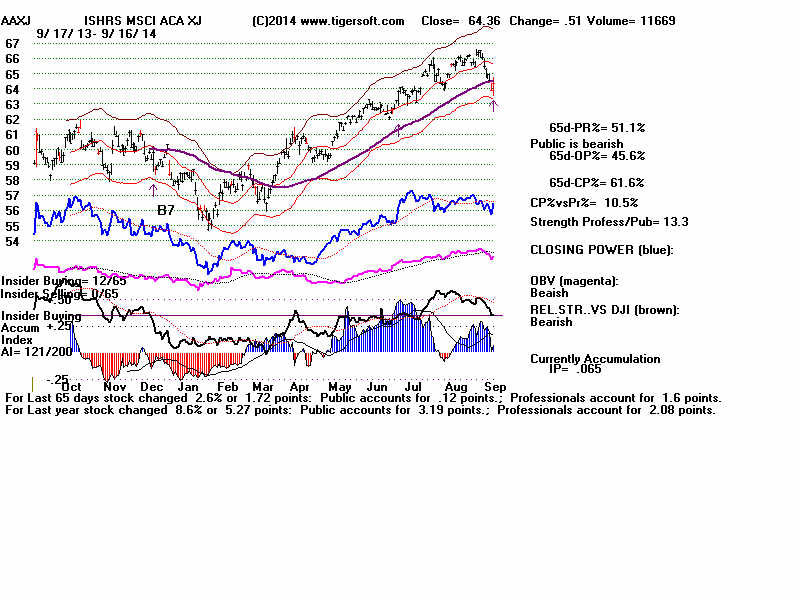
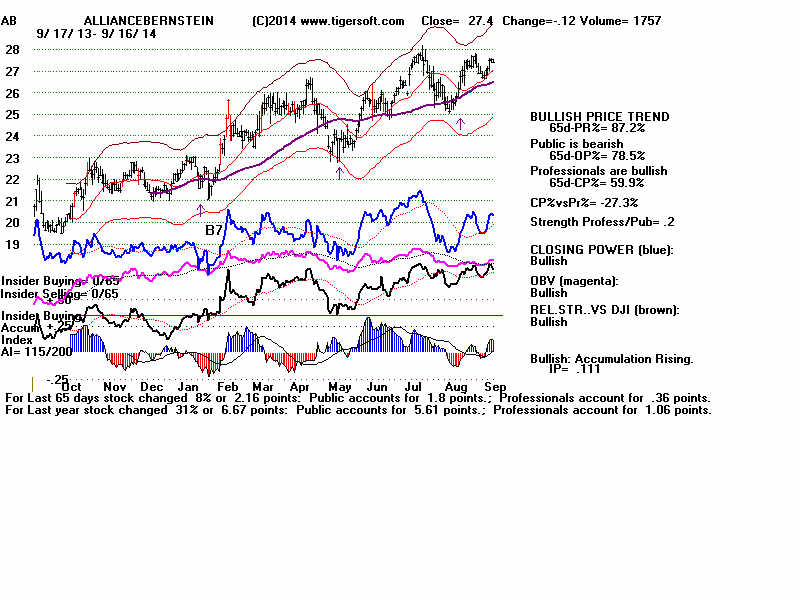
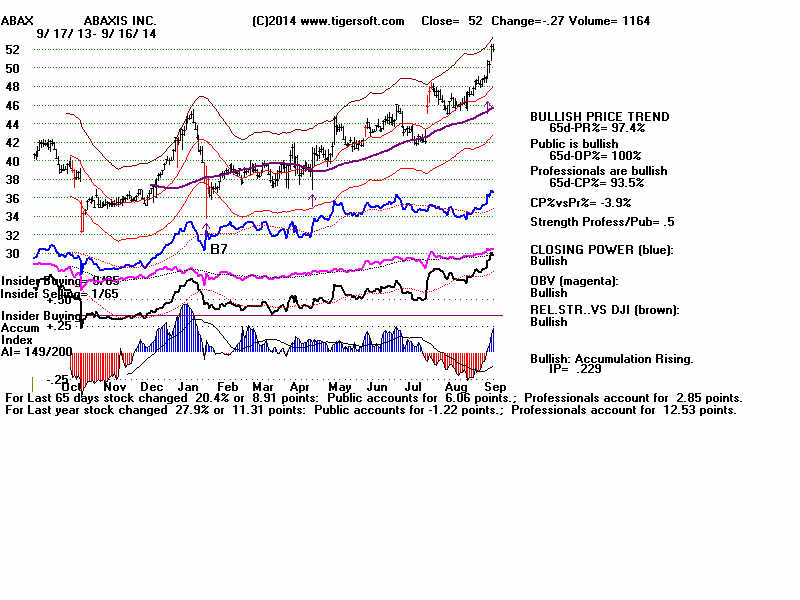
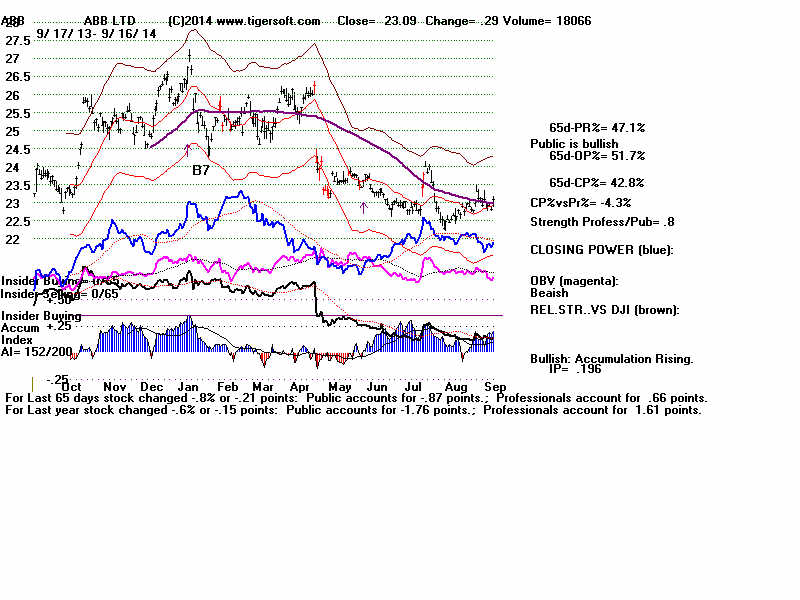
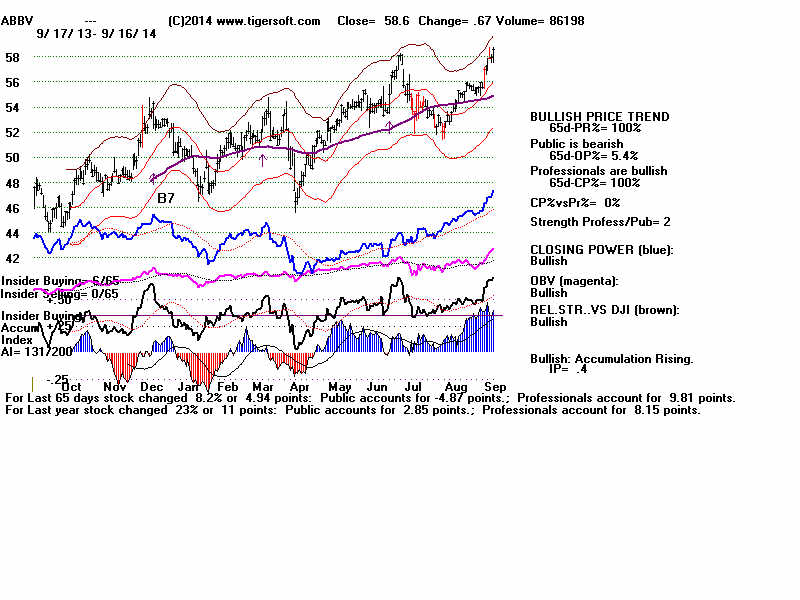
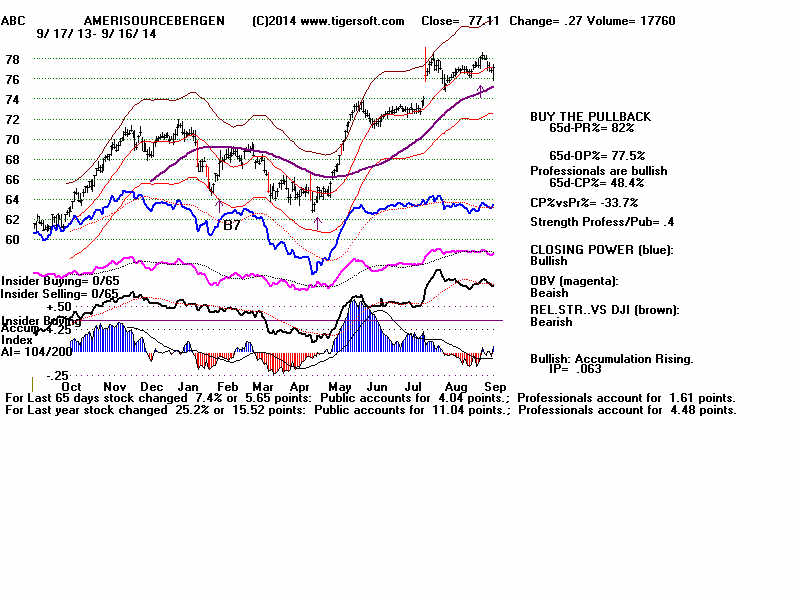
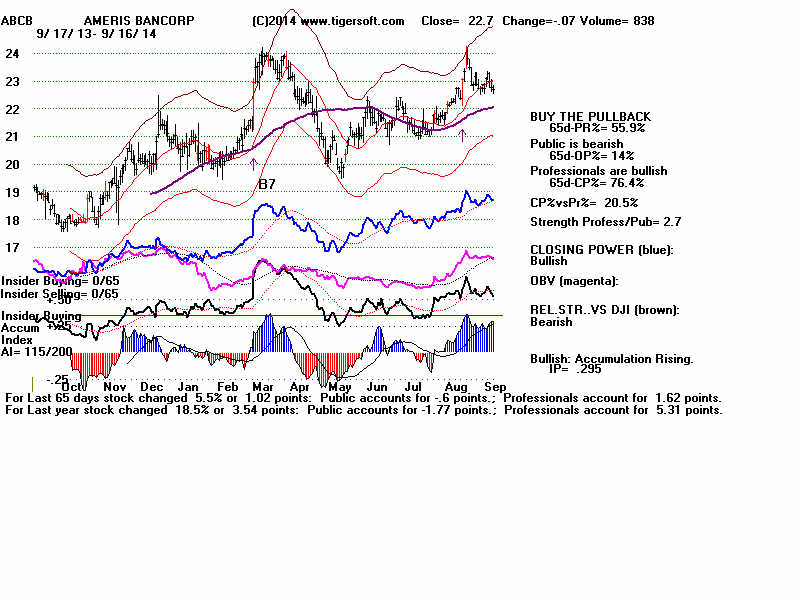
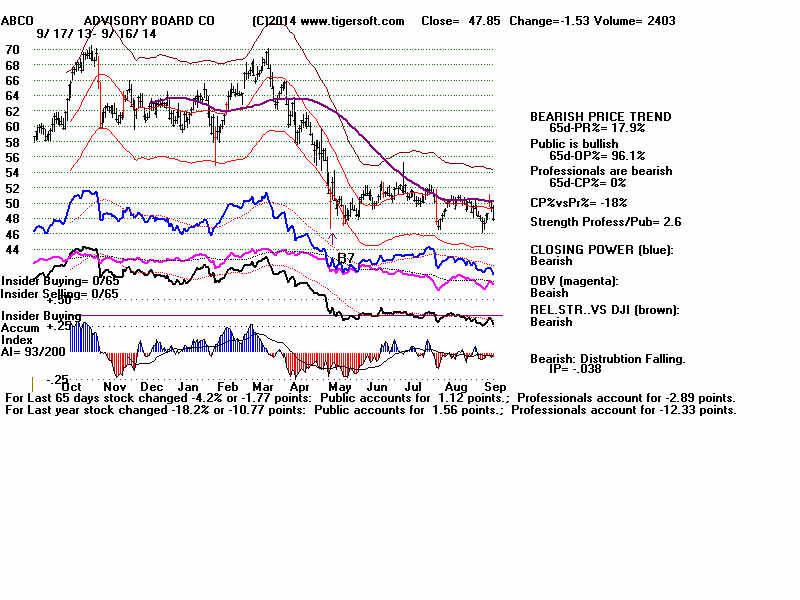
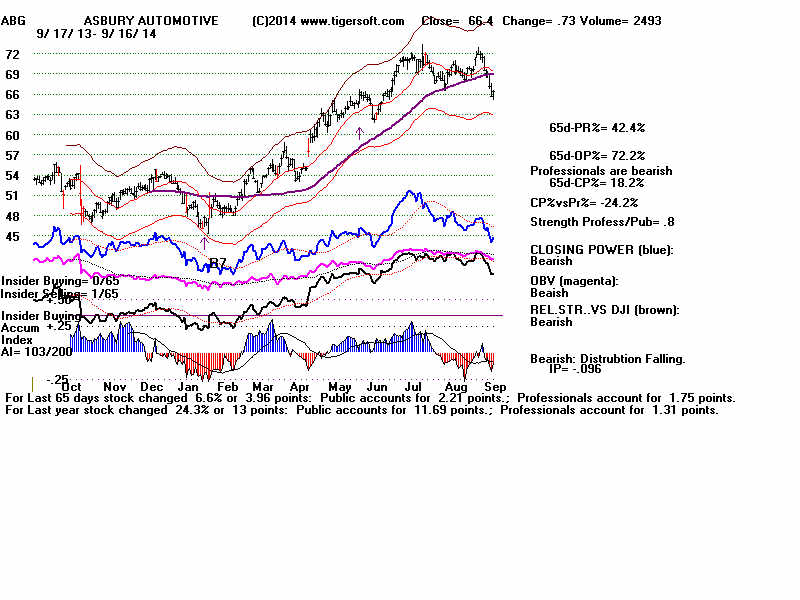
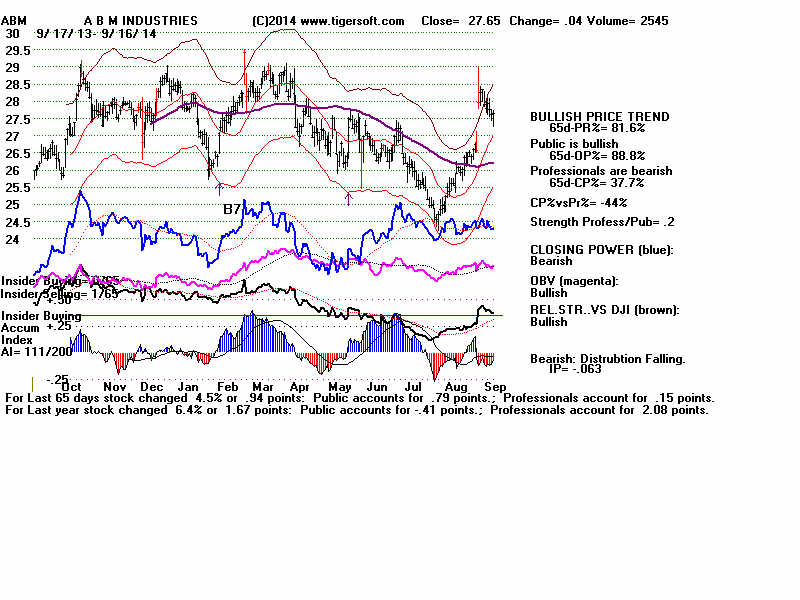
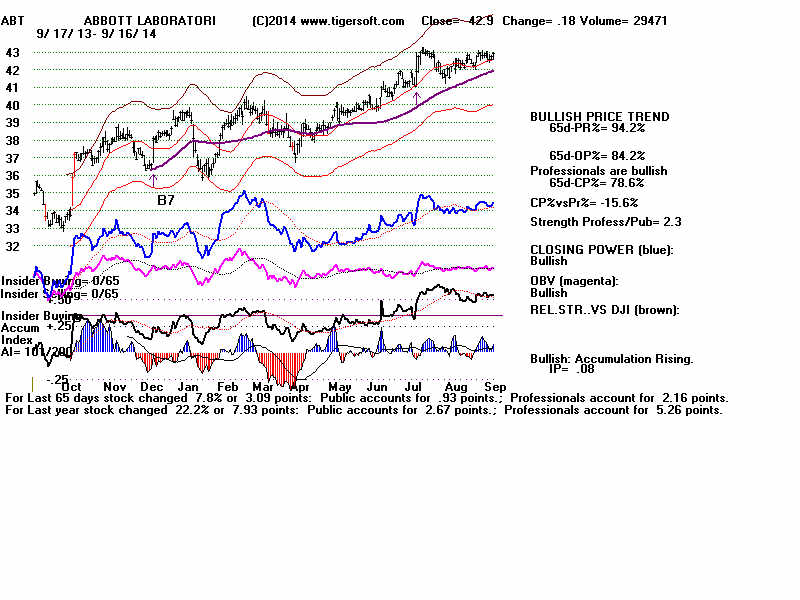
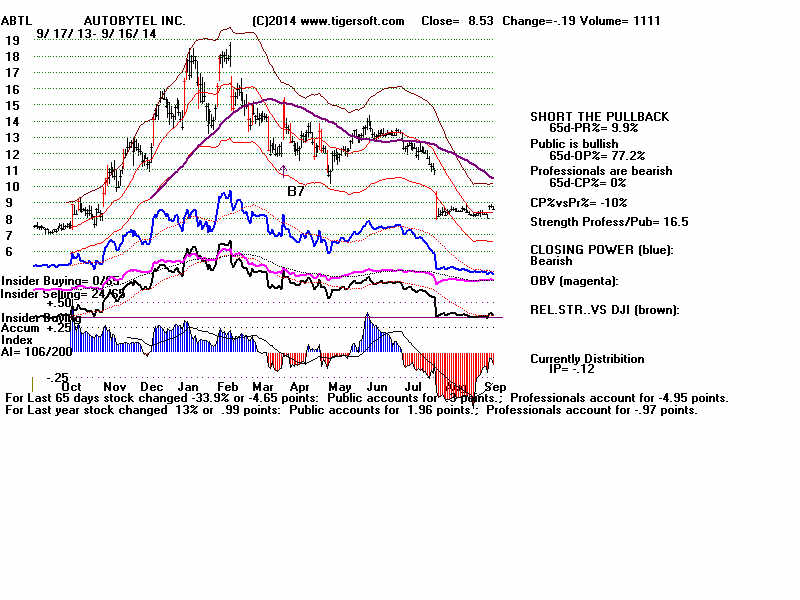
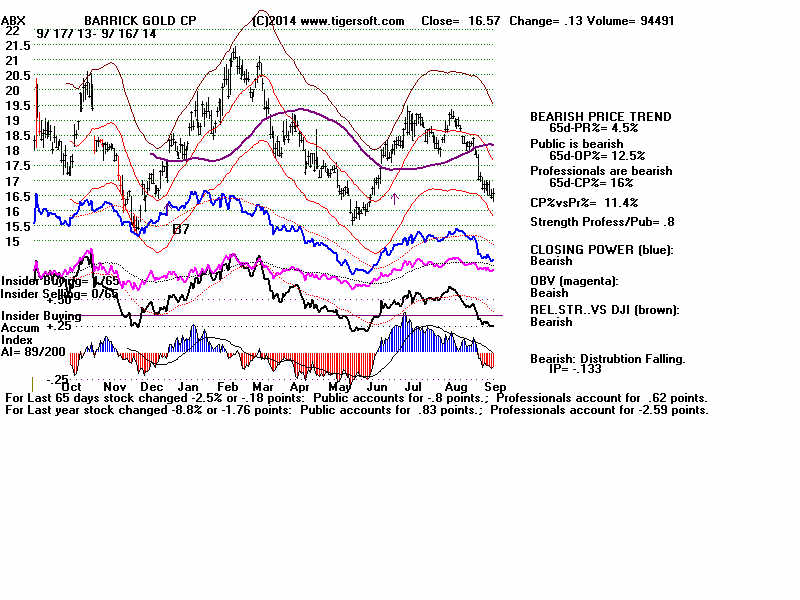
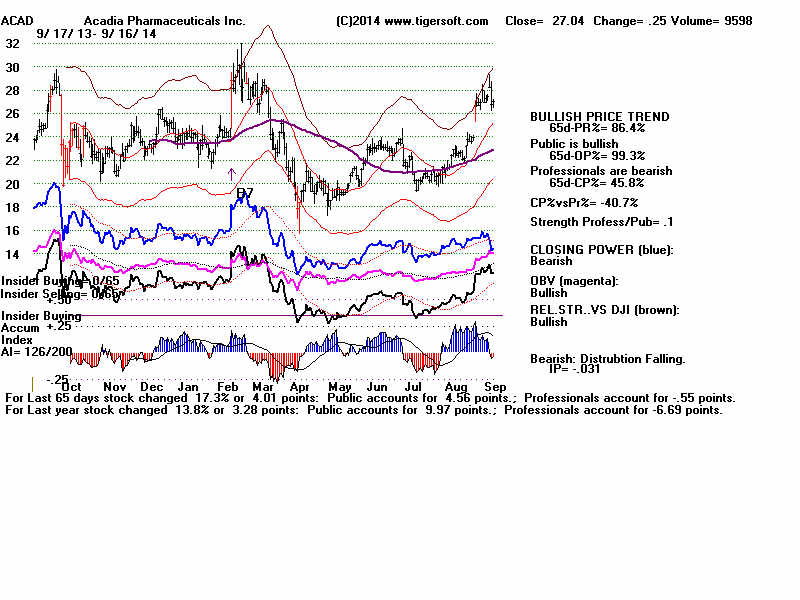
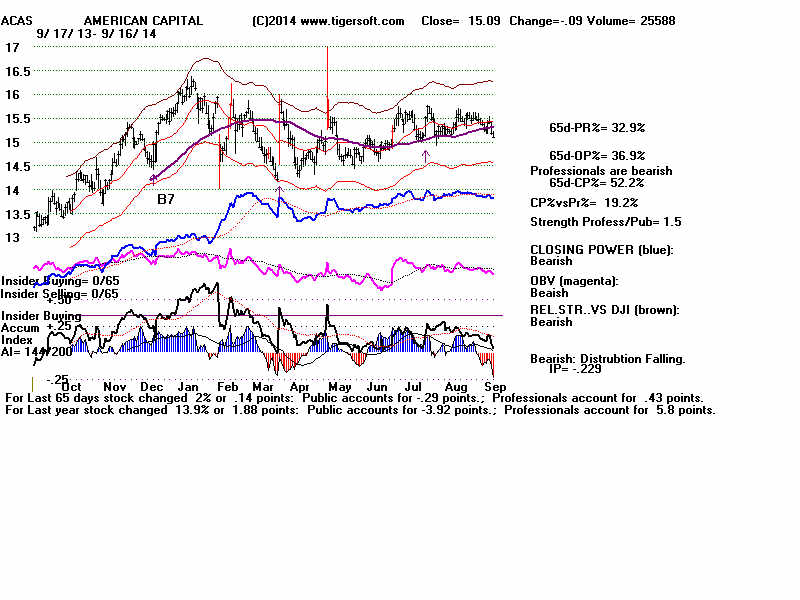
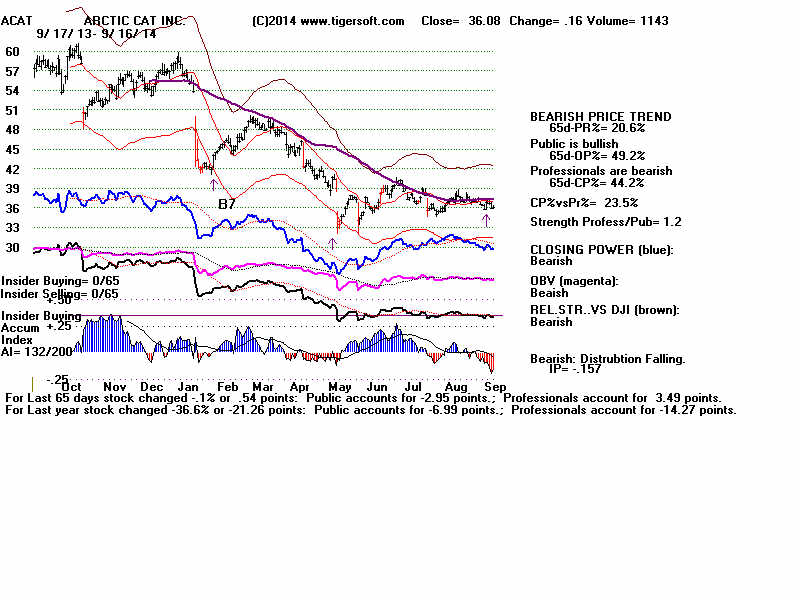
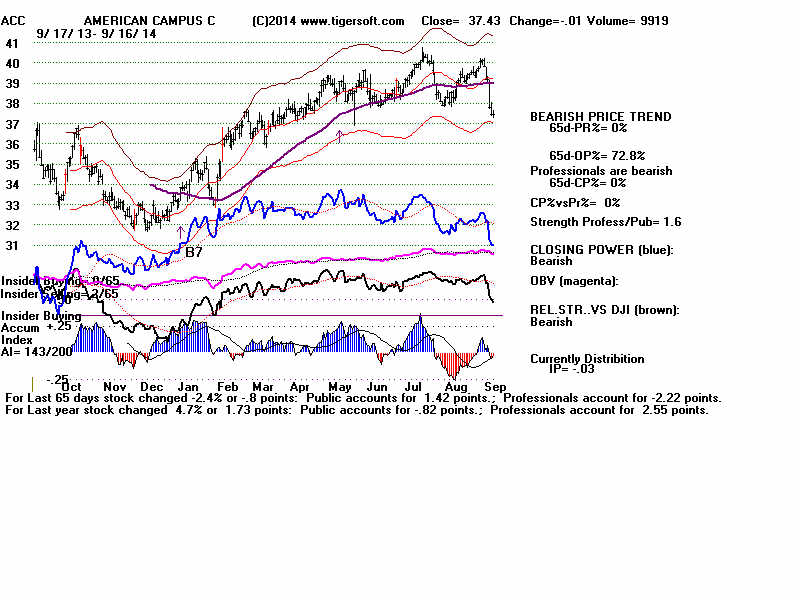
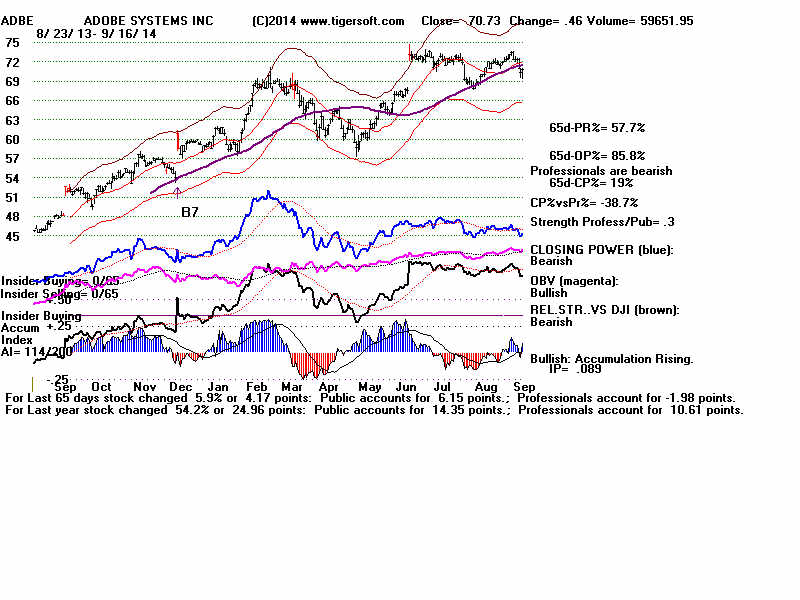
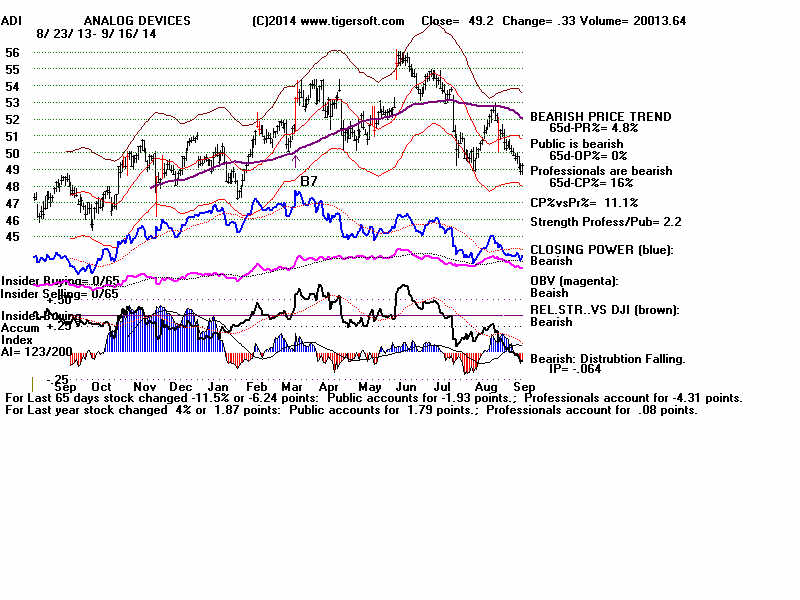
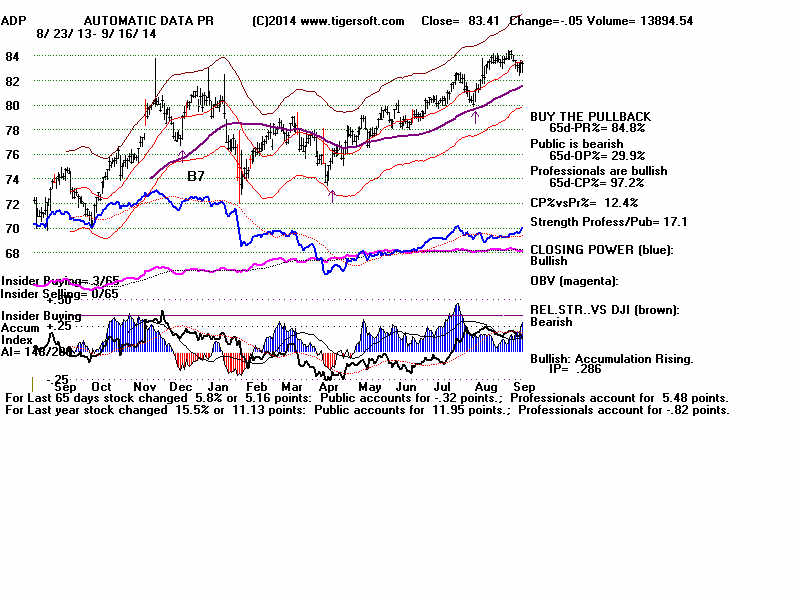
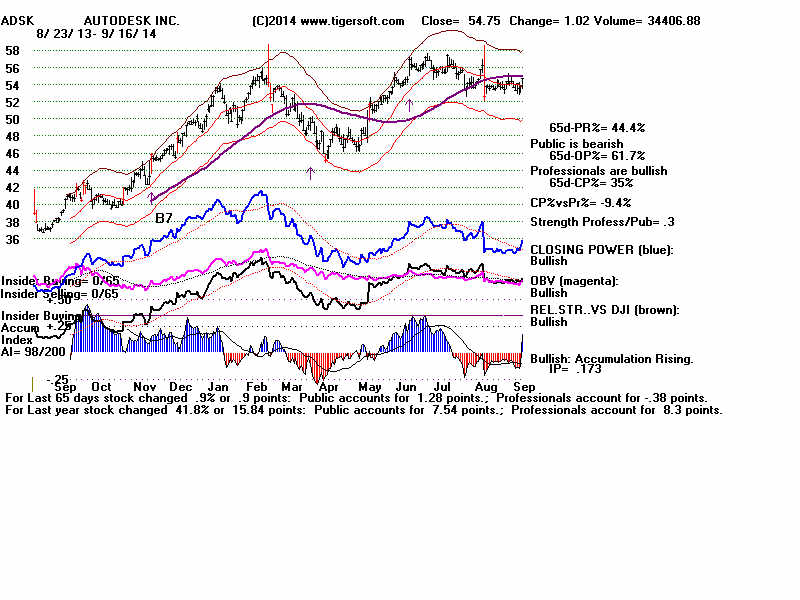
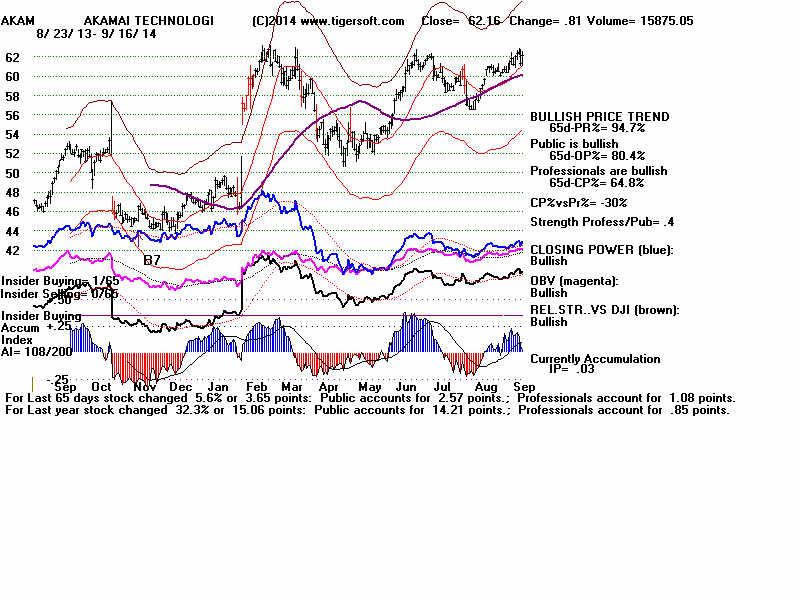
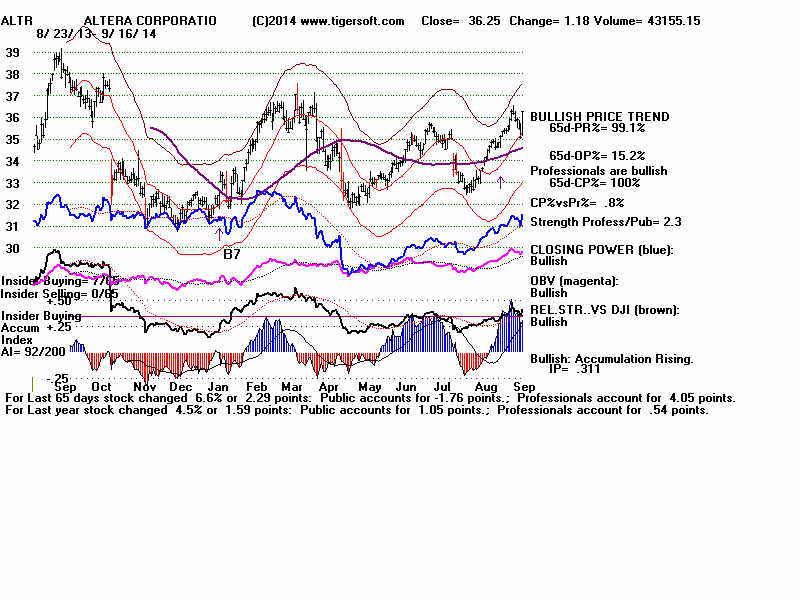
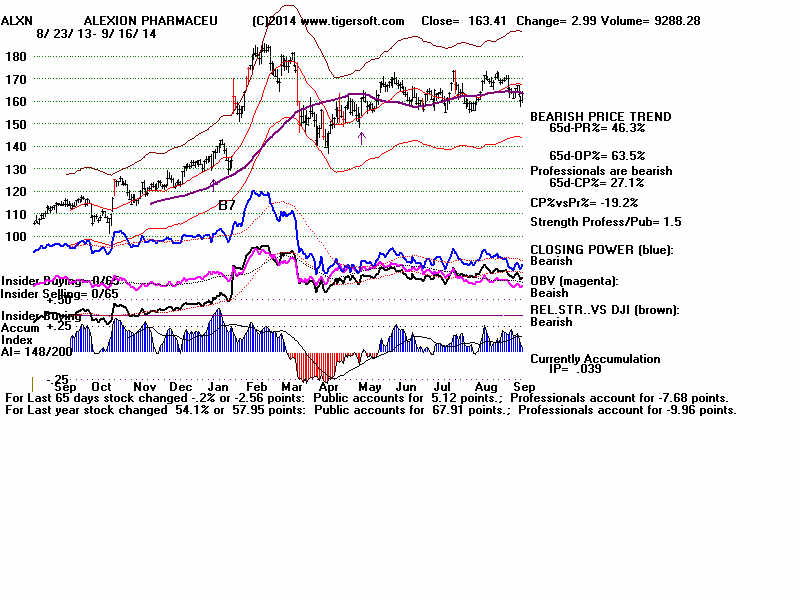
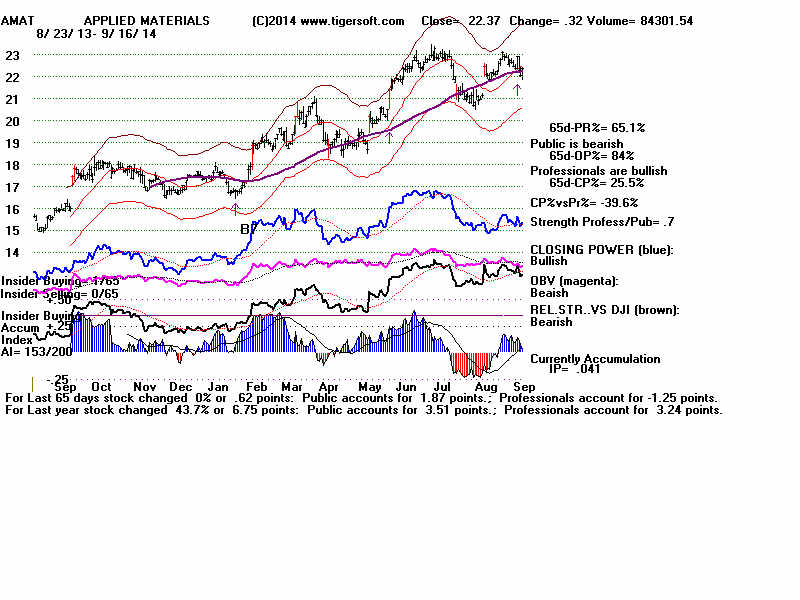
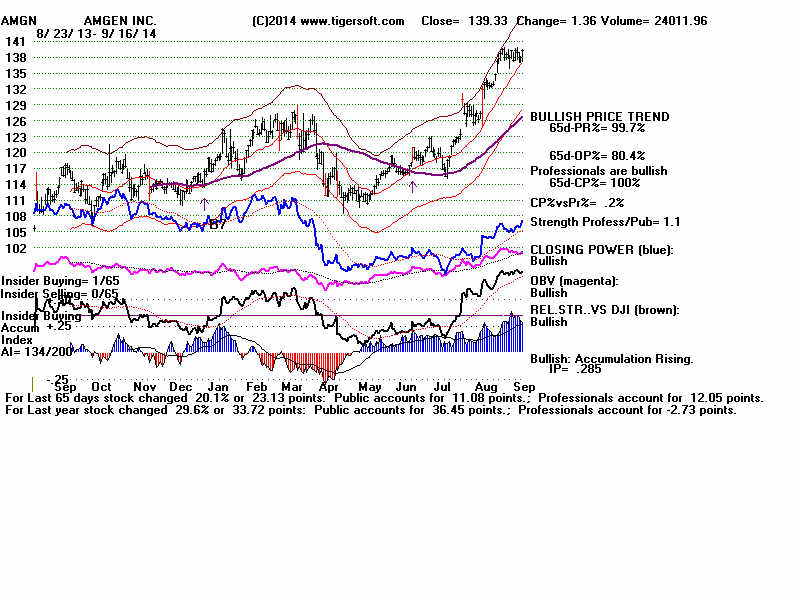
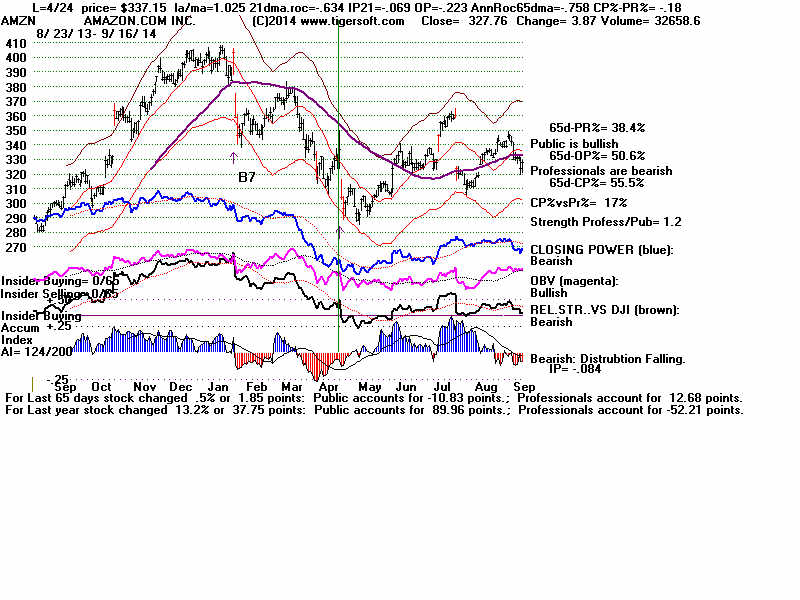
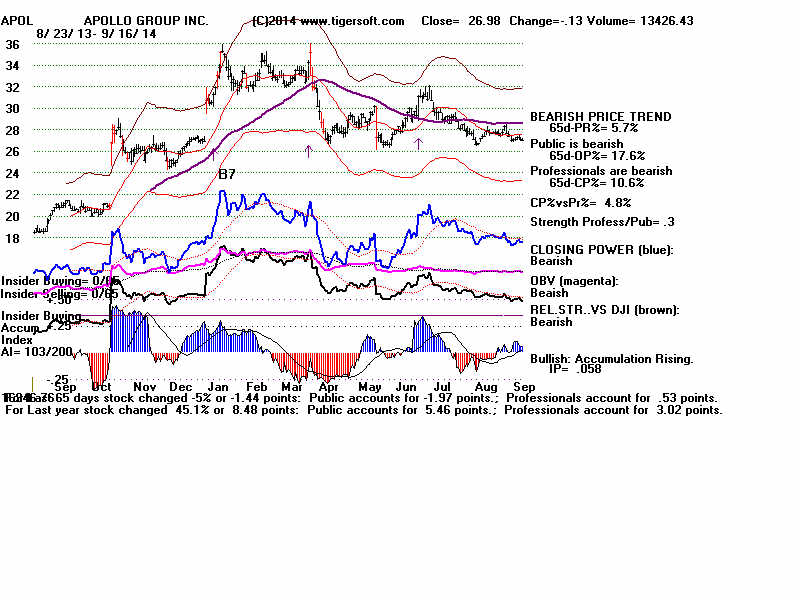
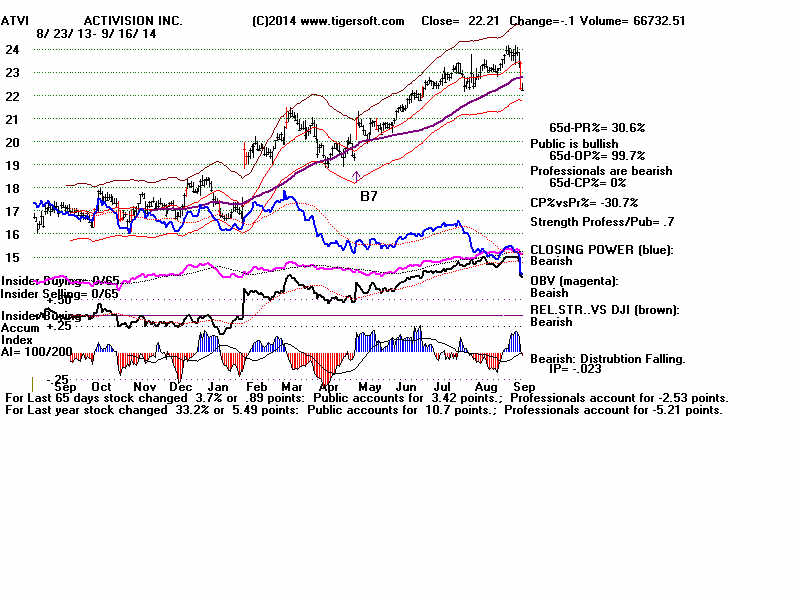
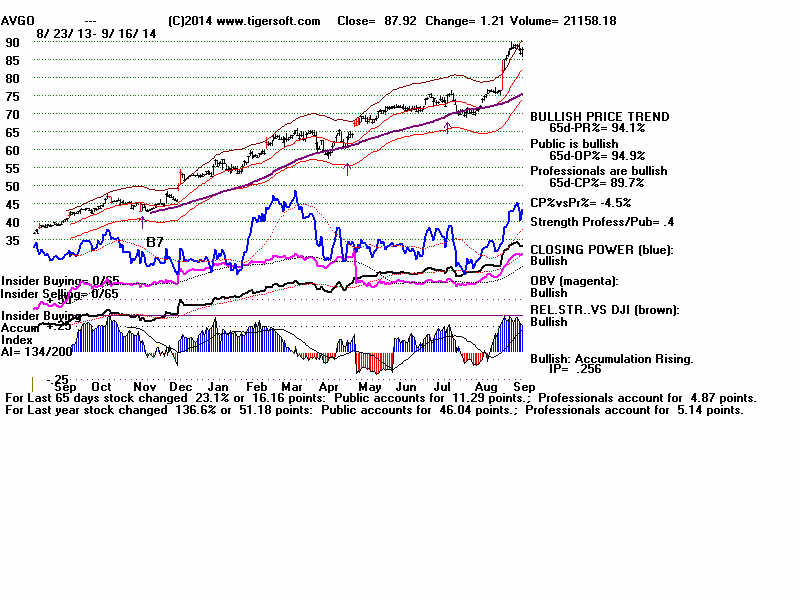
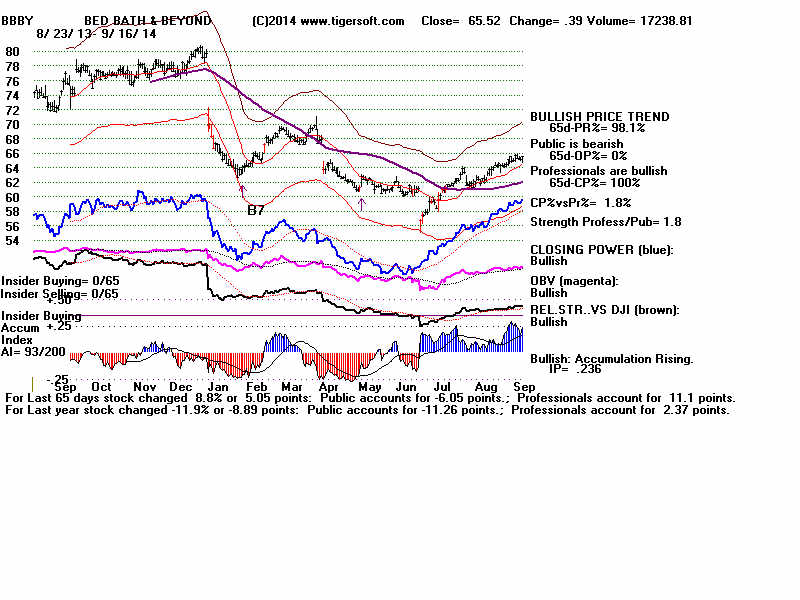
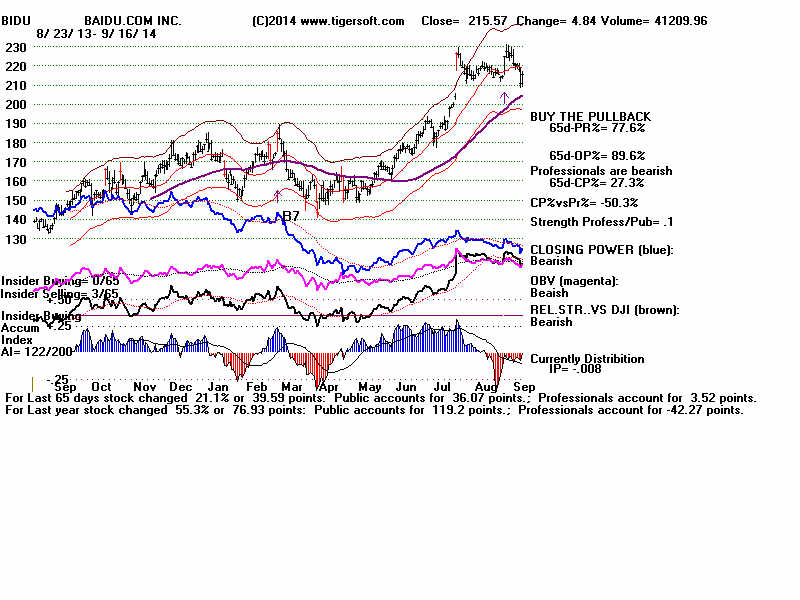
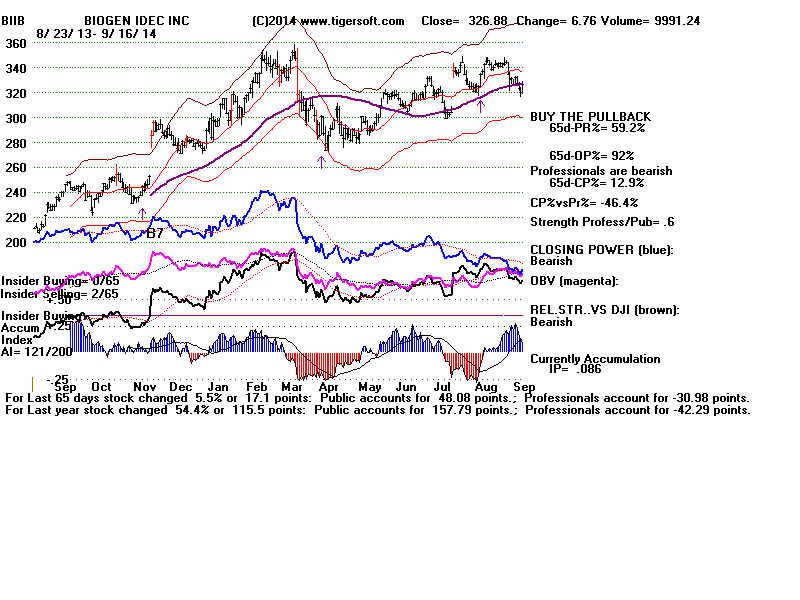
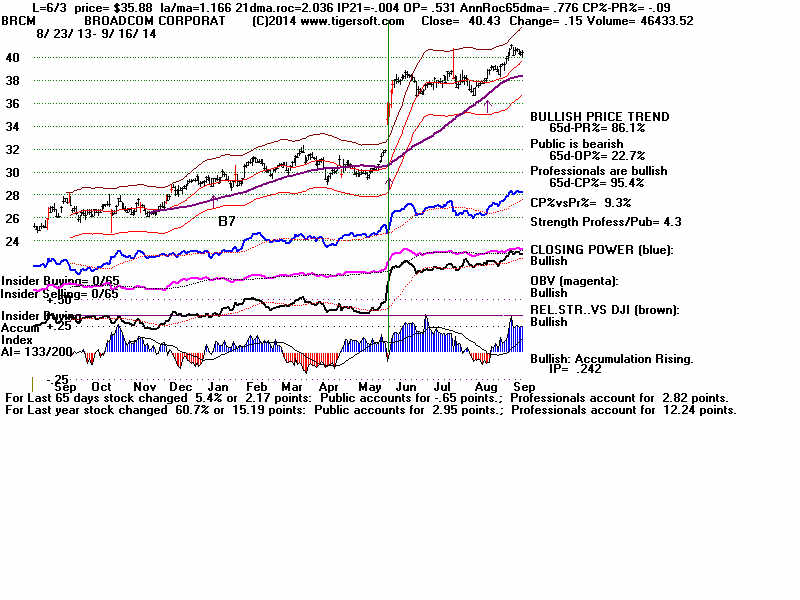
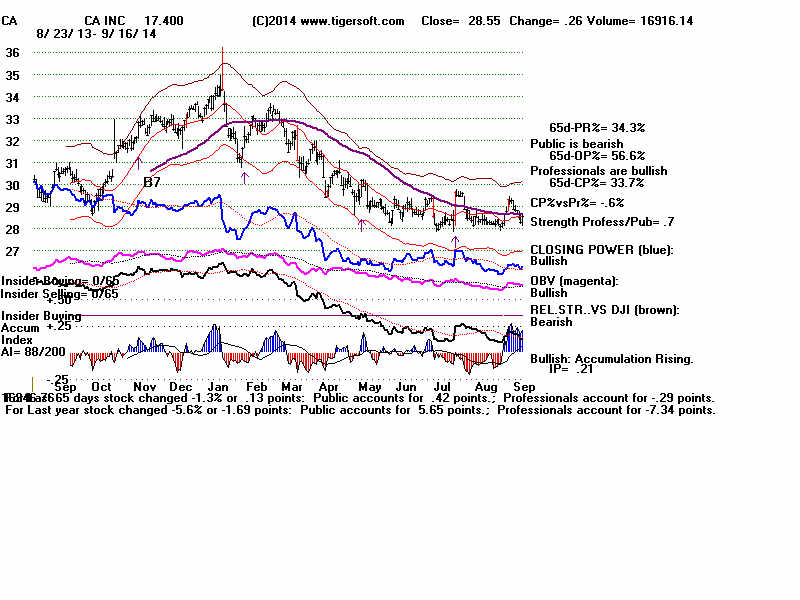
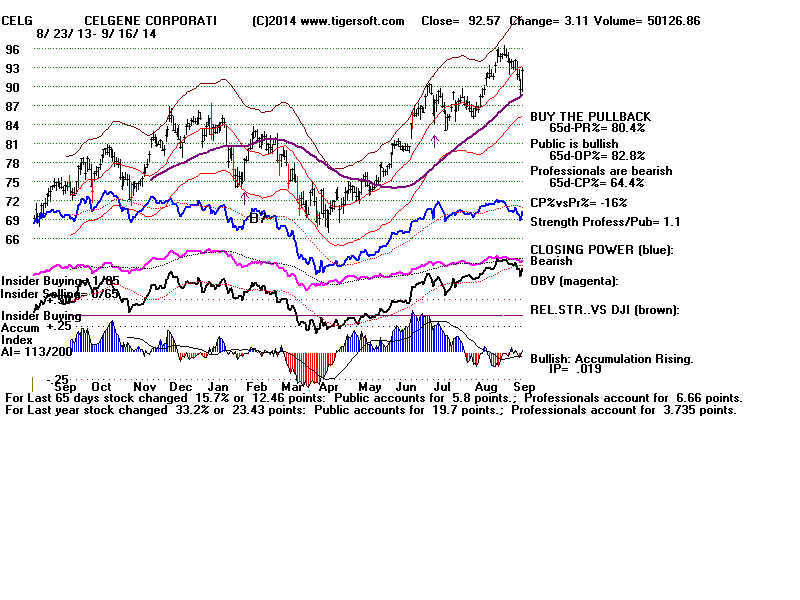
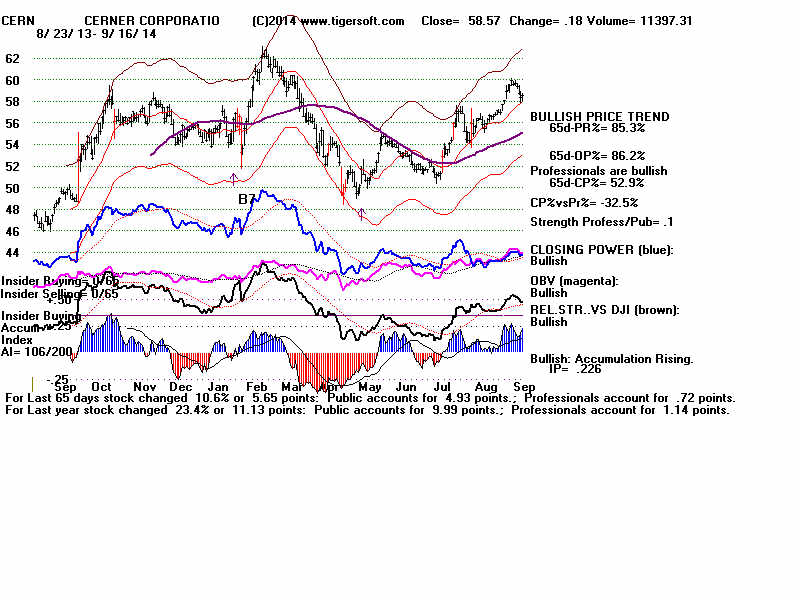
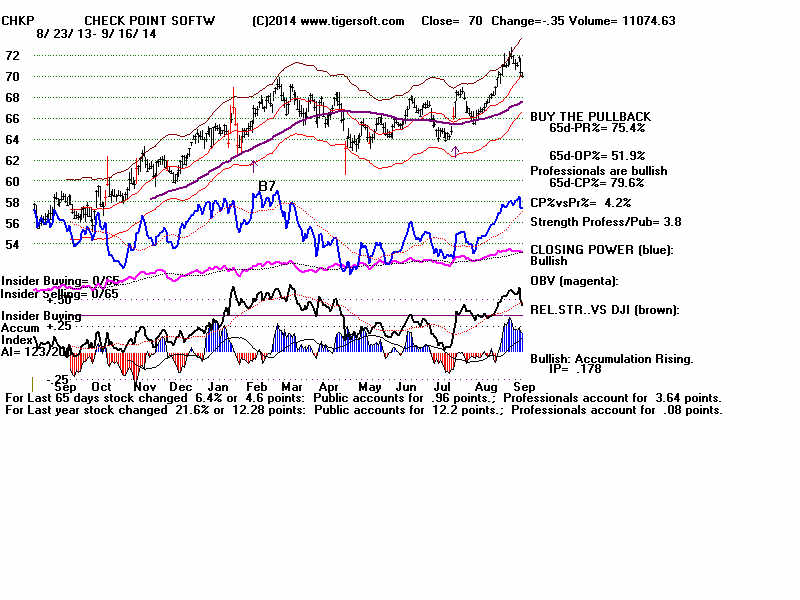
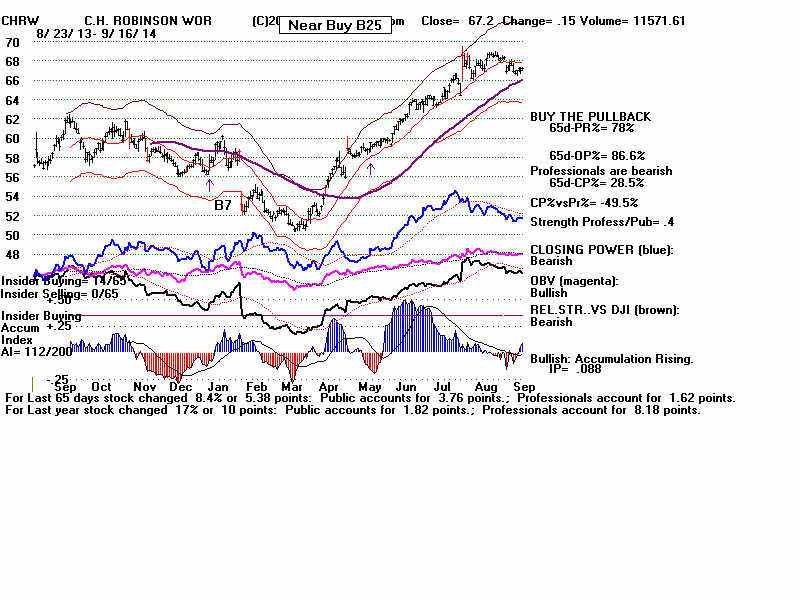
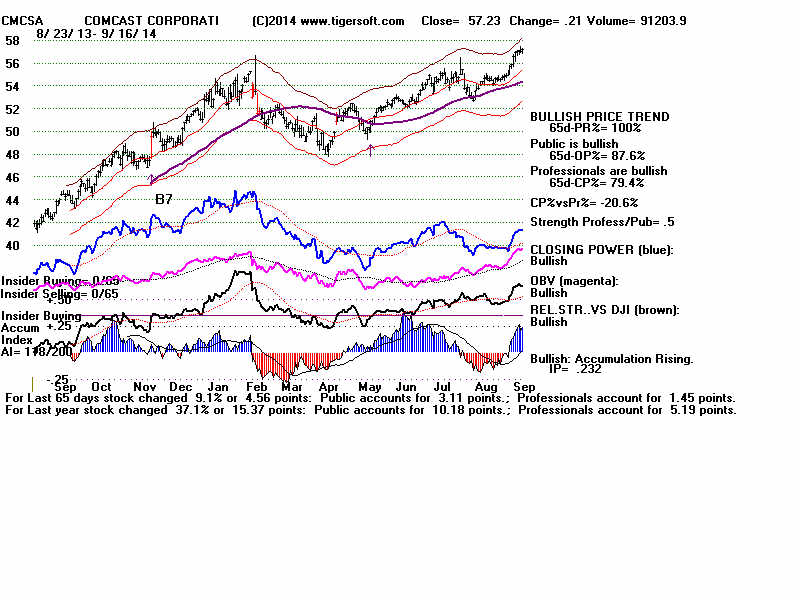
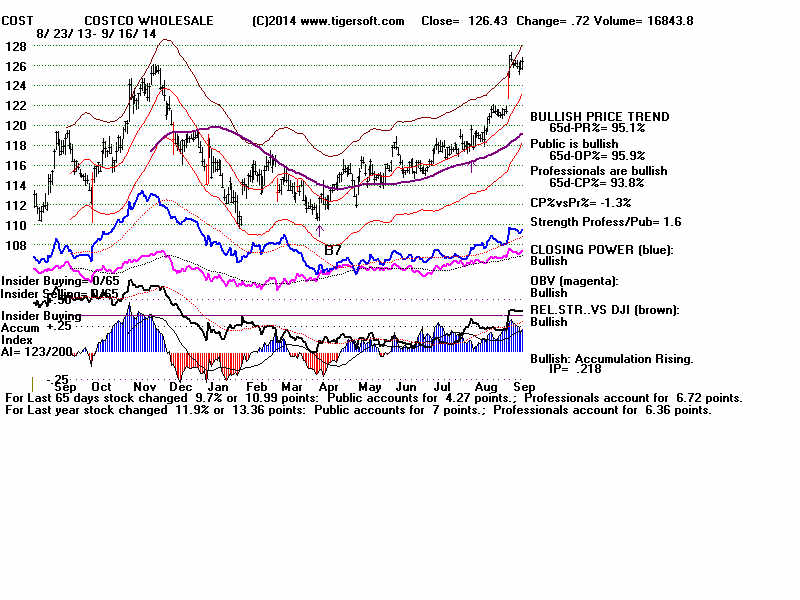
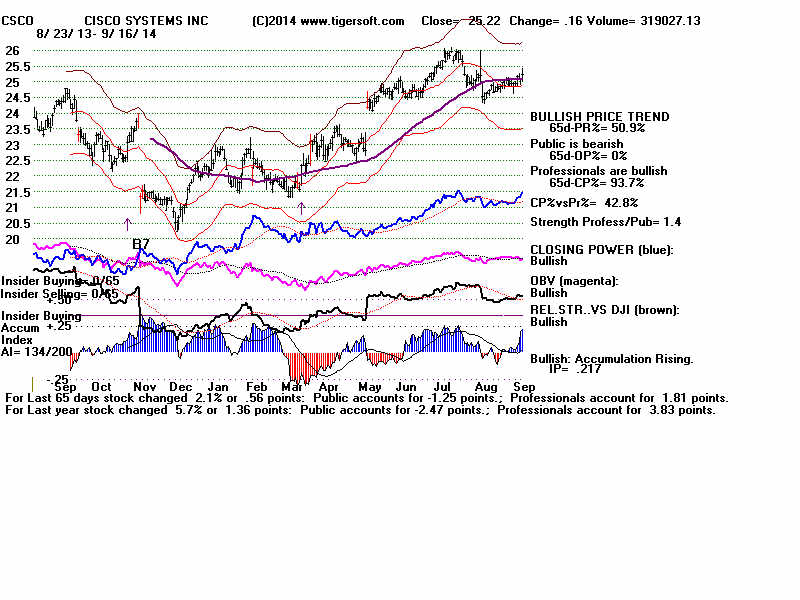
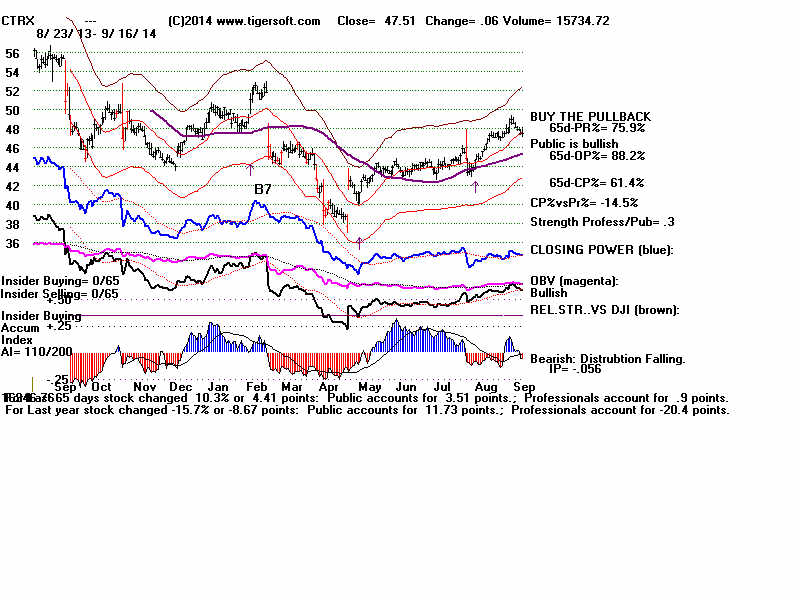
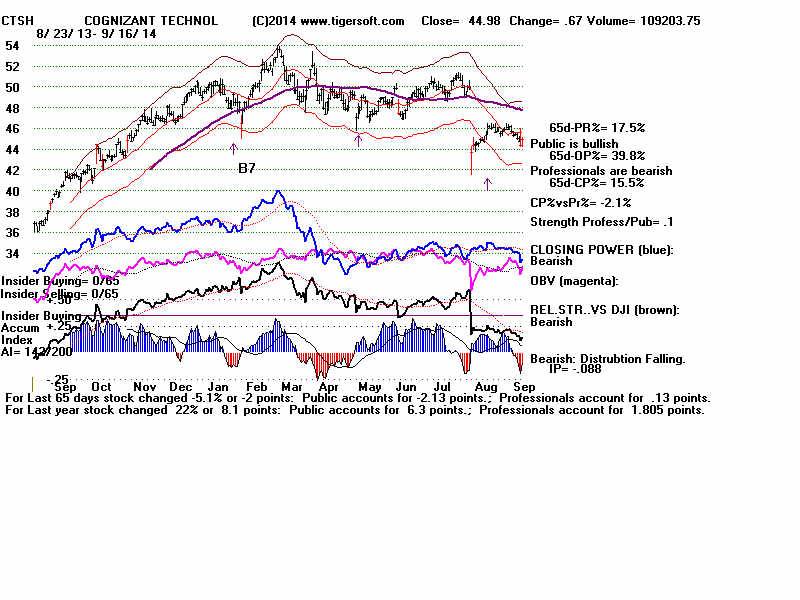
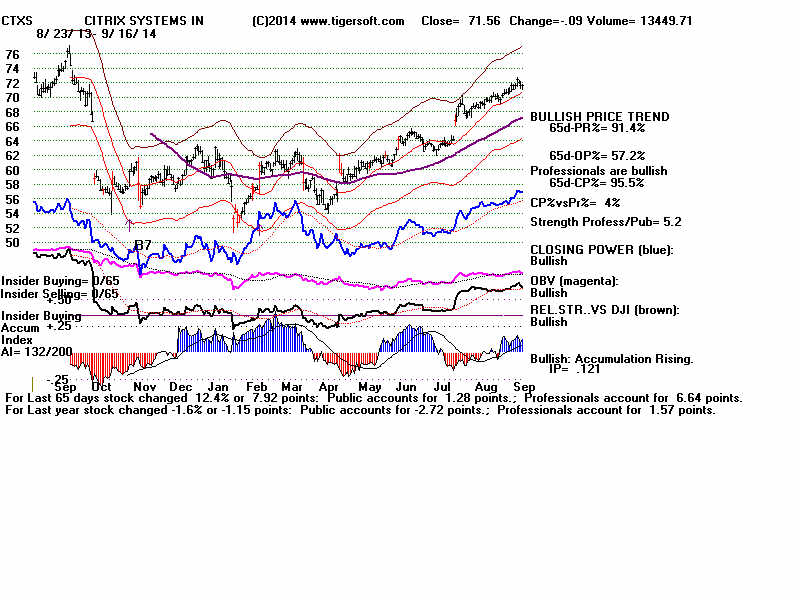
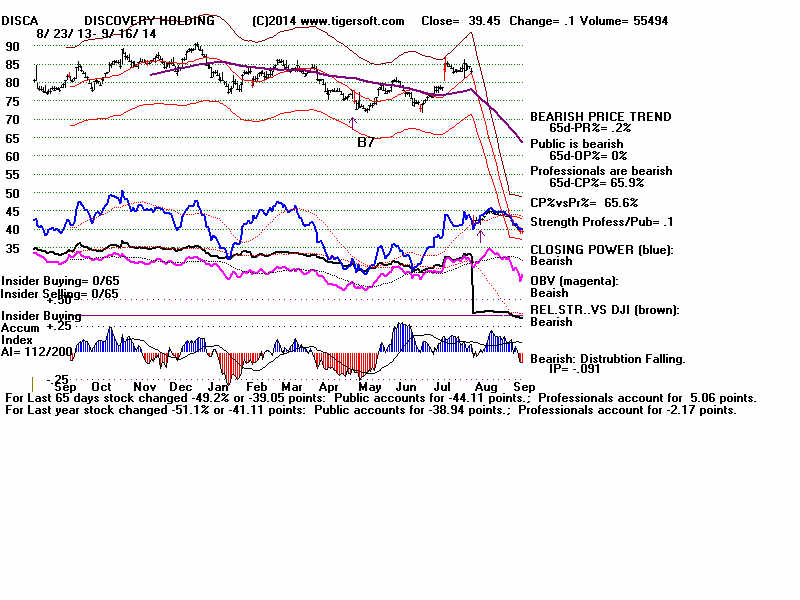
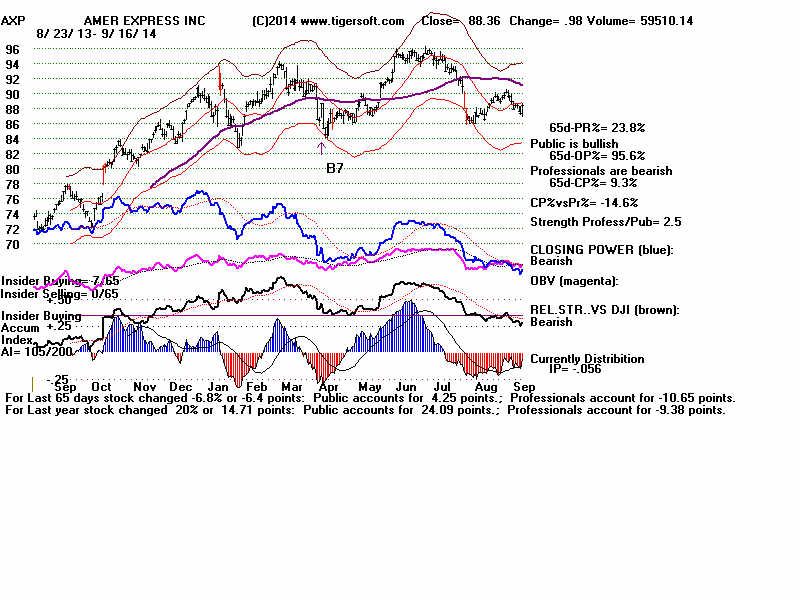
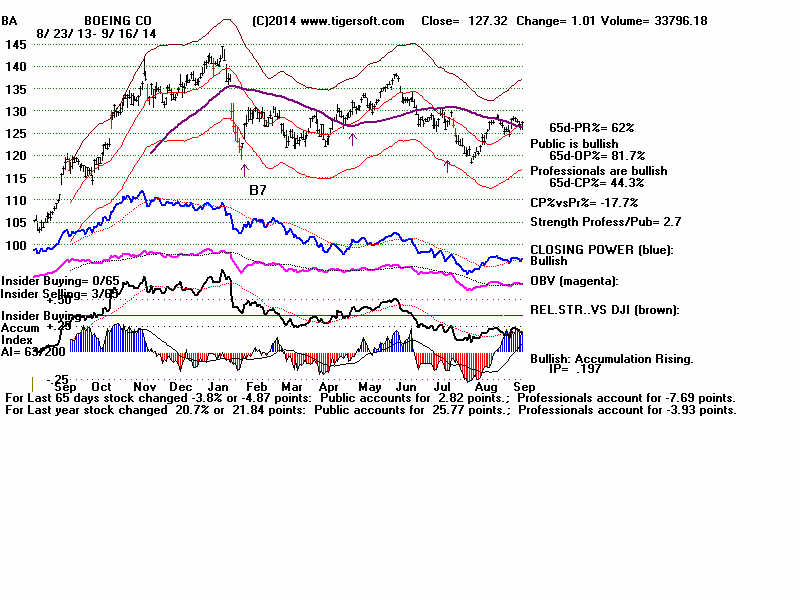
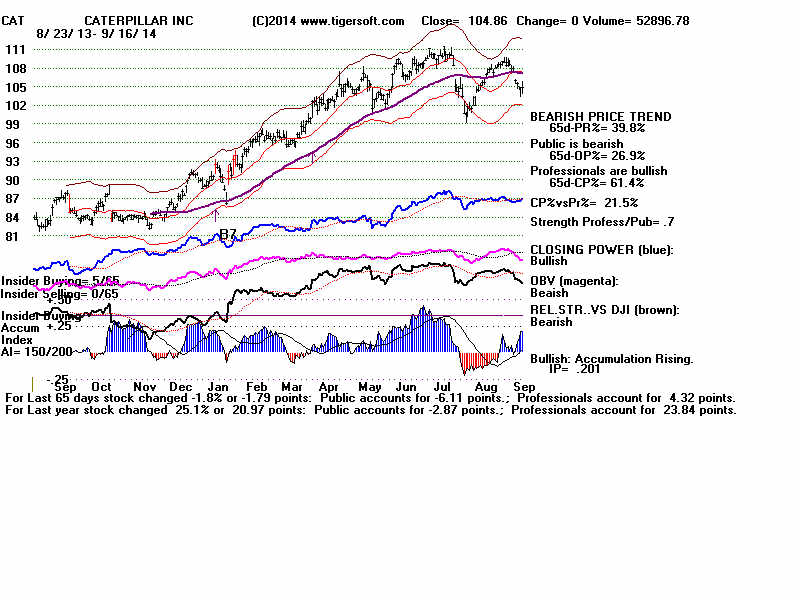
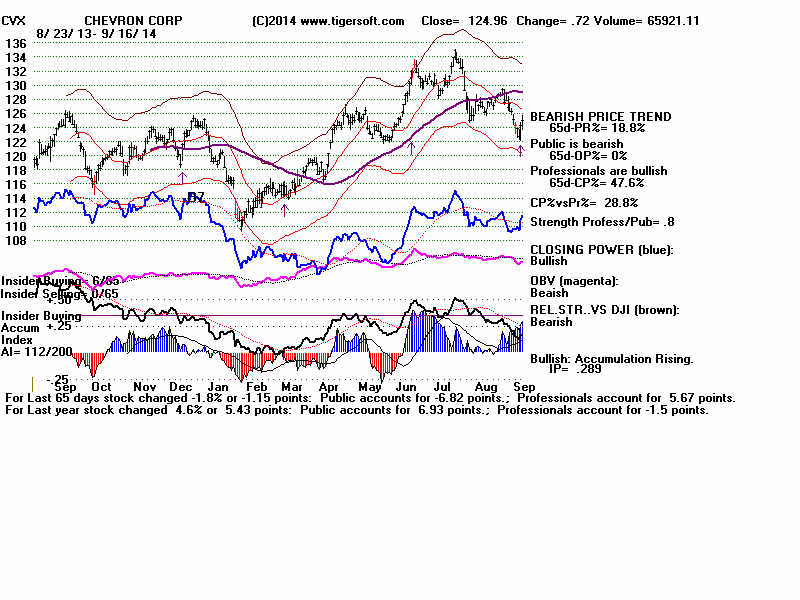
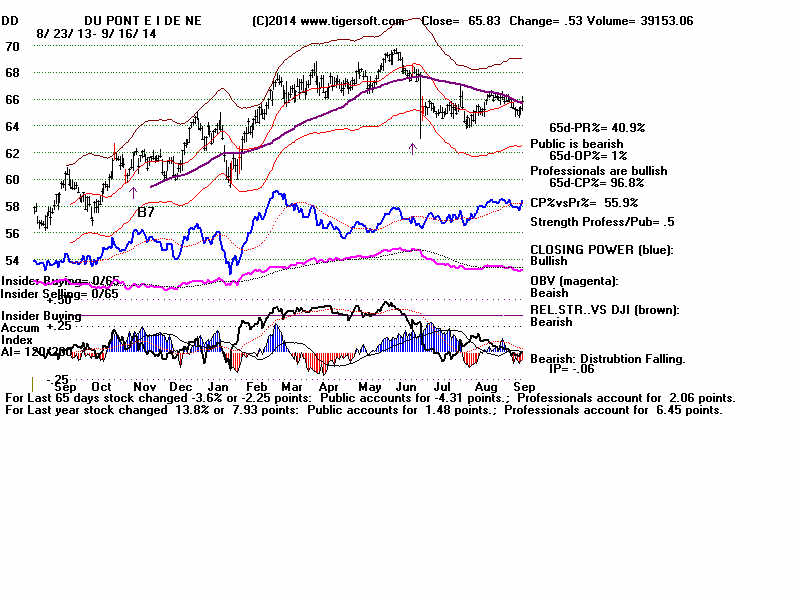
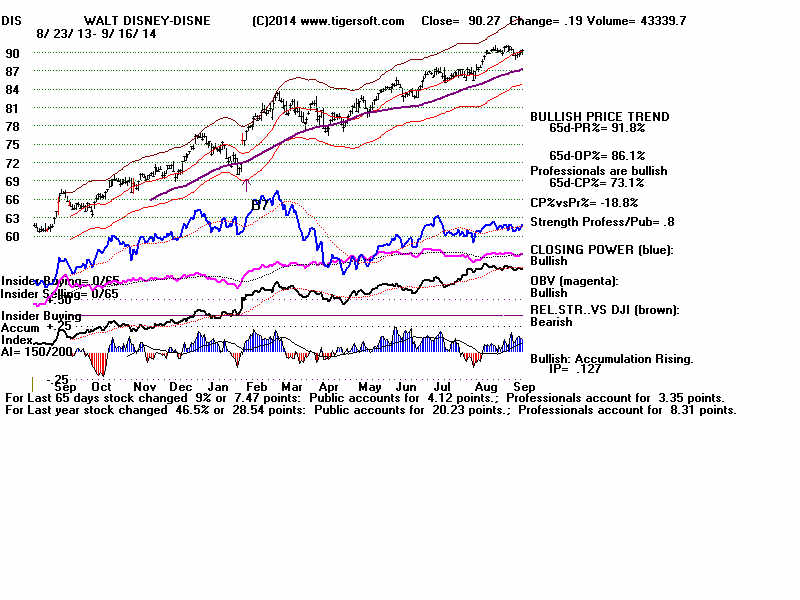
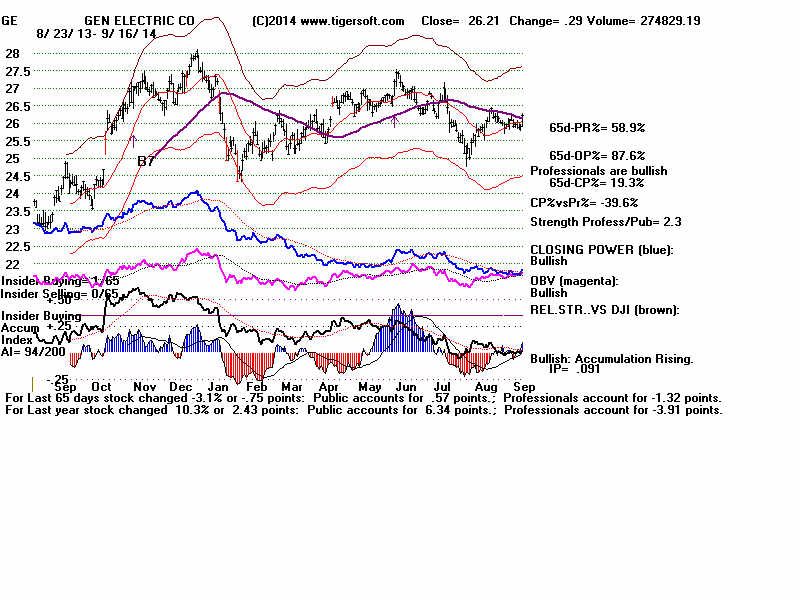
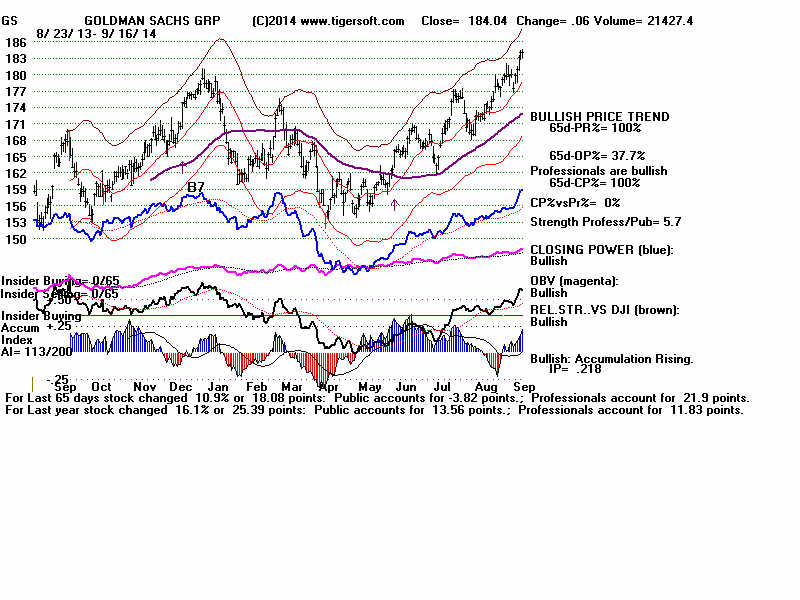
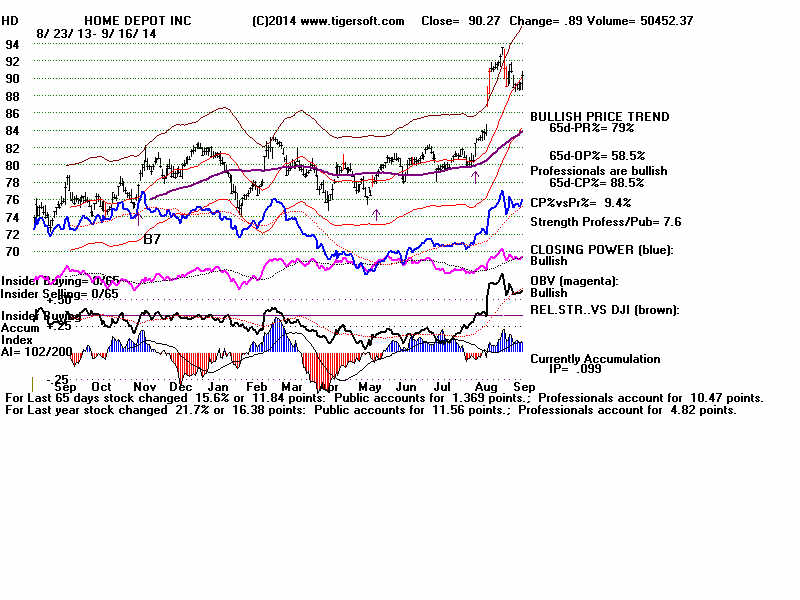
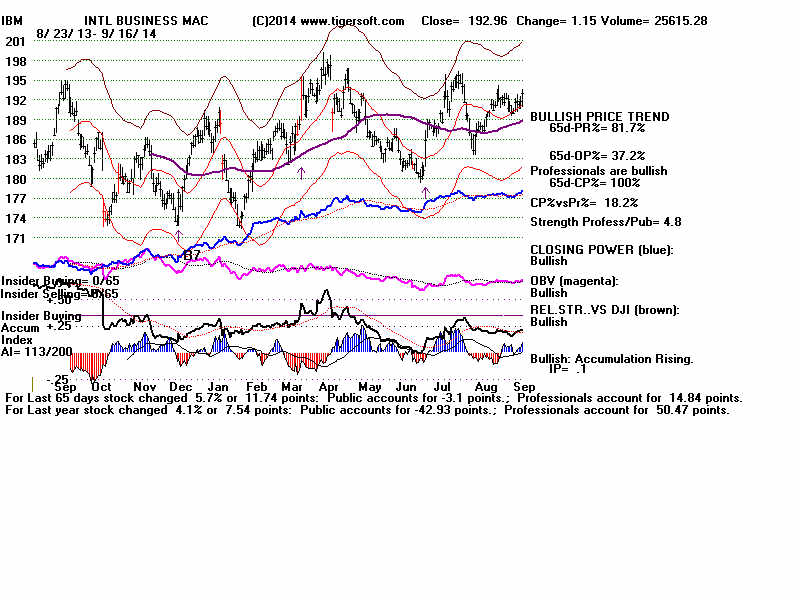
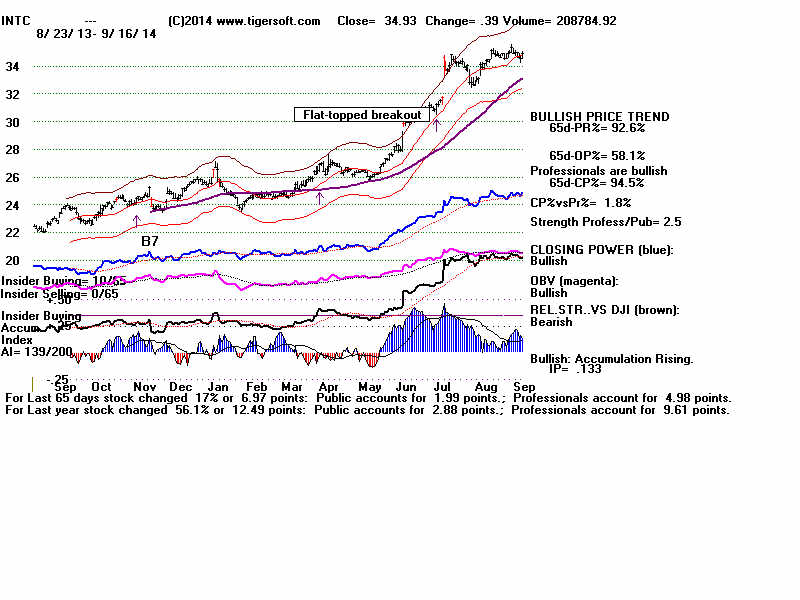
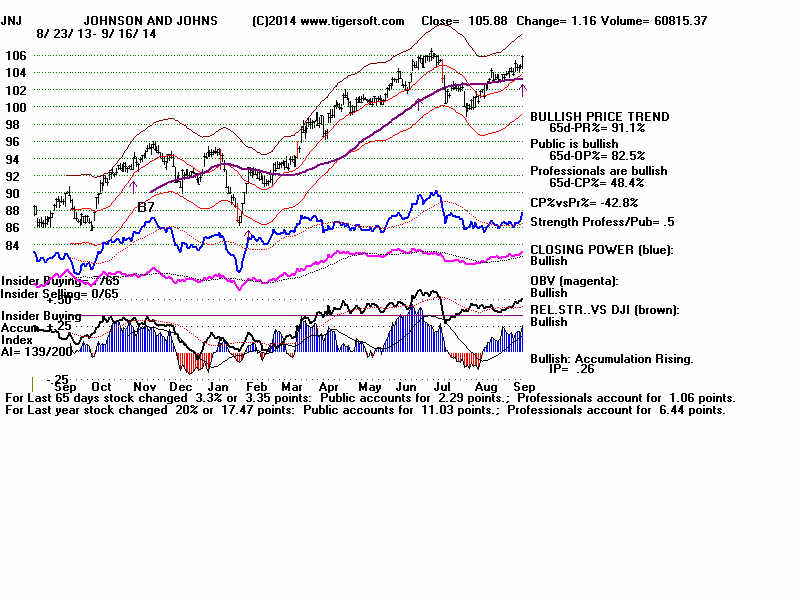
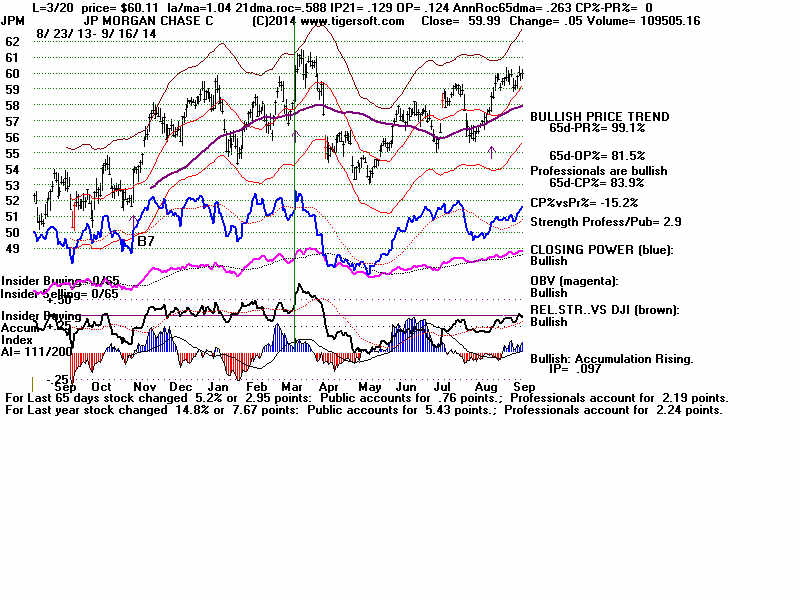
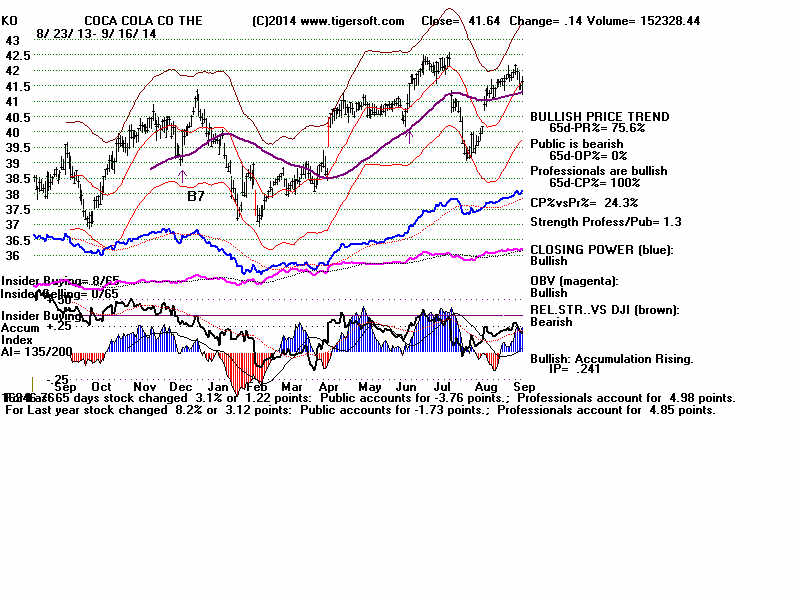
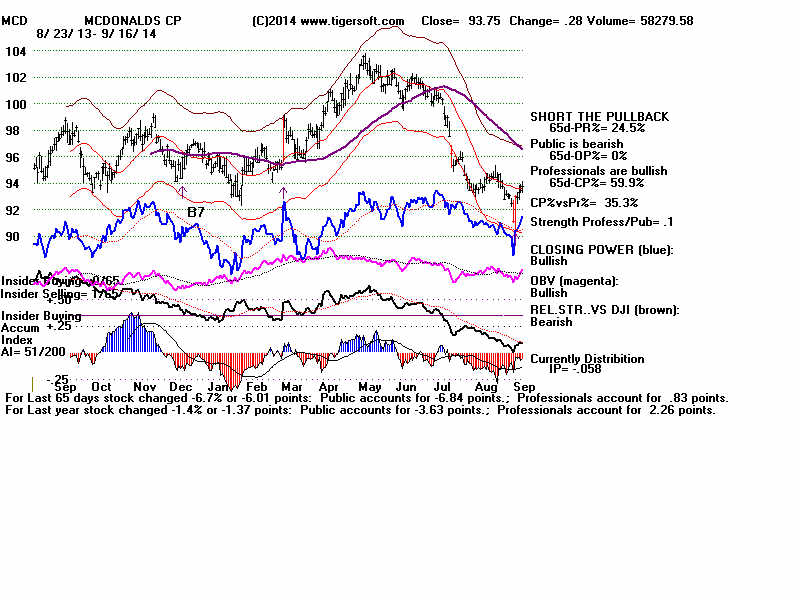
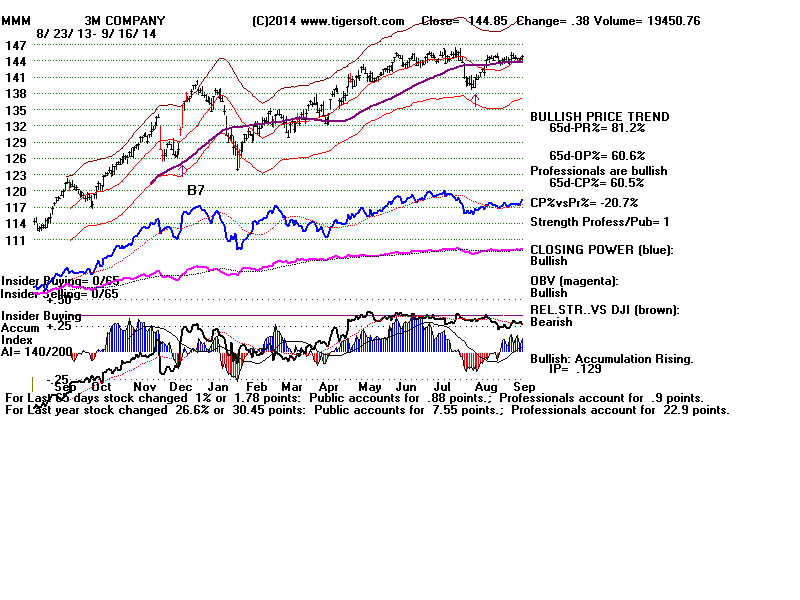
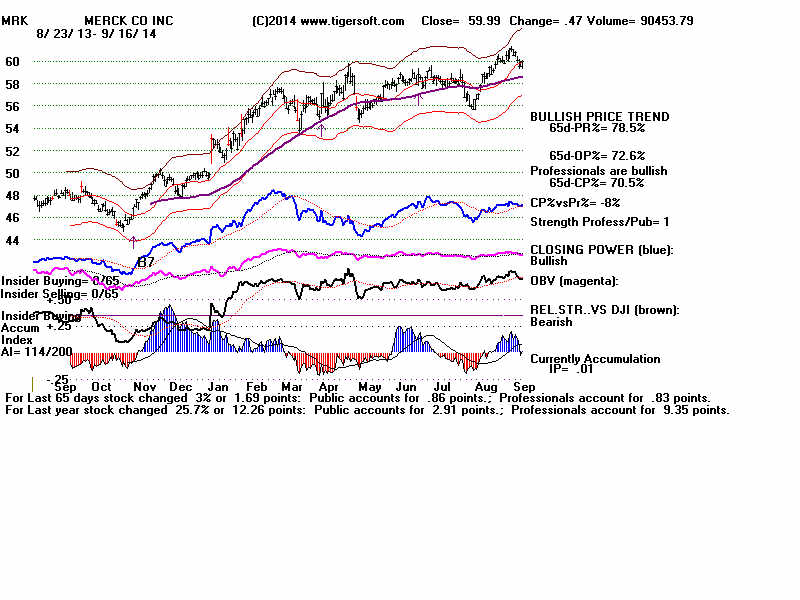
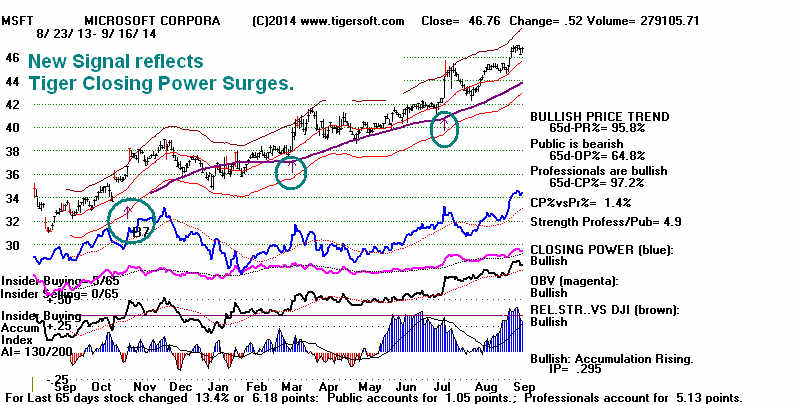
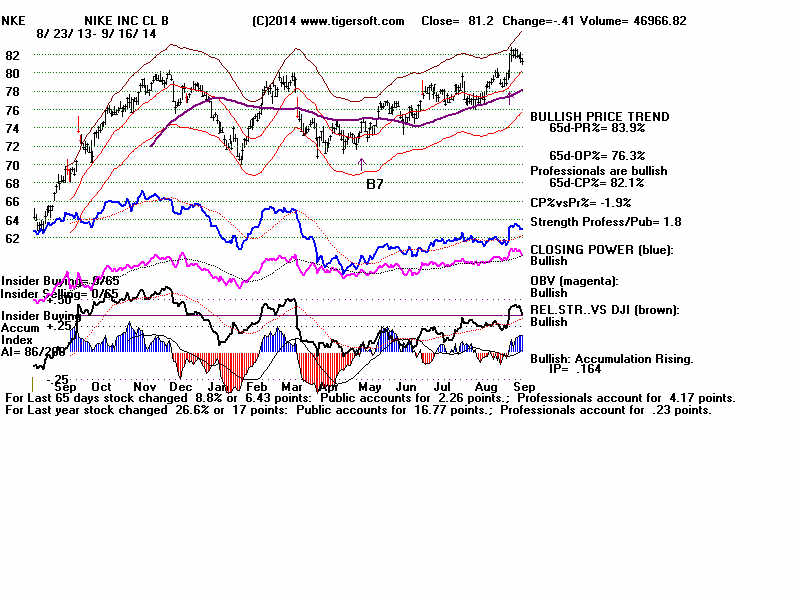
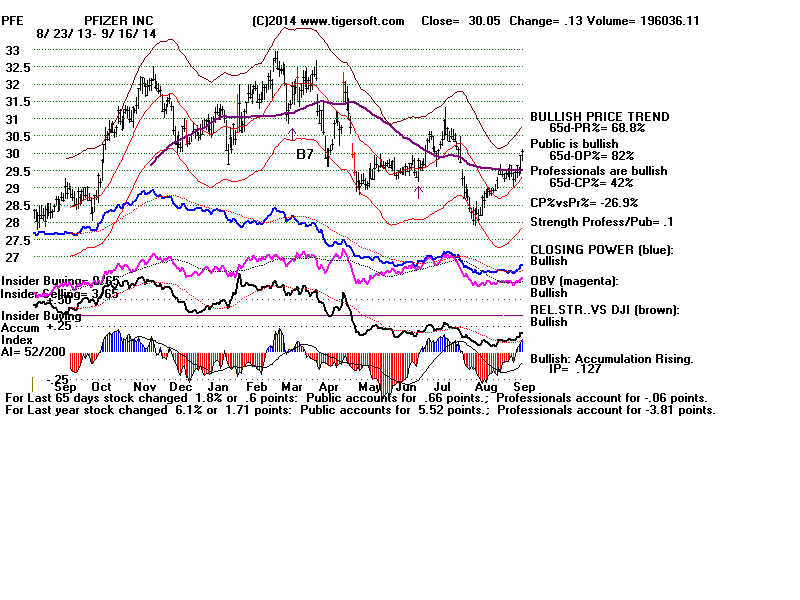
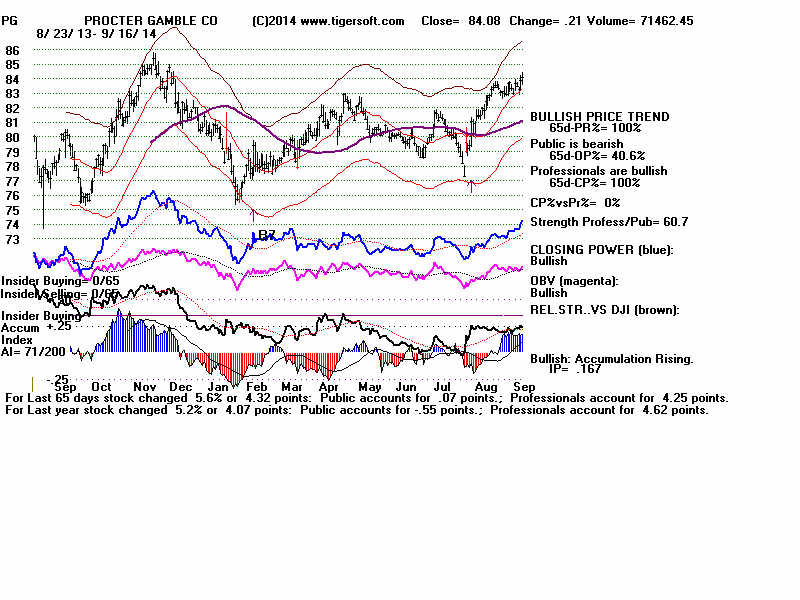
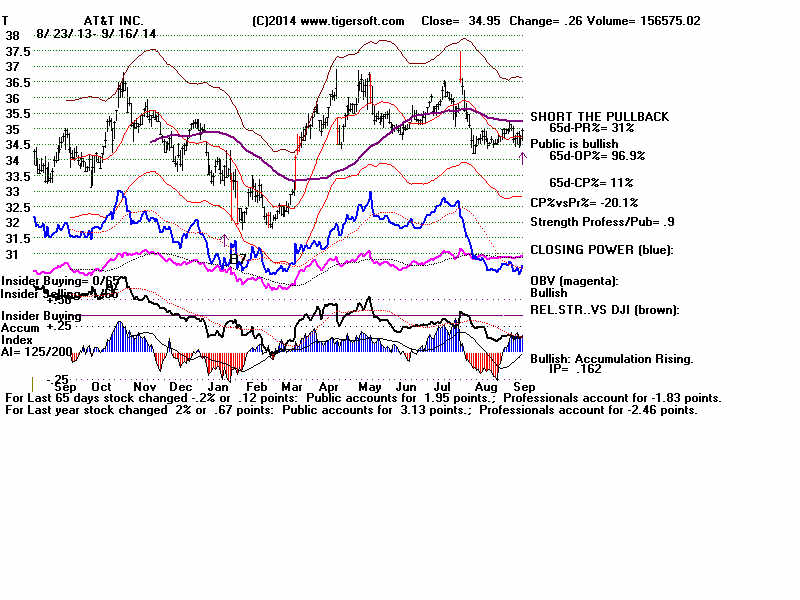
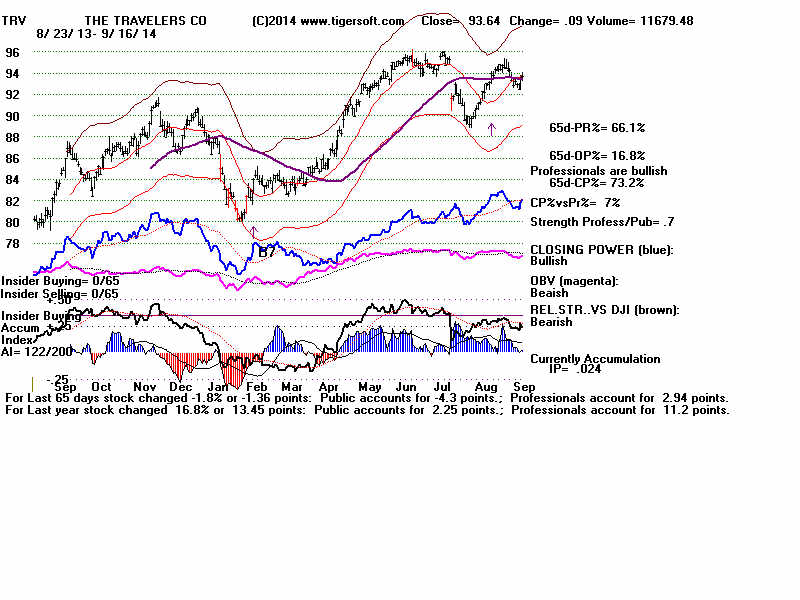
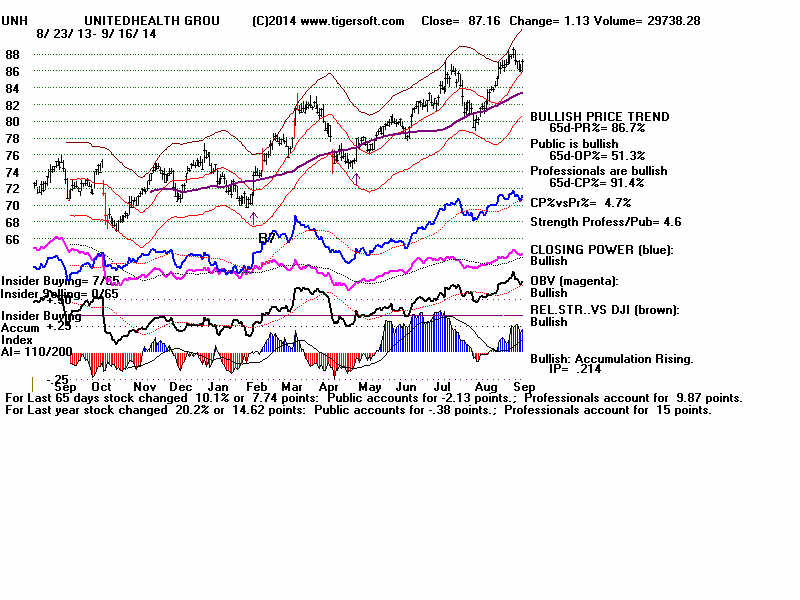
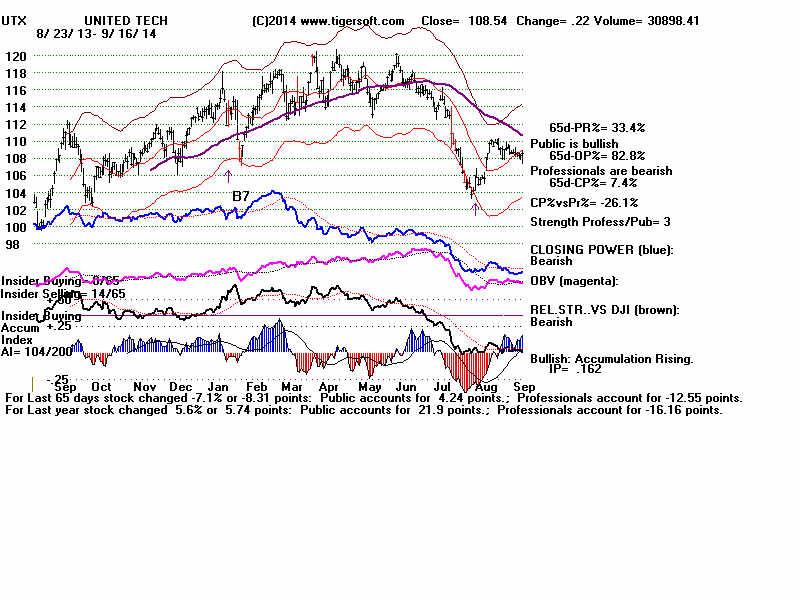
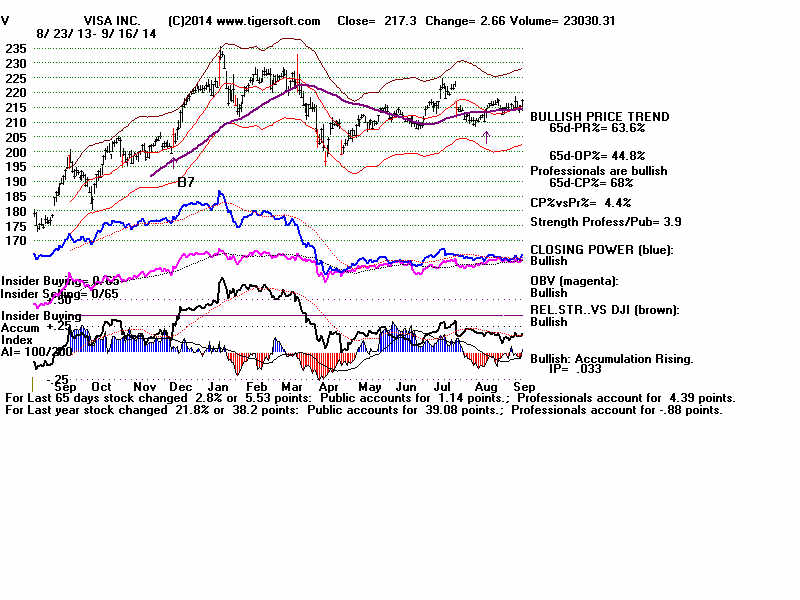
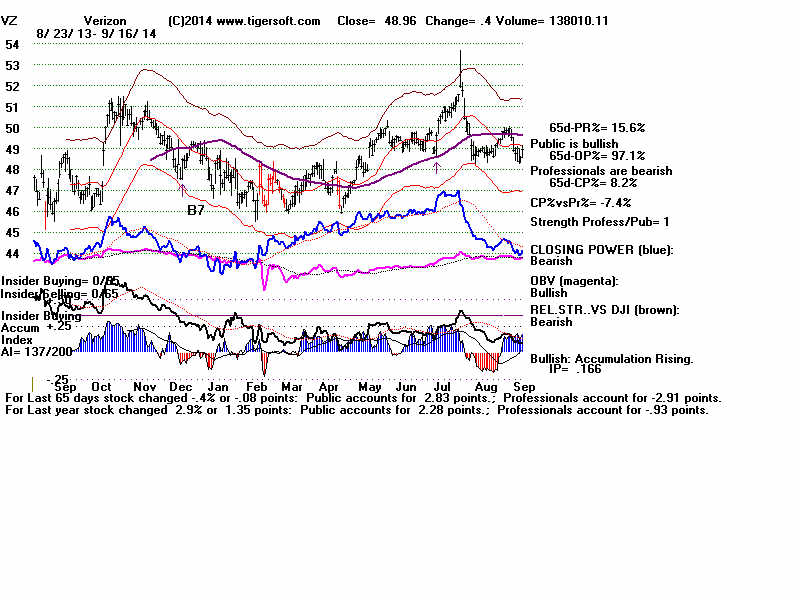
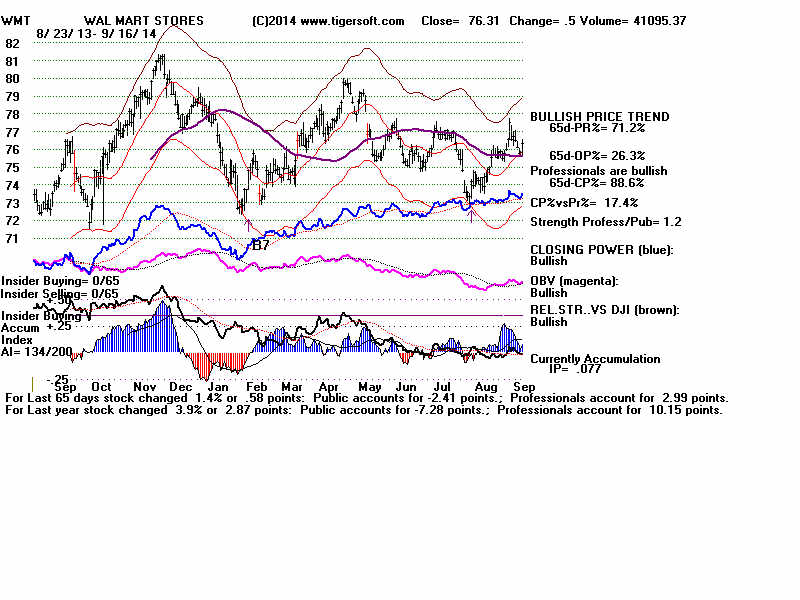
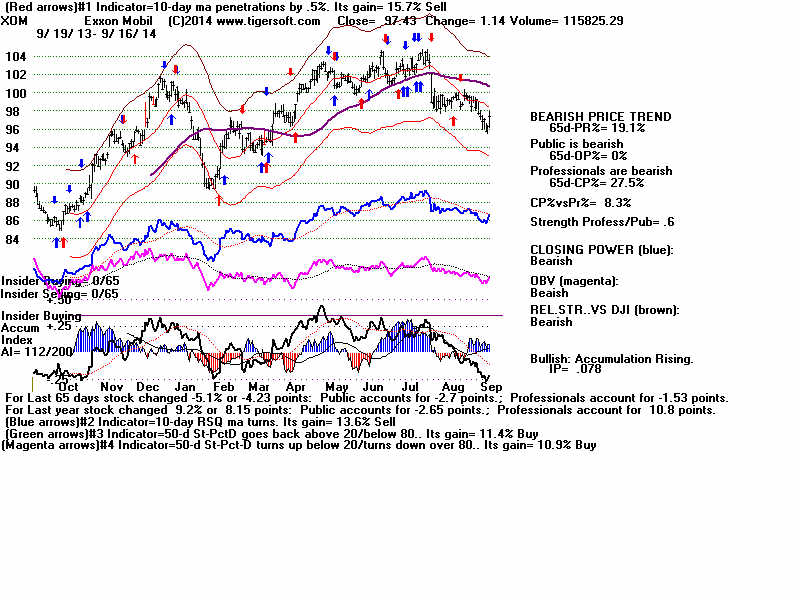
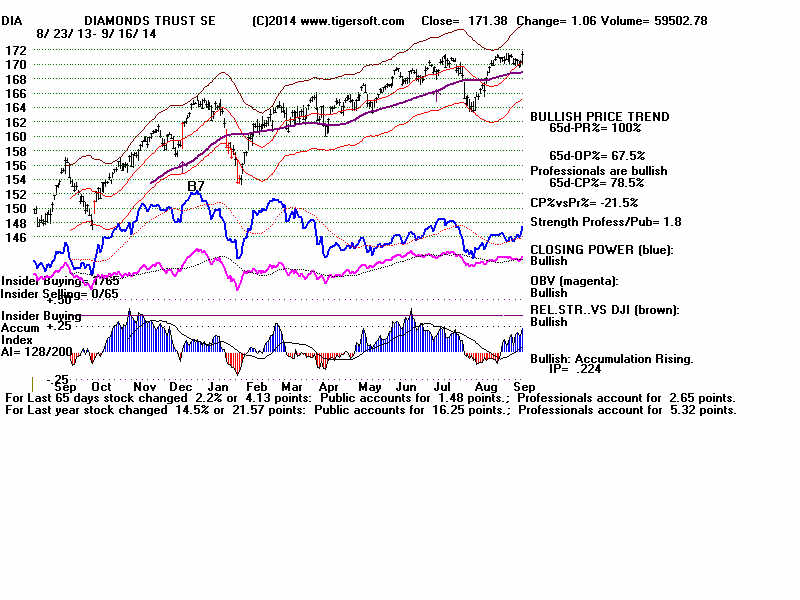
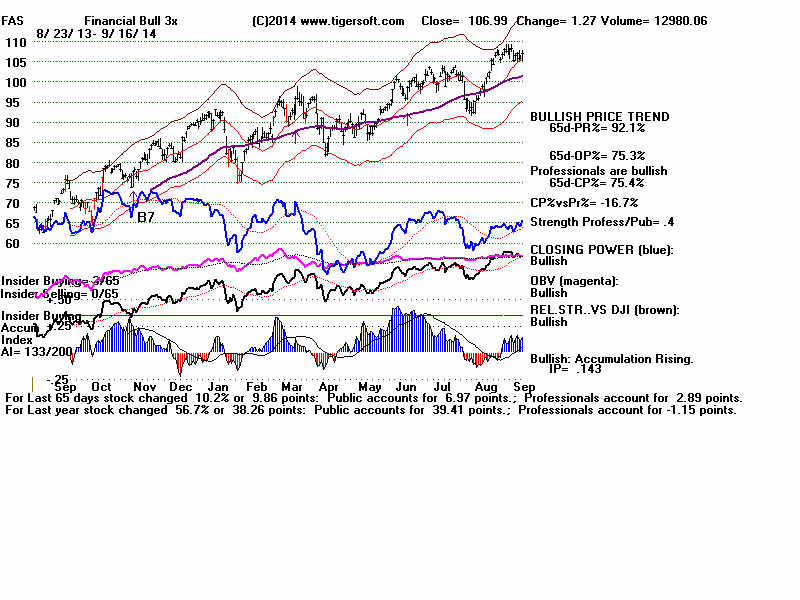
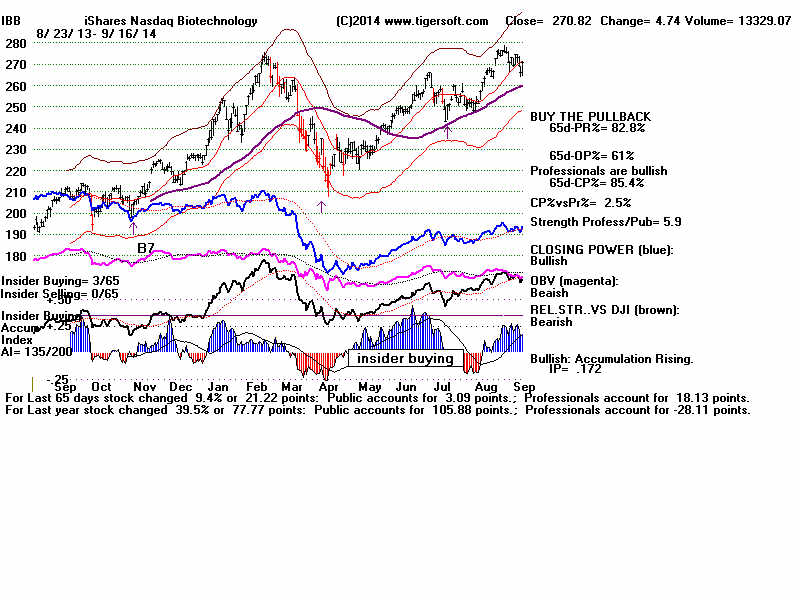
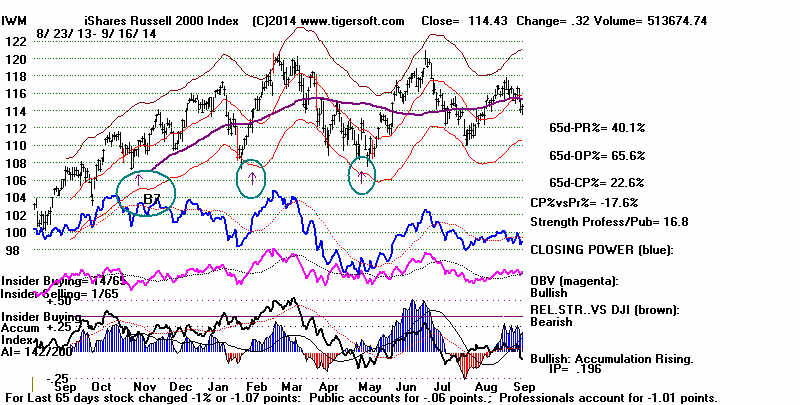
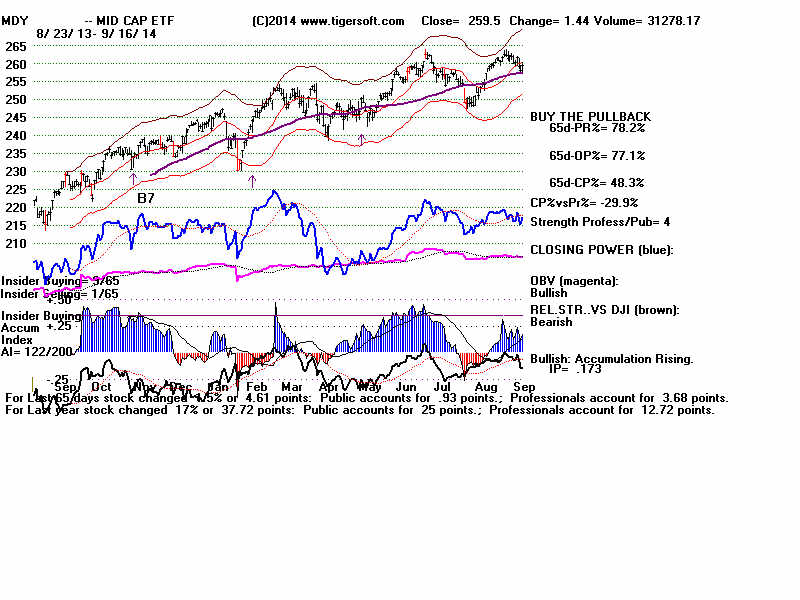
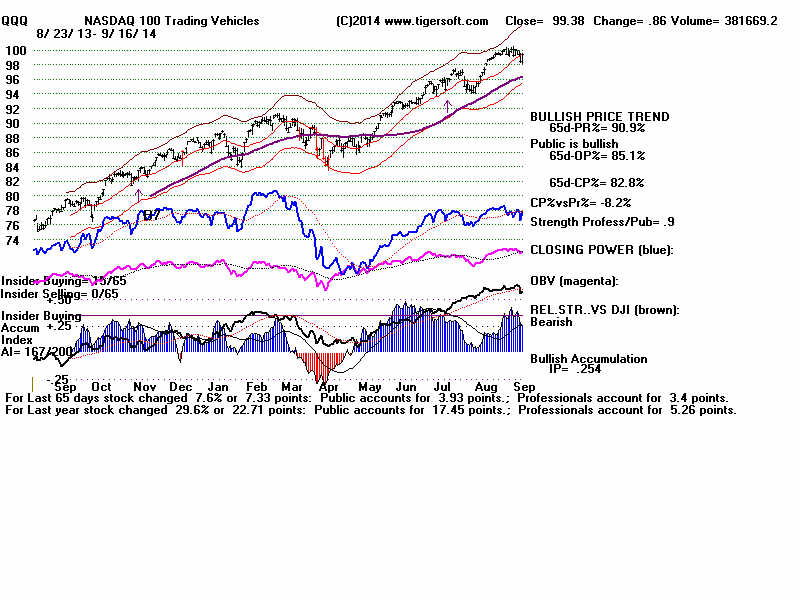
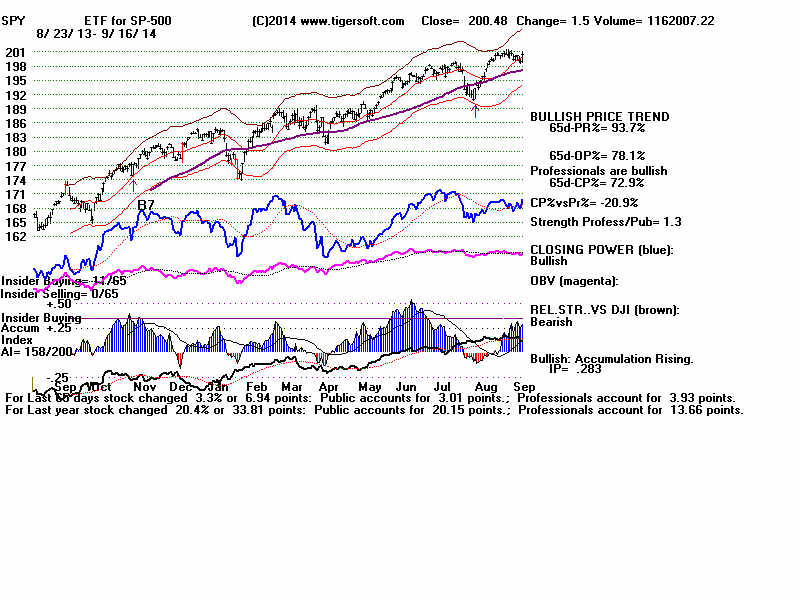
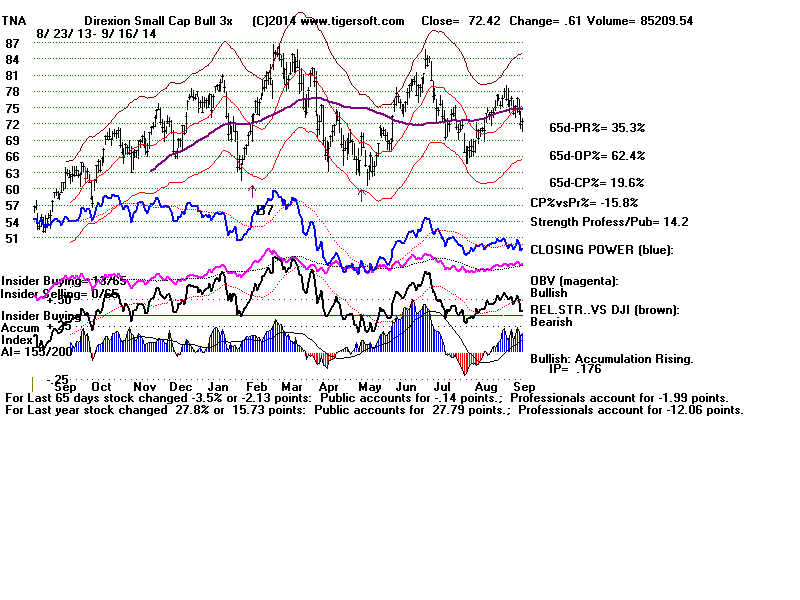
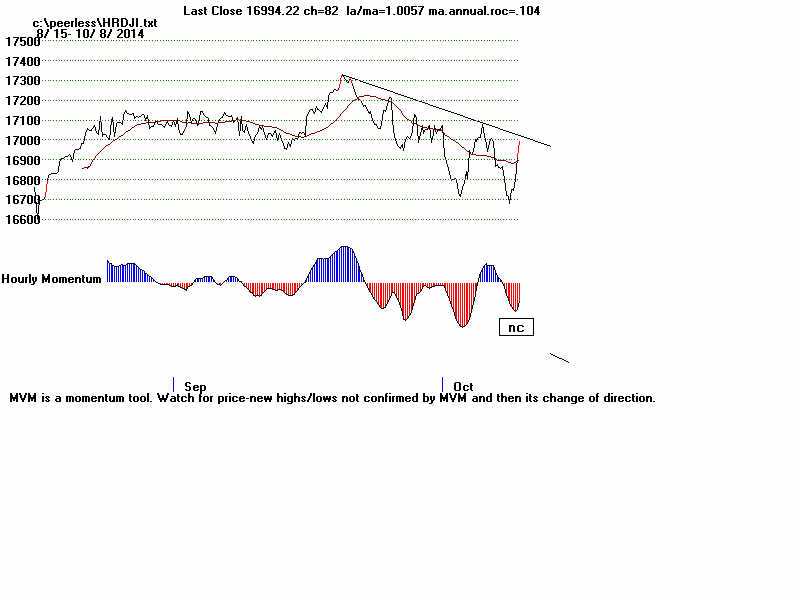
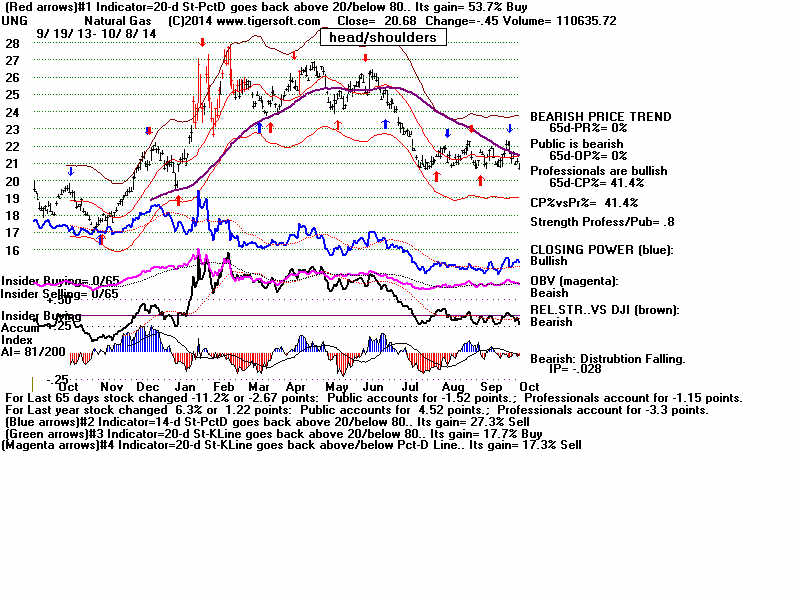
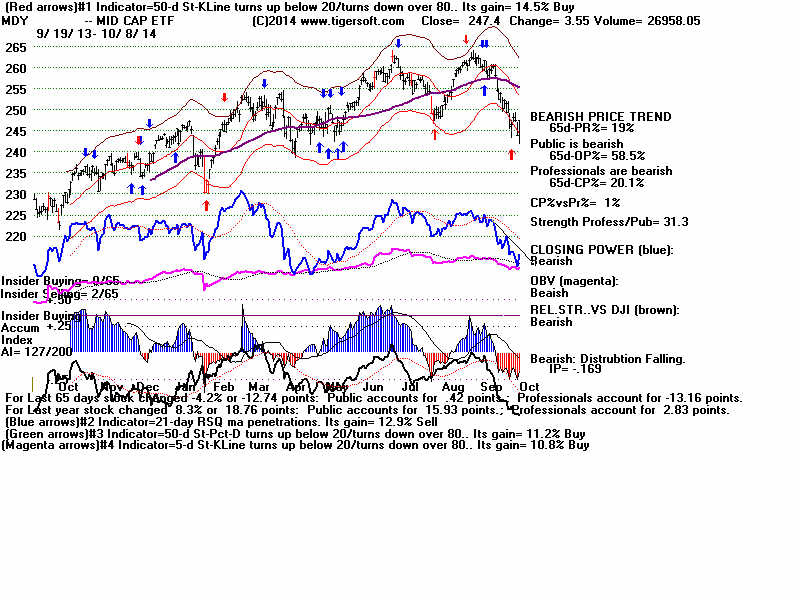
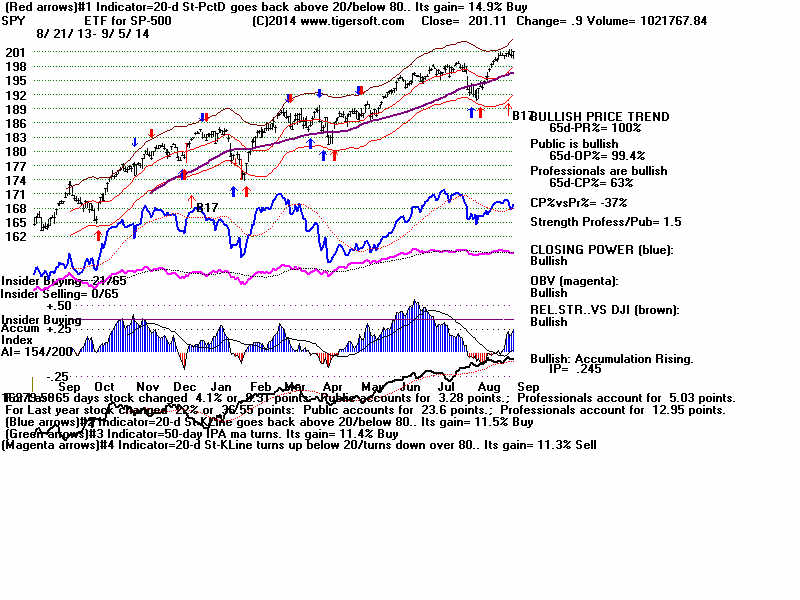
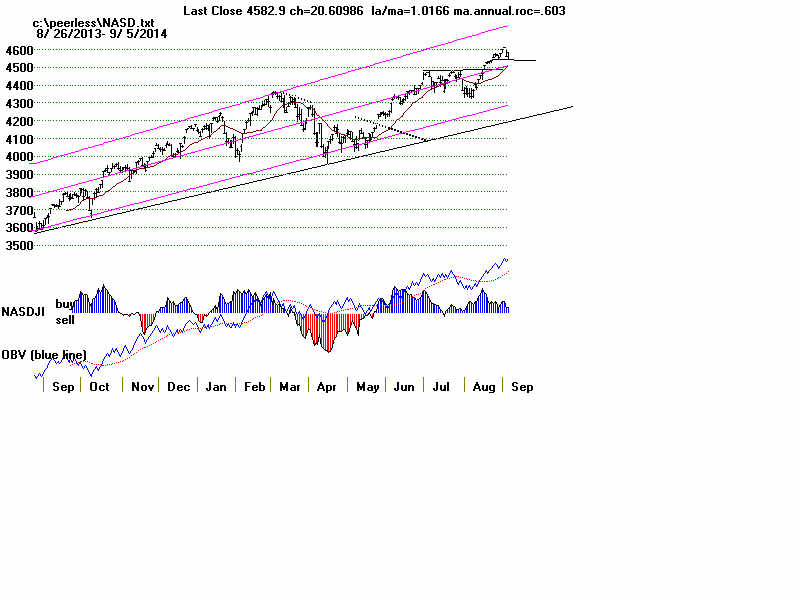
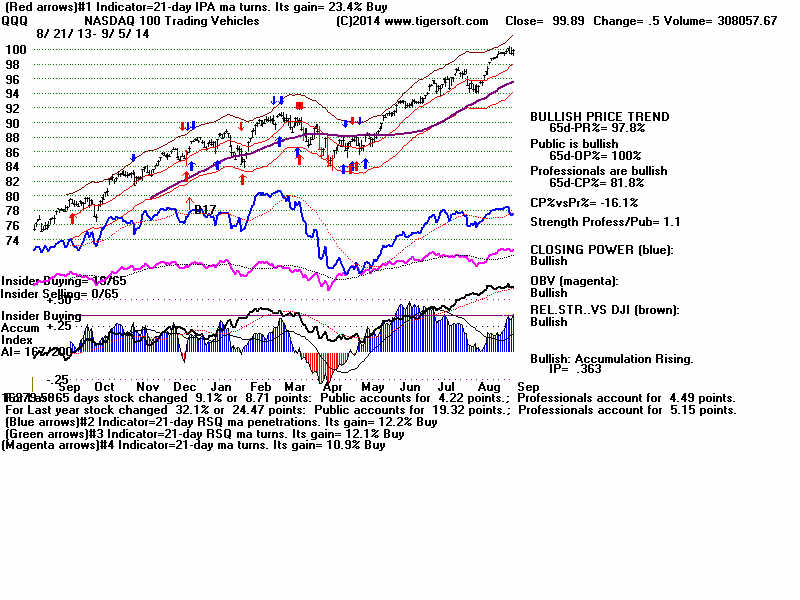
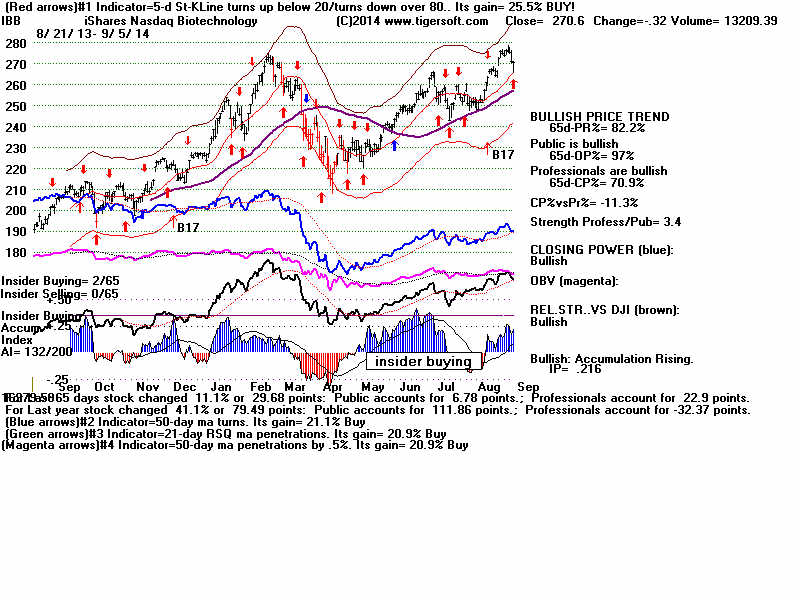
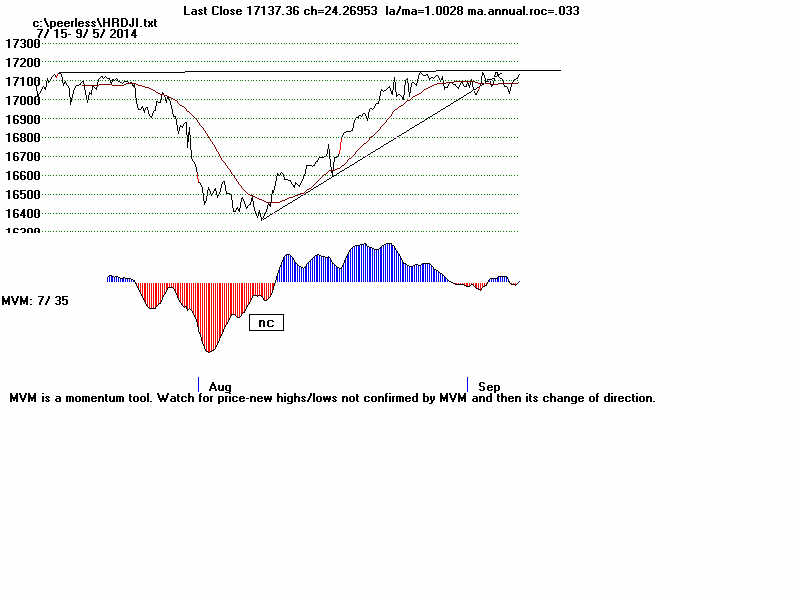
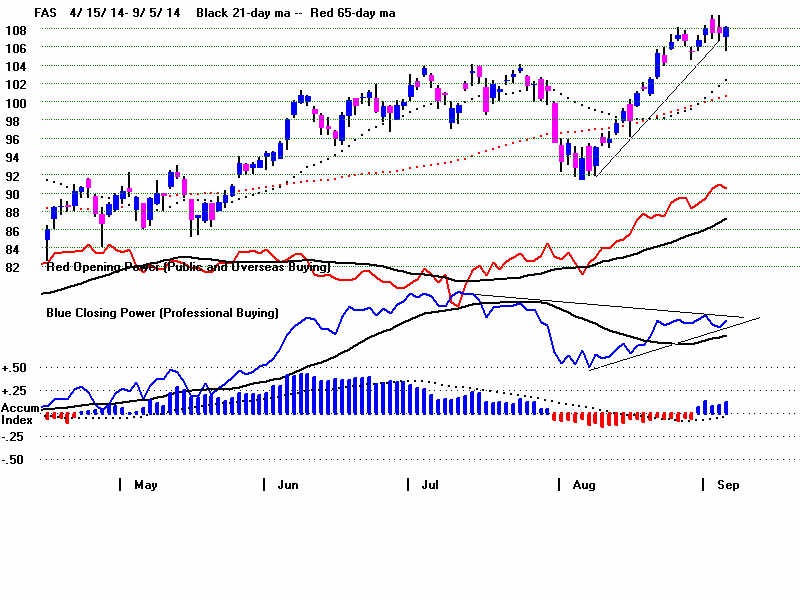
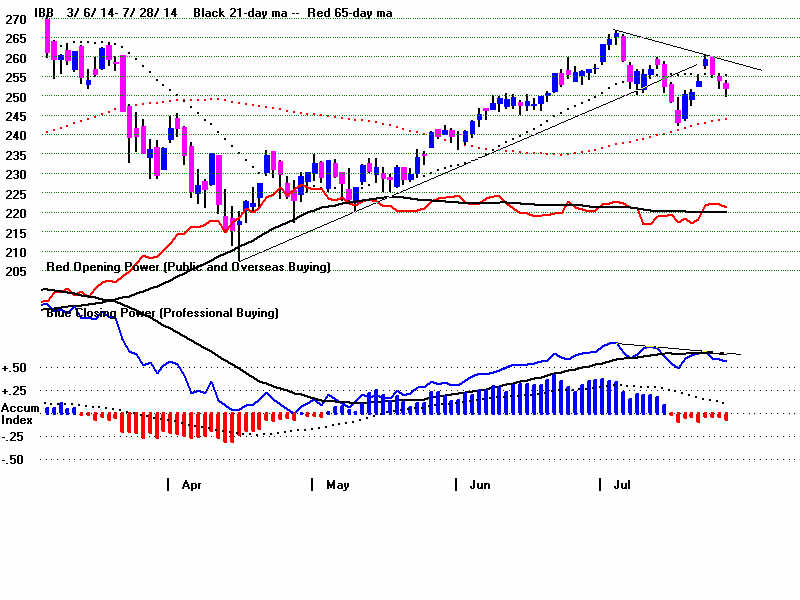