and Not Over-Staying One's Welcome
Discovering the Tell-Take Characteristics Commonly Found Just before
Stocks Double, Triple ....
Introduction - 2014 edition last rev. 12/29/2014
--------------------------------------------------------------------------------------------------------------------------------------------------------
Forty plus years' observation of stock behavior, reading about technical analysis, looking at
tens of thousands of TigerSoft charts and listening to many, many astute traders have
all led me to try to set out what I have learned since 1967 about picking and holding tightly
the best super stocks.
Perfection is something we can all strive for. But calling exact tops and bottoms
is not possible. Instead, let us try to spot the trend changes that offer the
biggest potential. The biggest aid in this, I think, is always watching for signs of
what Insiders and Professionals are doing. If we also mostly trade in the direction
that the stock's 65-day ma suggests and always watch for Peerless Sells
on the general market, then buying and very profitably selling explosive super
stocks is a very attainable objective.
Along the way, we should more and more be able to master the emotional traps
the market sets up for us. This will always be the biggest challenge to successful trading
and investing. But the more we use the techniques offered by Peerless and Tiger,
the easier it becomes to control one's own fear, greed, envy and even boredom.
TigerSoft Charts
This book uses TigerSoft's Insider Trading charts. I hope those of you who do not have
our software will consider purchasing it. TigerSoft's own creations are vital to exploit the
ideas here. In particular, I call your attention to the technical tools which we have
invented. Tiger's Accumulation Index (aka "IP21), Opening Power, Closing Power
and Day Traders' Tool. The first was invented in 1981. The last three in 1999.
What I wrote in the 1990s about Explosive Super Stocks has been validated a thousand
times and more since then. Flat topped breakouts showing bulges of Accumulation,
confirming relative strength, unusual upside volume, gaps and multiple TigerSoft major
buys are still the basis of our finding each year's new explosive super stocks, as long
as Peerless has not issued multiple major Sells and there has been a key DJI support
failure. That is what this book is all about.
But we have learned some important new things, too. Among the most important are
Seasonality, the Presidential Four-Year Cycle, Sector or Industry Ranking and how
to use Closing Power. Mote that our Hotline offers ample continuing instruction on the use
of Seasonality, the role of American Politics and Industry Ranking for now. Closing Power
is the subject of new E-book I have written.
The last twenty two years have shown me that while reported earnings matter, more
important are Accumulation Index bulges over +.375. These reflect Insider Informed
Buying. Despite the SEC, trading on advanced information about earnings to come
has become rampant. It's clear that the SEC has utterly failed to police insider trading,
especially by the biggest and most powerful banks and their chief executives. We live
in a plutocracy. The rules do not apply to the richest and most powerful. The bureaucrats
and politicians are afraid to challenge them most of the time. Given that environment,
it is more than ever incumbent on us as investors and traders to watch the insiders
using TigerSoft's Accumulation Index and Closing Power.
Note that I would consider Accumulation Index bulges above +.375 to be a strong sign
that insider informed buying is taking place, especially if the stock breaks out
of a base or breaks a long downtrend. These insiders expect prices to be much higher
in 6 months or a year when much better earnings are going to be reported.
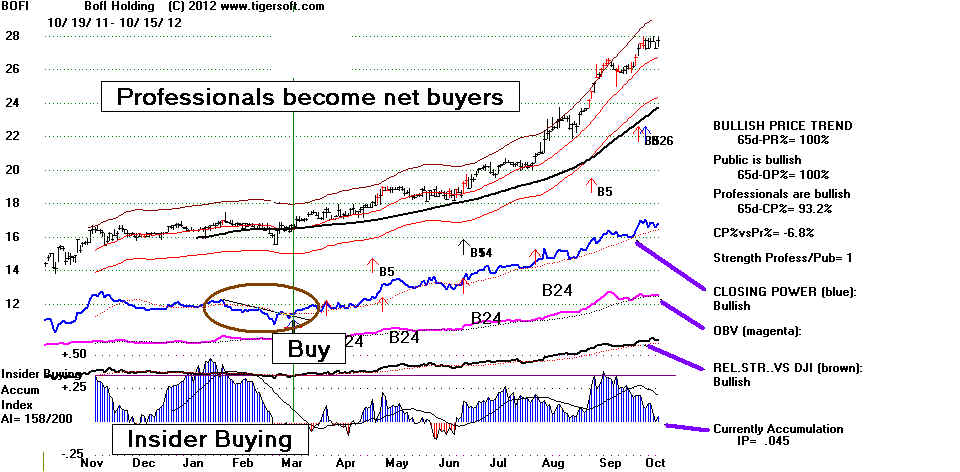
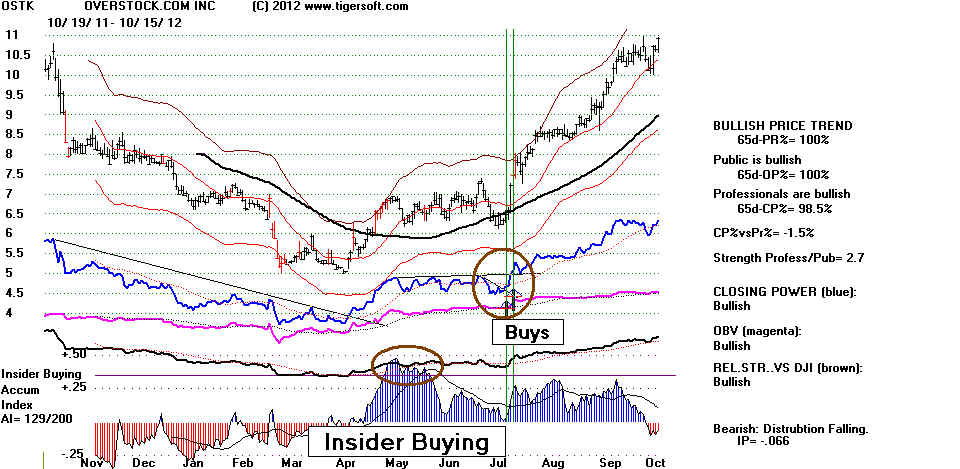
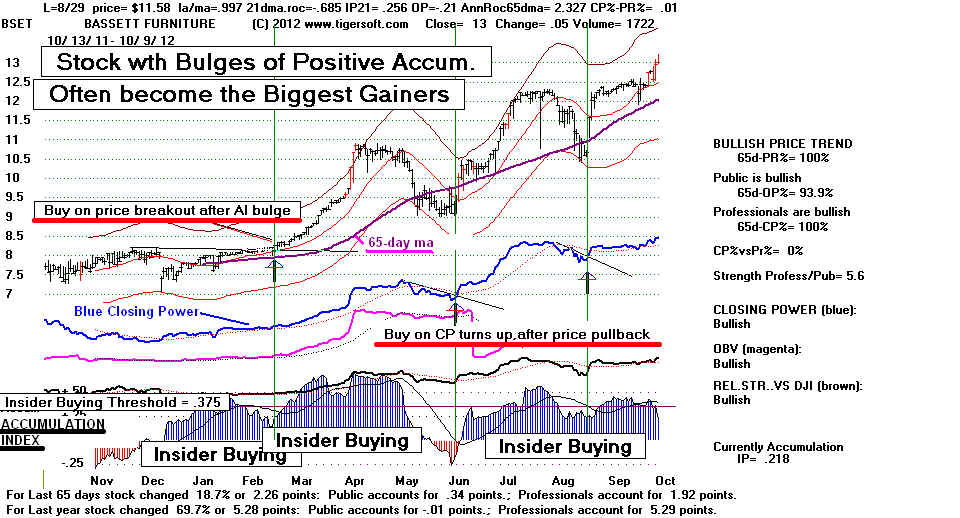
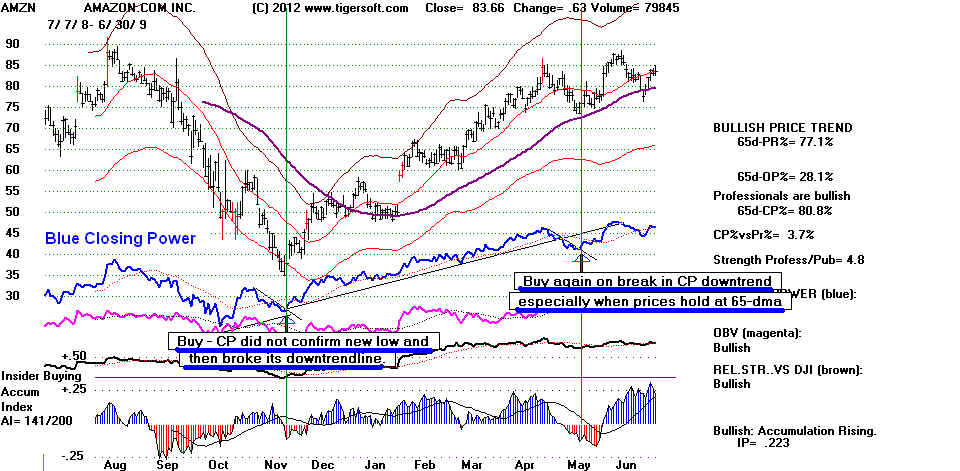
In these situations, where there is a huge bulge of Accumulation and probable insider
informed buying, we want to watch the TigerSoft Closing Power. We should treat
Closing Power as a representation of what New York trading professionals are doing
in a stock. When Professionals start buying stocks also under insider Accumulation,
the odds of a big price rise are much higher. We do not have to wait for a price breakout
when we see this. Rather, buy the stock showing a recent bulge of insider buying on a dip
after a successful test of price support to the rising 65-day ma when the Closing Power
breaks its minor down-trend and again hooks upward. Our E-Book on Closing Power has
many examples of this. By way of illustration of this and to show our new chart form,
here are two examples. You will find many more examples among our Hotline's
"Bullish MAXCP Stocks" (Closing Power new highs and lots of Accumulation) and
on the Elite Stock Professional Page.
New Rule:
Buy on Successful Tests of 65-day ma when
there has been a Bulge of Accumulation above +.375 and
the Blue Closing Power breaks its downtrend-line.
Tiger's Contributions to Technical Analysis
Before beginning with our book, let's review Tiger's tools / indicators and their uses.
1) Tiger price bands appear automatically an optimized percentage above and below
the 21-day moving average (hereafter "ma". You will see we emphasize the 21-day
and 65-day ma. because they smooth the data for a month's and a quarter's trading,
respectively. When prices are below the falling (purple) 65-dma, the trend is labeled
as "Bearish". When prices are above a rising 65-dma, the trend is labeled as "Bullish".
These were invented by me in 1980.
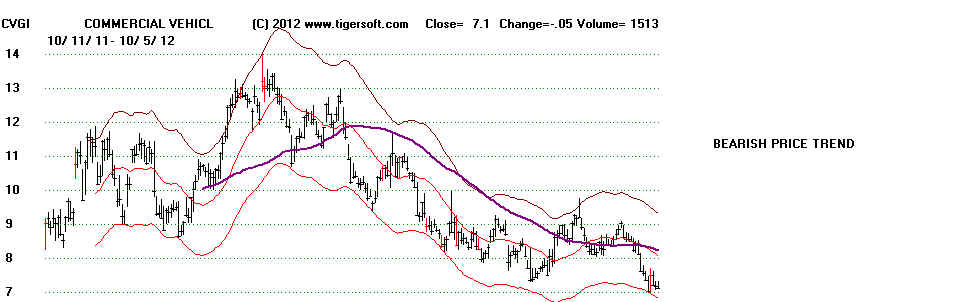
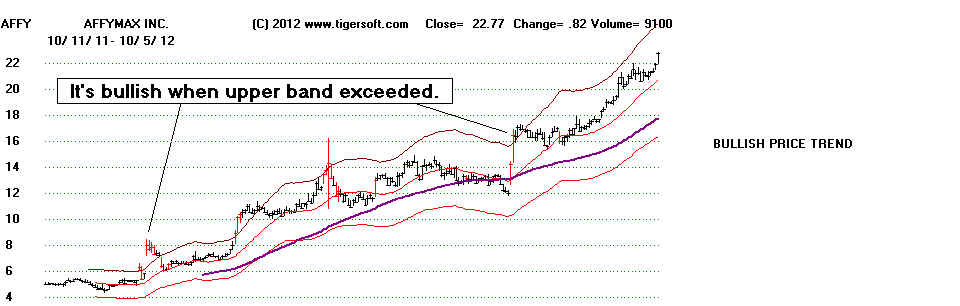
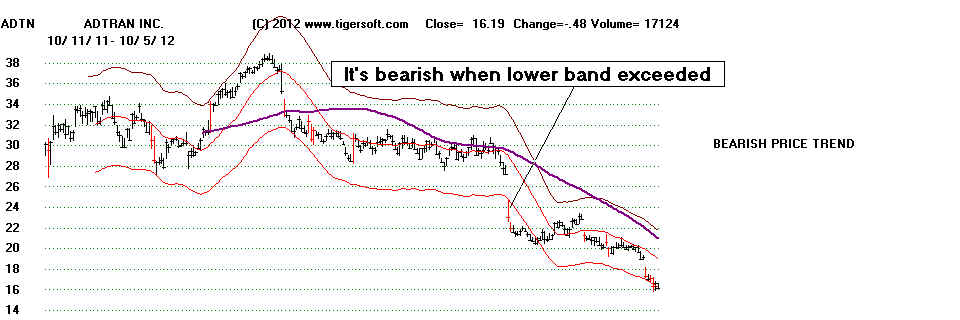
Our fixed percentage interval bands are designed to bracket 93% of a stock's trading.
It is often significant when prices move past the bands and it can be significant
when prices fail to reach the upper or lower band. Here are three examples.
Most of the time, reversals take place near the price bands. This book will help
you to know when the upper bands will likely be exceeded and a bullish price trend
will follow.
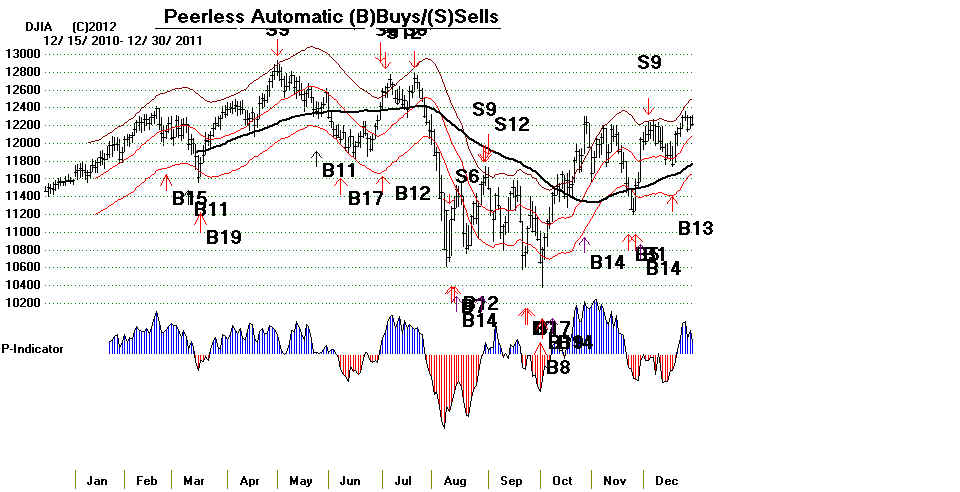
2) Use the general market Buys and Sells from our Peerless Stock Market Timing:
1915-2013. These DJI-based Peerless signals can be superimposed on any stock.
Peerless is right too many times to ignore. And most stocks move up and down with
the general market that Peerless signals predict. See the example of ADBE below.
Peerless was invented by me in 1981. It is always being back-tested and refined further..
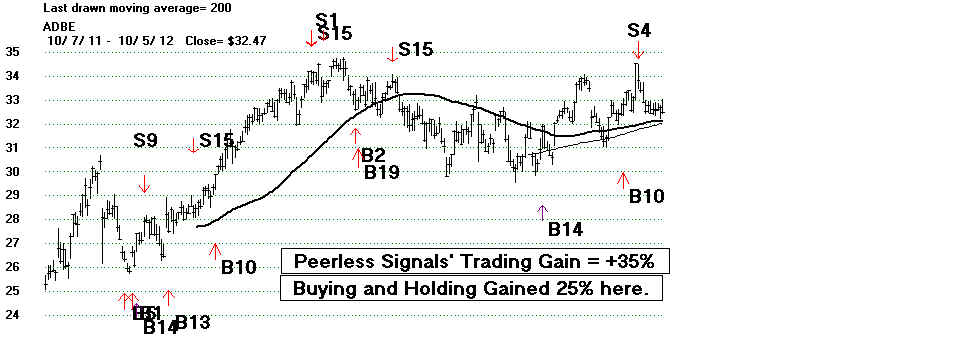
3) Optimized (red) Buy and Sell Signals appear automatically when a TigerSoft stock
chart is first displayed. The optimized buys and sells show the best trading system
for the last year among about 60 different systems that are instantly tested as you display
a stock chart. While the stock's volatility is a factor, I generally start to give significance to
the red Buys and Sells when they have gained more than +75% for the year. I would not
believe a red Buy signal based on a Stochastic if the stock has just broken major support
or completed a head/shoulders pattern, as EBAY shows in the chart below.
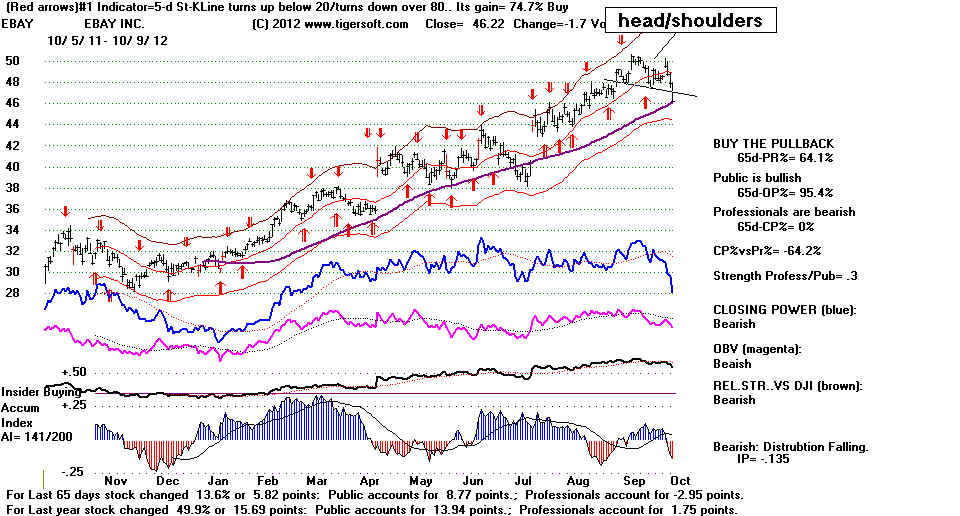
The red buy signals are much more successful than the red sell signals when the stock
is in a strong trend. The top line of the TigerSoft chart tells what the best automatic system is.
We have a 20 page discussion of the optimized signals which new customers get. These signals
were invented by me in 2001.
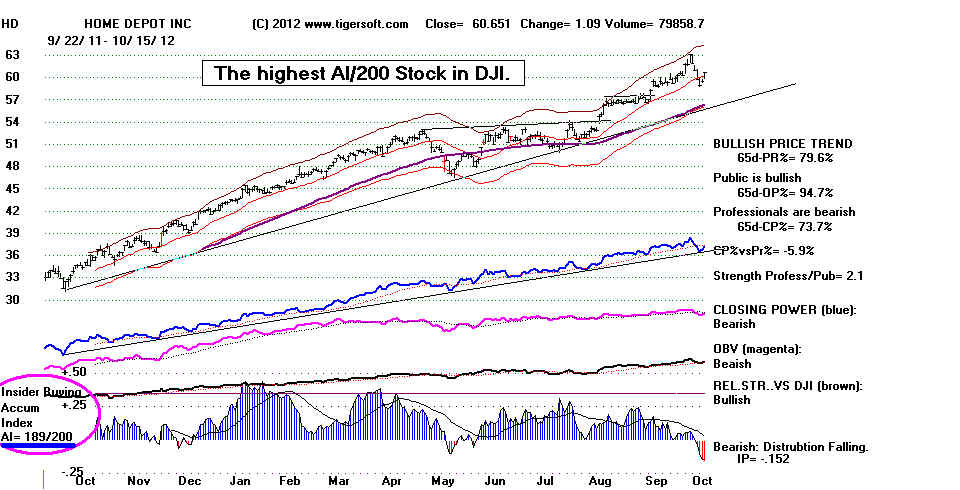
4) Tiger Accumulation Index. This was created and first used by me way back in 1981.
I had first invented this as a tool to compare stock's power ranking. But a very helpful
stock broker in Albuquerque back in 1981 suggested we should see it in graphic format.
(I still remember him. He prided himself for being a member of Mensa. I wish I could
memorialize him here by name, but I cannot recall it.). The Accumulation Index is an oscillator.
It can be (blue) positive or (red) negative. Besides bulges, we consider how many days of the
last 200 this indicator has been positive in our Tahiti system. See our 25%/Year book. Buying
such Tahiti top AI/200 stocks when their Closing Power turns up and taking profits when
the Closing Power breaks its major uptrend is a profitable approach. In addition, it confirms
an expected downtrend when it falls below its own 21-day ma and it confirms an expected
uptrend when it rises back above its own 21-day ma. You can use a vertical line to see how
these occurrences line up with prices at the top of the chart.
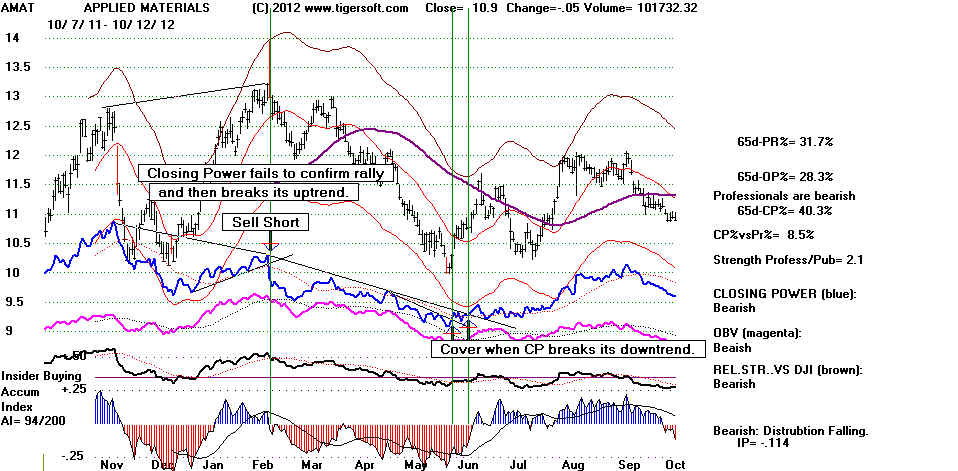
On the other hand, heavy red distribution in combination with a very weak Closing Power
makes for very good short sales. It shows that institutions, insiders and Professionals are
all trying to get out of the stock. Dips of the Accumulation below -.25 signify probable insider
selling. Selling short these stocks when their Closing Power breaks its minor uptrend is a
recurring theme on our Hotline's "Bearish MINCP Stocks" and our E-Book on book on
Closing Power.
In finding explosive super stocks early on, we want to search for stocks showing Accumulation
Index bulges over, at least, +.375. Price breakouts above flat tops work well in these stocks.
So does buying when the blue Closing Power turns up and buying on breaks of its minor downtrend
when the stock has pulled back to its 65-dma. We consider bulges of Accumulation above +.375
to be signs of insider buying. Much higher levels of Accumulation for longer period of times
are even more bullish, just as are positive AI/200 scores above 193 are.
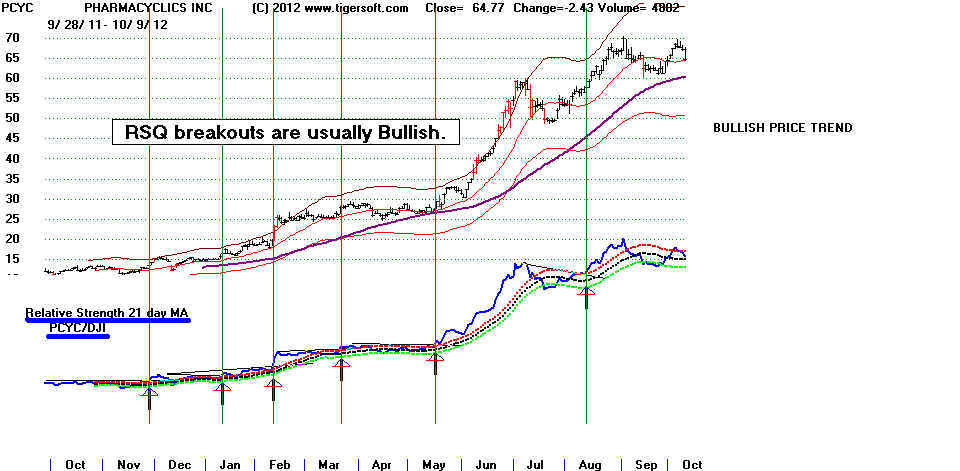
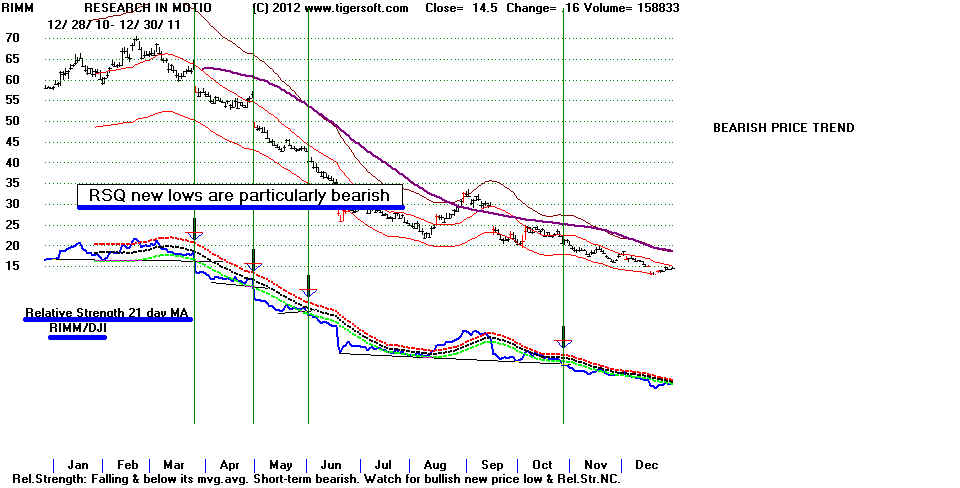
5) Tiger Relative Strength Quotient (RSQ) breakdowns and breakdowns often lead to a much
bigger move. RSQ trendbreaks are helpful used in conjunction with other internal strength indicators.
RSQ trendbreaks are most valuable when they follow RSQ failures to confirm new price highs or lows.
This was first used by us in 1981.
/
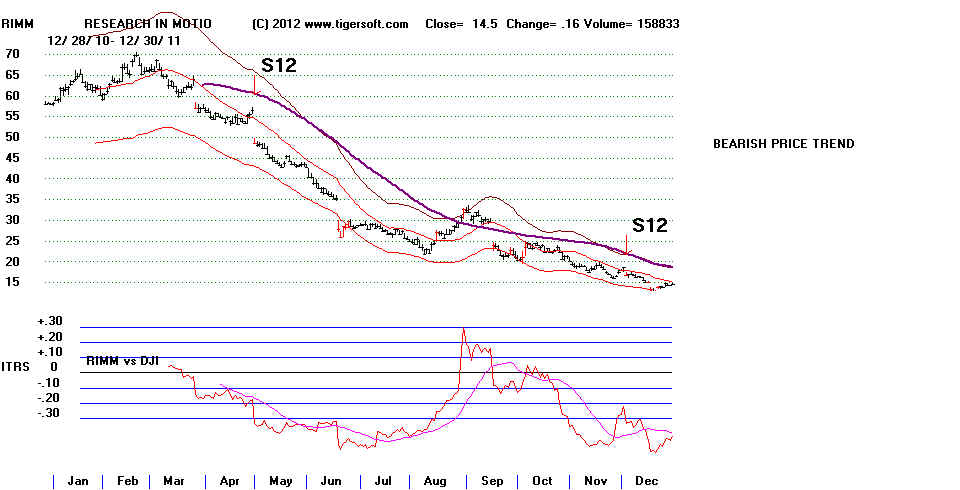
6.) Intermediate-Term Relative Strength. ITRS is the 50-day percentage change in
the selected stock minus the 50-day percentage. I consider an ITRS move above +.30 to be
bullish. It is flagged as a Buy B26. An ITRS move below -.30 is a Sell S12. Used with other
confirming internal strength readings, these signals are very reliable trading signals. This
was first used by us in the early 1980s when the stock market began booming in 1982.
B26s Show the ITRS has surpassed +.30
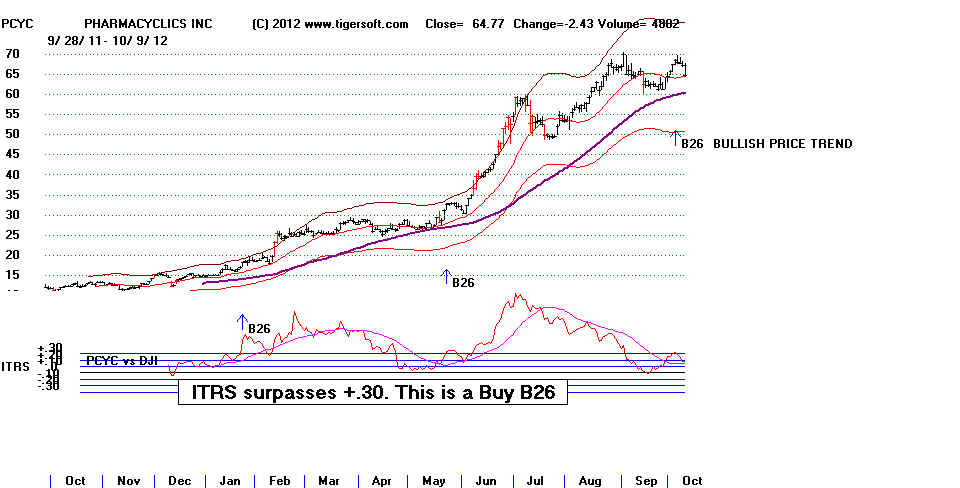
S12s show the ITRS has fallen below -.30
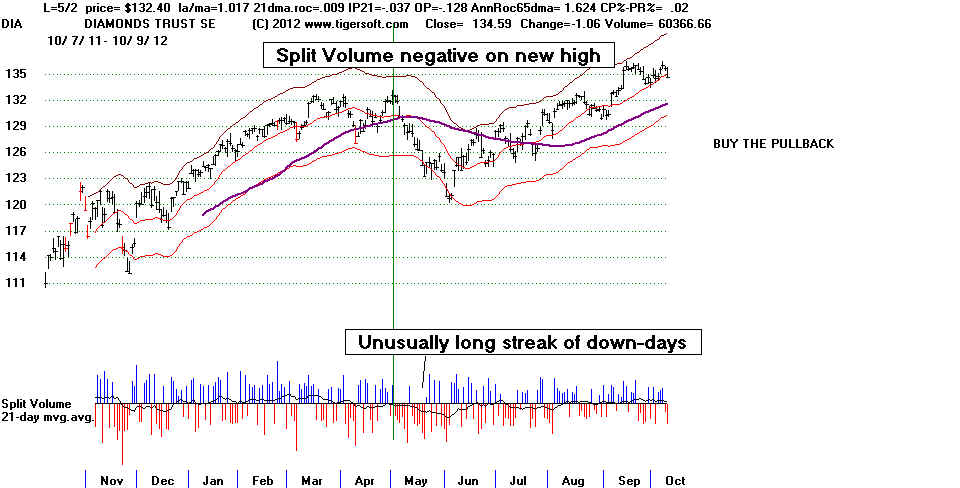
6) Tiger Split Volume Indicator. This tool allows us to see bearish Split Volume MA
non-confirmations of new price highs as well as unusual volume and Split Volume MA non-confirmations.
7) Tiger's Opening Power Line is a cumulative line showing the changes in price overnight,
from one day's close to the next day's opening. This most heavily reflects Overseas
and Public trading trends. It also reflects where market makers choose to open trading in a
stock, based upon their own needs to buy or sell short. As a result, its trend is often misleading
or downright wrong when it diverges from Tiger's Closing Power. Higher openings followed
by a fading of price for the rest of the day are a bearish. Lower openings followed by price
strength for the rest of the day are bullish. Opening Power's trend is at its best as a predictor
when public speculation runs high and its trend is moving in the same direction as Closing Power.
When both Opening and Closing Power are in rising trend, prices advance most easily. But
such trading can be a sign of an impending buying climax. In this cases, sell when Closing
Power breaks its uptrend. When both are falling, prices drop quickly. Cover short sales
when Closing Power breaks its downtrend. Opening and Closing Power were by me
and introduced to Tiger users at our 1999 Las Vegas trading seminar at the Mirage.
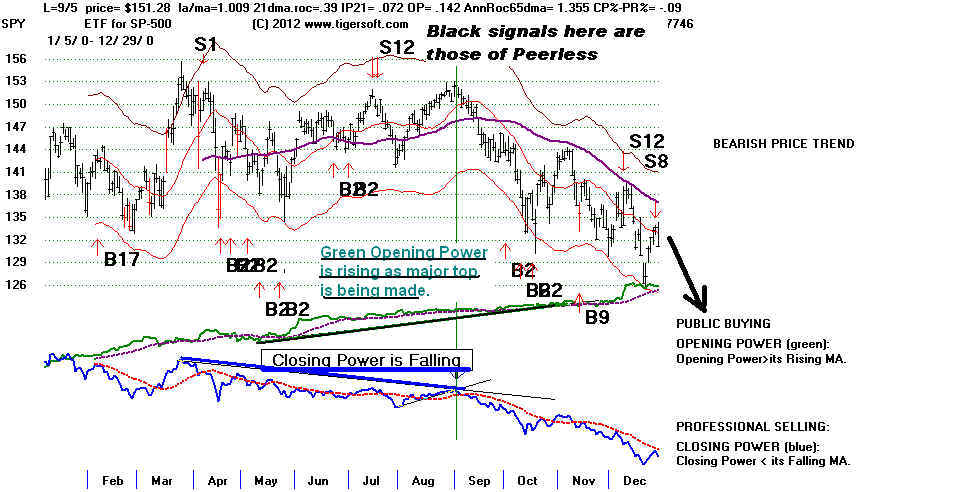
8) Tiger's Closing Power Line is a cumulative line showing the changes in price overnight,
from the day's opening to the same day's close. This most heavily reflects US Professional
net buying and selling trends. Usually prices go in the direction that Professionals want.
When Opening Power and Closing Power diverge, we usually bet that prices will go in the
direction of Closing Power. We have found that the most reliable Closing Power trend-breaks
are those that follow a Closing Power non-confirmation (NC) of a new high or low.
Buy when CP breaks its downtrend after CP failed to confirm a new price low.
Sell Short when CP breaks its uptrend after CP failed to confirm a new price high.
9) Tiger Day Traders' Tool. This is a cumulative line showing whether there is more potential
gain buying or selling short at the opening and closing out the position later the same day.
. The daily percent change from the opening to the low is subtracted from the daily percent
change from the opening to the day's high. A running total is kept. This was invented by me
in 1999.
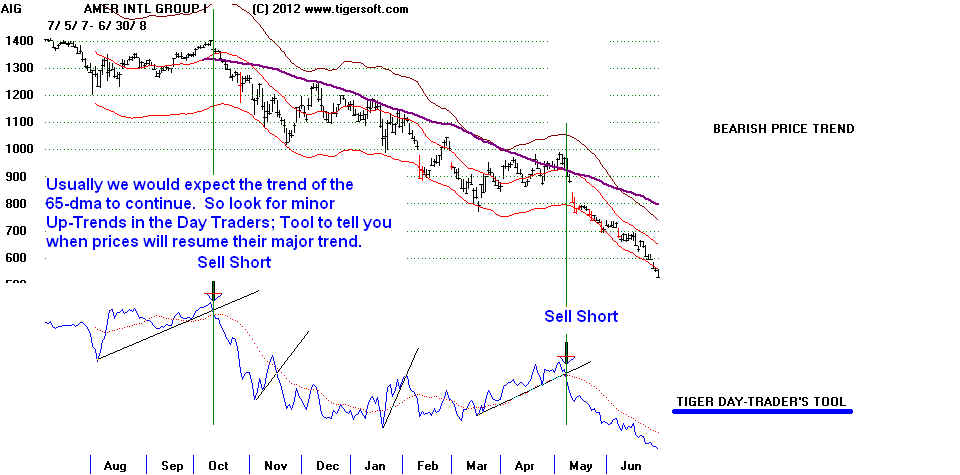
As with Closing Power, we look for trend-breaks and divergences from price trends.
This tool was designed to show day traders if they should be buying or selling short at the opening.
But the indicator is more powerful than that. The Day Traders' Tool's trend often anticipates
or confirms intermediate and major swings of prices. Professional day traders should watch
the Tiger Day Traders' Tool carefully, These work well with active individual stocks as well as
key ETFs, too.
Tiger's Day Traders' Tool Failed To Confirm APPL's Bear Market Low in 2009
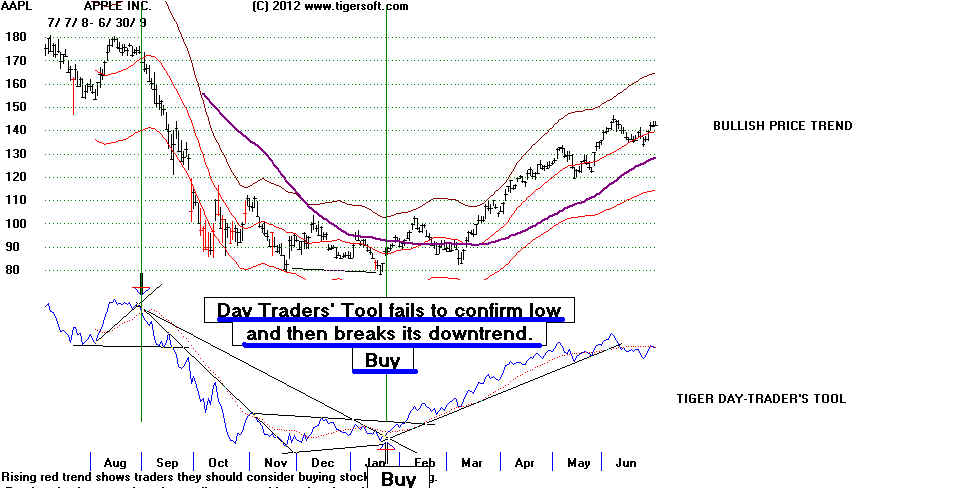
Trend-Breaks of Tiger's Day Traders' Tool are best used in conjunction
with other indicators and trend of 65-dma.
,
I mention these creations proudly to claim them as intellectual property, in hopes that
users will keep them secret from others. It is only fair that TigerSoft will receives
proper credit for creating these and showing their proper use. The formulation of the
TigerSoft indicators is presented here. Our automatic major Buys will also be explained.
The flagging and ranking is more complex, but I will try to make explicit the approach
taken. Of course, there are many chart patterns and concepts which I have borrowed
from the broader literature of technical analysis. These include "trading ranges",
"breakouts", "all-time highs", "head and shoulders patterns"and On-Balance-Volume
(OBV). These can be looked up on the internet if necessary, I think that their
definitions will be made clear by their usage.
Tiger's Strategy for Successful Investing
So, let us assume now our common objective is to make big money over a year's time
by purchasing four or five individual stocks. How do we accomplish this objective?
1) We must be satisfied that the general market is safe and there will not be a
big decline while we are buying or holding speculative growth stocks, as they
could easily fall 25% or more of their value in even a DJI correction of 12%. In a
bear market, the losses can become calamitous. We urge you to use our Peerless
to prevent being caught in a bear market. The Peerless track record of calling
major market tops since 1981 is, in fact, without any peers.
See Peerless Stock Market Timing: 1915-2013
2) If you like to look at earnings, looking for earnings' growth acceleration. Earnings
do power price advances. Price earnings ratios can expand dramatically when a pattern of
rising earnings is shown. Most explosive super stocks do show earnings' upswings.
I only want you to validate such growth as being likely to continue them by making
sure that insiders and professionals are still buying the stock in question. This will
help you identify truly explosive super stocks among already uptrending stocks.
Buy them on dips when their Closing Power hooks back upward or buy them on
confirmed breakouts past flat tops.
3) We wan also to identify stock to buy by looking for stocks with very favorable internal
trading action even while they are still in a trading range. TigerSoft's ranking and flagging
programs make this easy. Run the Analysis Program and the look at the "bullish" stocks
when the market is weak. Here we will want to search for stocks that are still in bases
that show spikes of insider buying from our Accumulation Index and have rising Closing Power,
OBV and Relative Strength Lines that are running ahead of the price action.
4) We want to watch the action of the stocks as they breakout. Which are the first to make
new highs? They are apt to be the leaders in the next market surge. Which stocks are
breaking out with confirming internal action? Which stocks gap up on high volume? This
is shown by red price bars. And which stocks can be eliminated because their breakouts fail?
We should not be afraid to sell a laggard to buy a much stronger stock.
5) Let's learn how the best stocks behave as they add one big run onto another. What are
the signs of internal strength as well as price momentum which are most apt to make them
an explosive super stock? Looking at the Bullish MAXCP stocks night after night on
our hotline is one way to do this. Running the Analysis Program and displaying the
best performing stocks for the last 250 trading days works, too. What do the best
performing stocks have in common? That's what this book is about. You can also see lots
of examples to study by Googling "Tigersoft" "best performing stocks".
TigerSoft New Service/Blog - BEST PERFORMING STOCKS
BEST PERFORMING STOCKS OF 2010: TigerSoft's INSIDER ...
TigerSoft New Service and Blog - 4/14/2008 - LESSONS
TigerSoft New Service/Blog - 6/18/2008 - . How To Find Explosive Super Stocks...